Month: June 2018

Wireframe

DEFINED BY LINES.

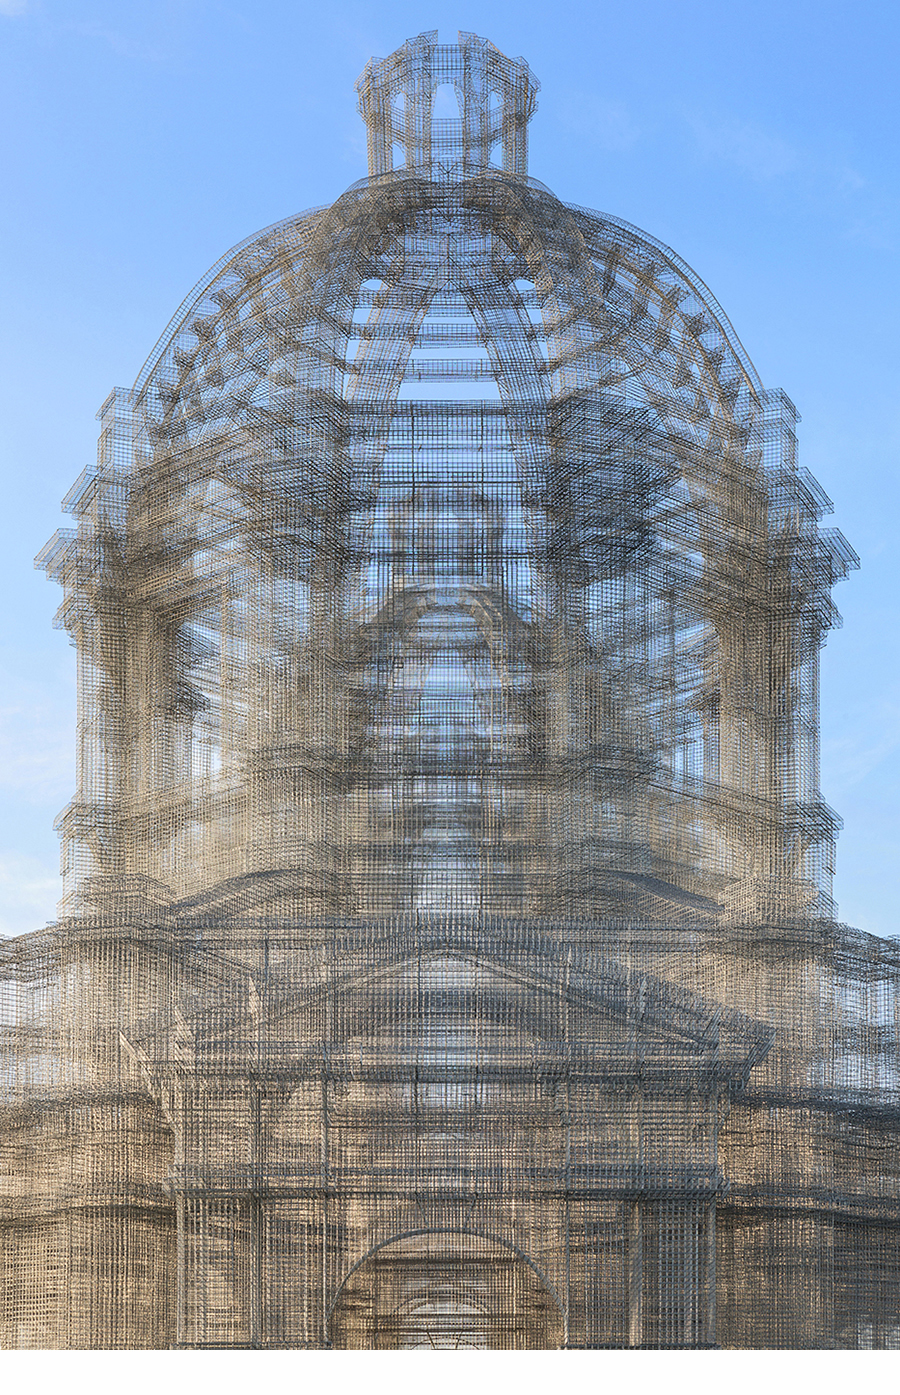
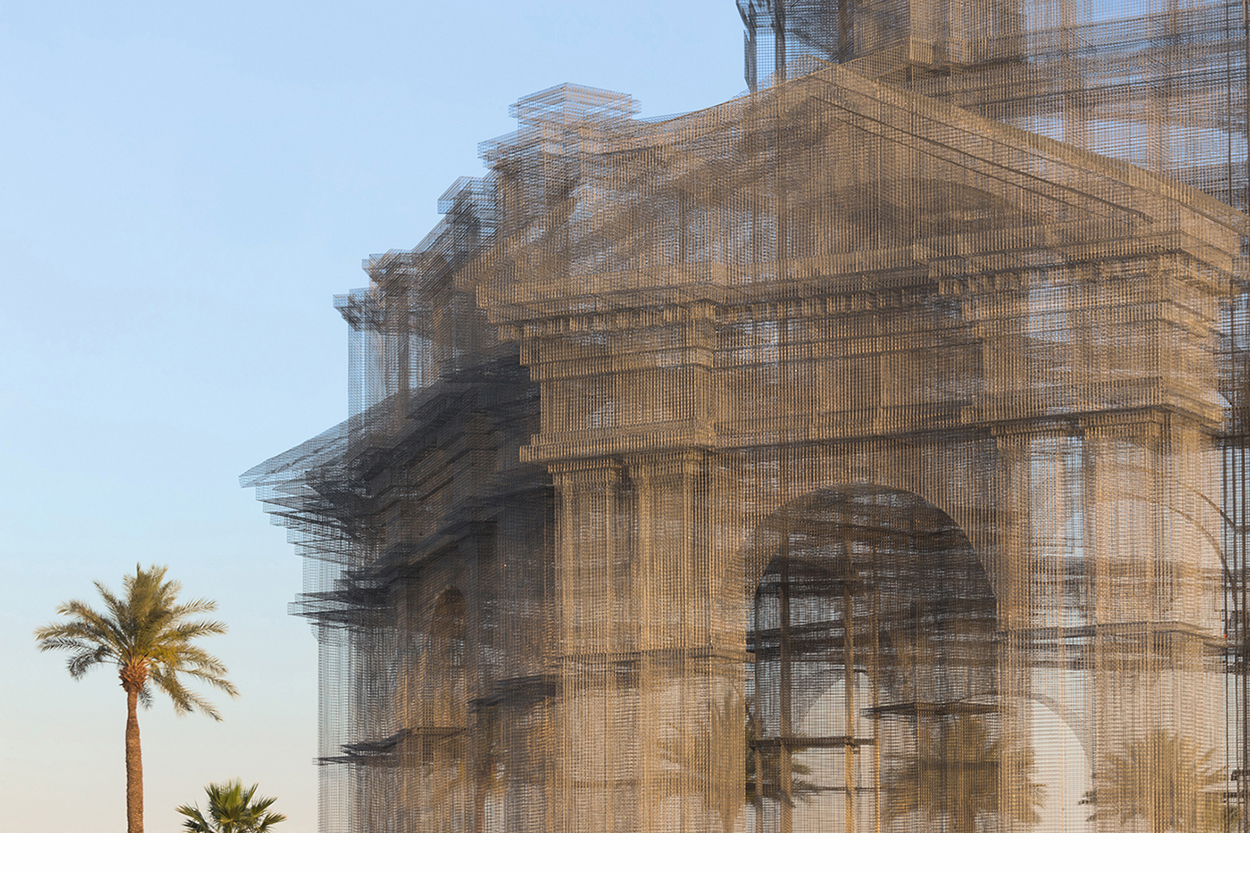
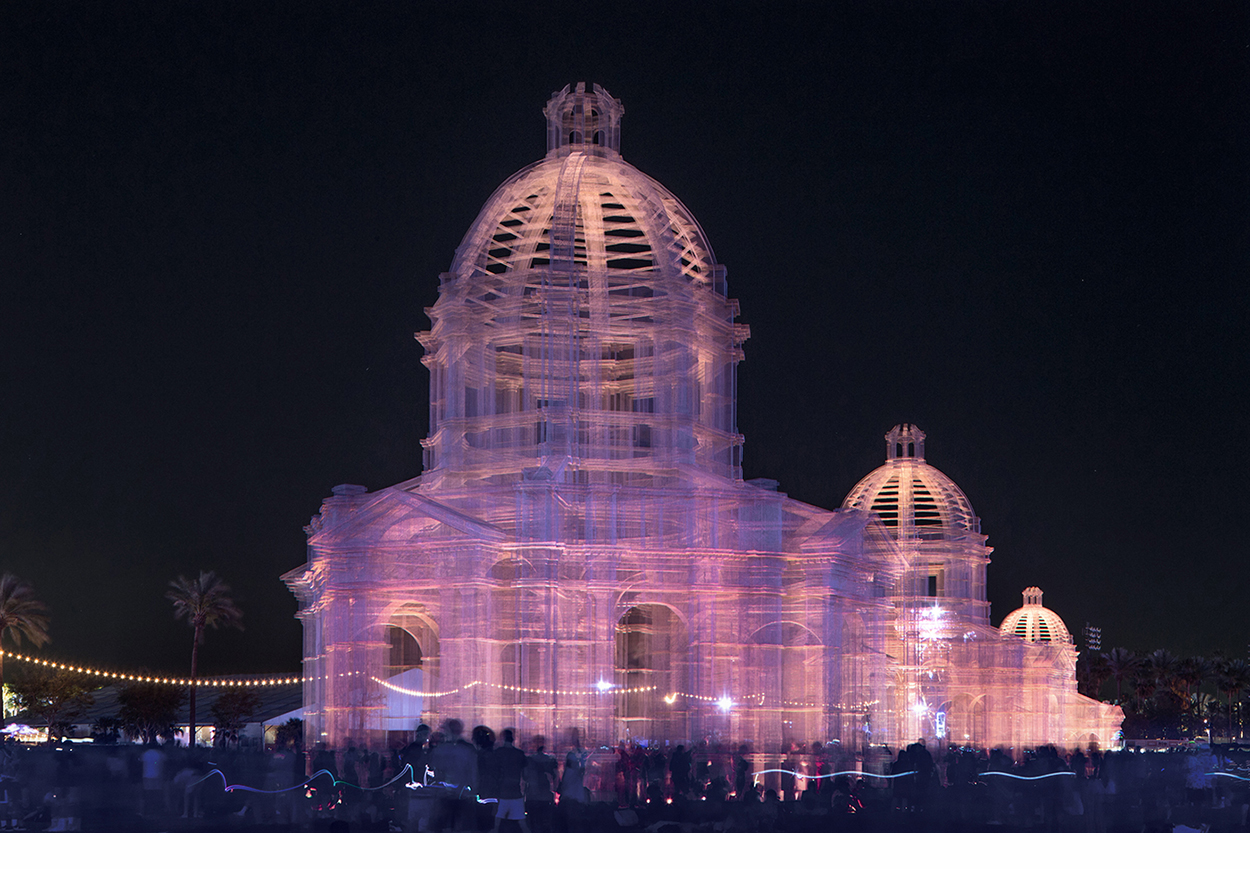
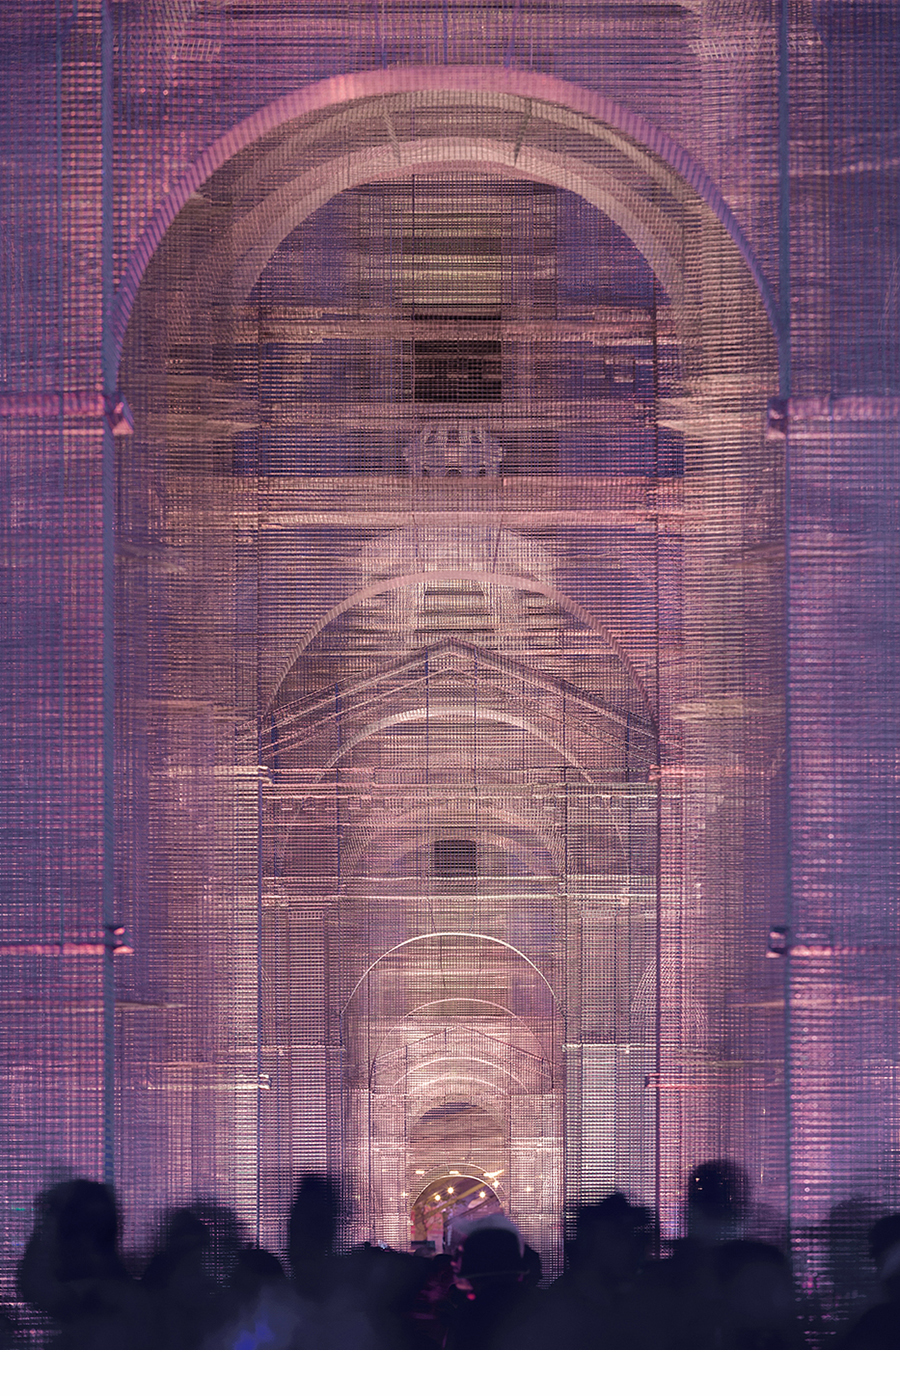
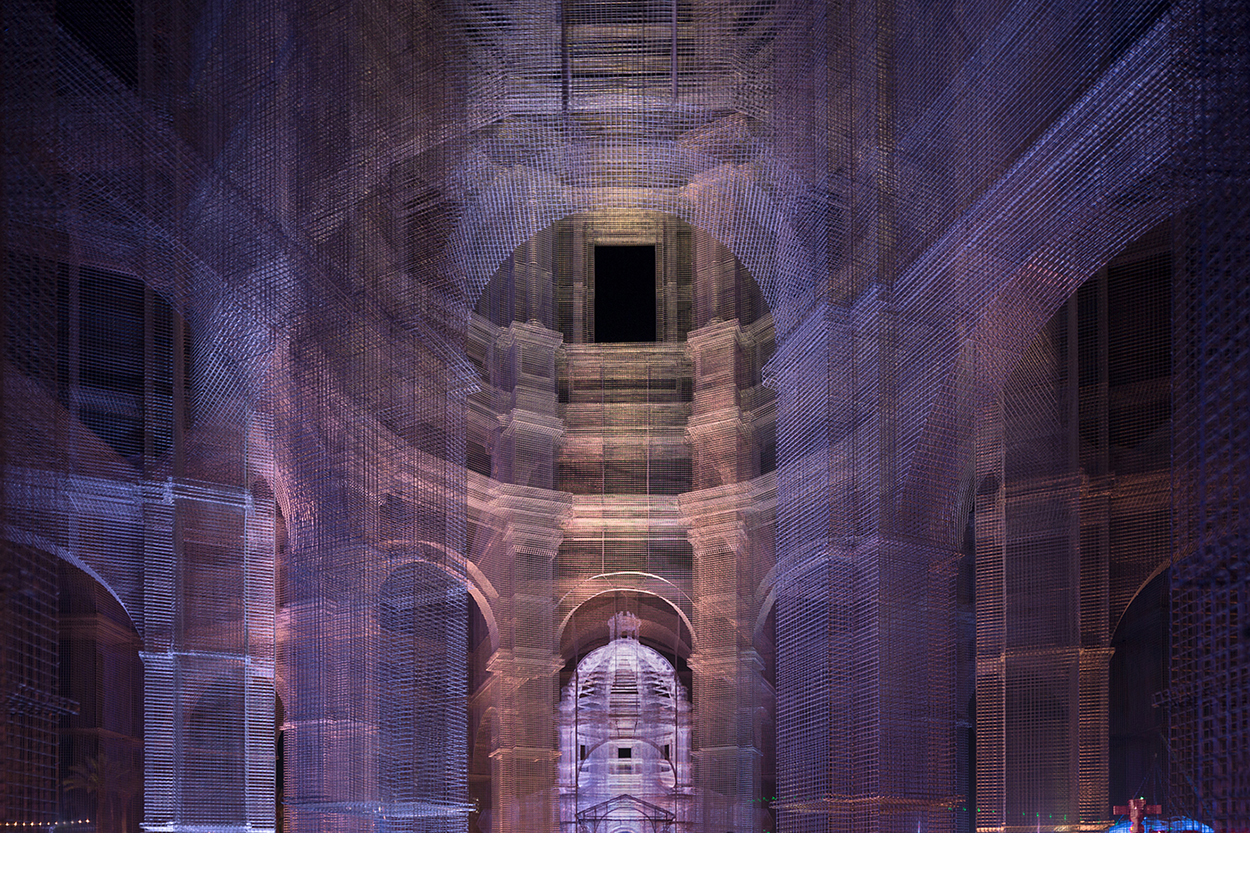
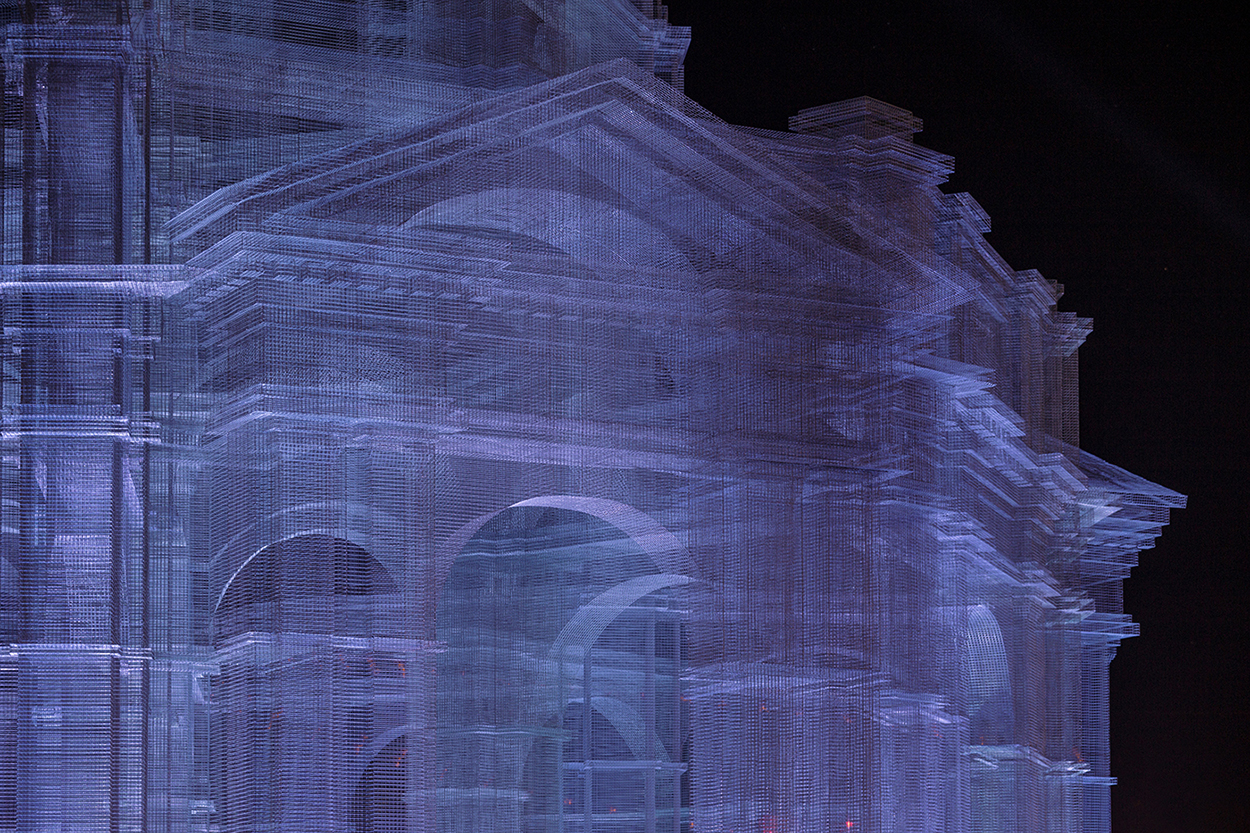
“Etherea” was an installation by Edoardo Tresoldi at the 2018 Coachella Valley Music and Arts Festival in Indio, California. A transparent building (inspired by Neoclassical and Baroque architecture) was constructed from wire mesh in three different sizes.
The structures were 36, 54 and 72 feet high (11, 16 and 22 meters).

https://www.edoardotresoldi.com

https://www.instagram.com/edoardotresoldi/

Photographs © Roberto Conte: https://www.robertoconte.net

Antique/modern

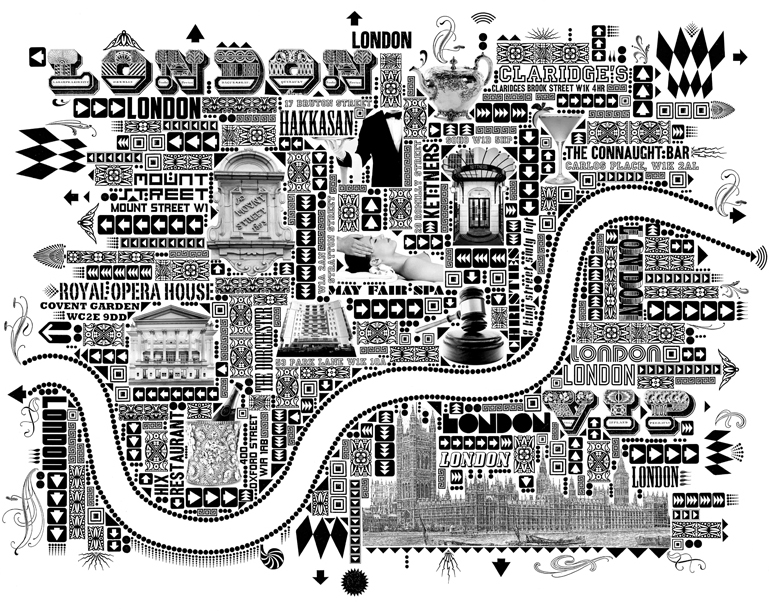
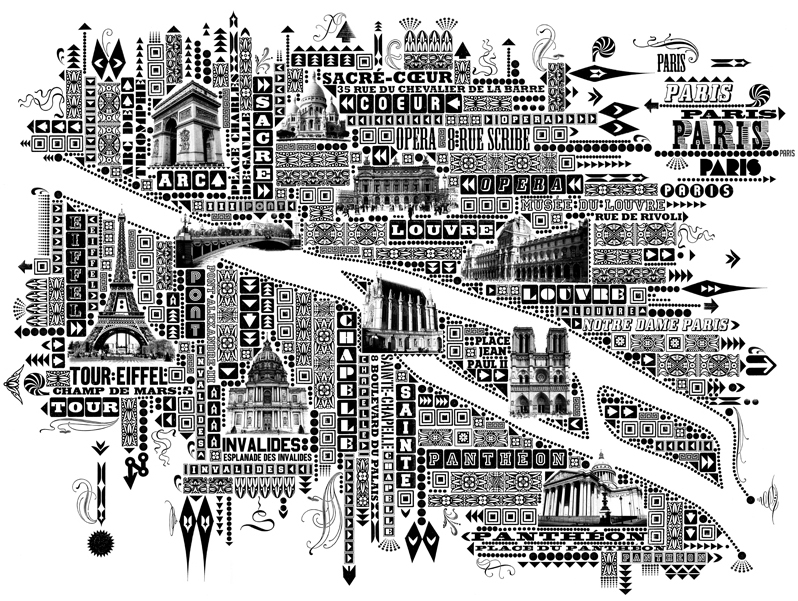
COMPLEX COLLAGES BY LORENZO PETRANTONI.

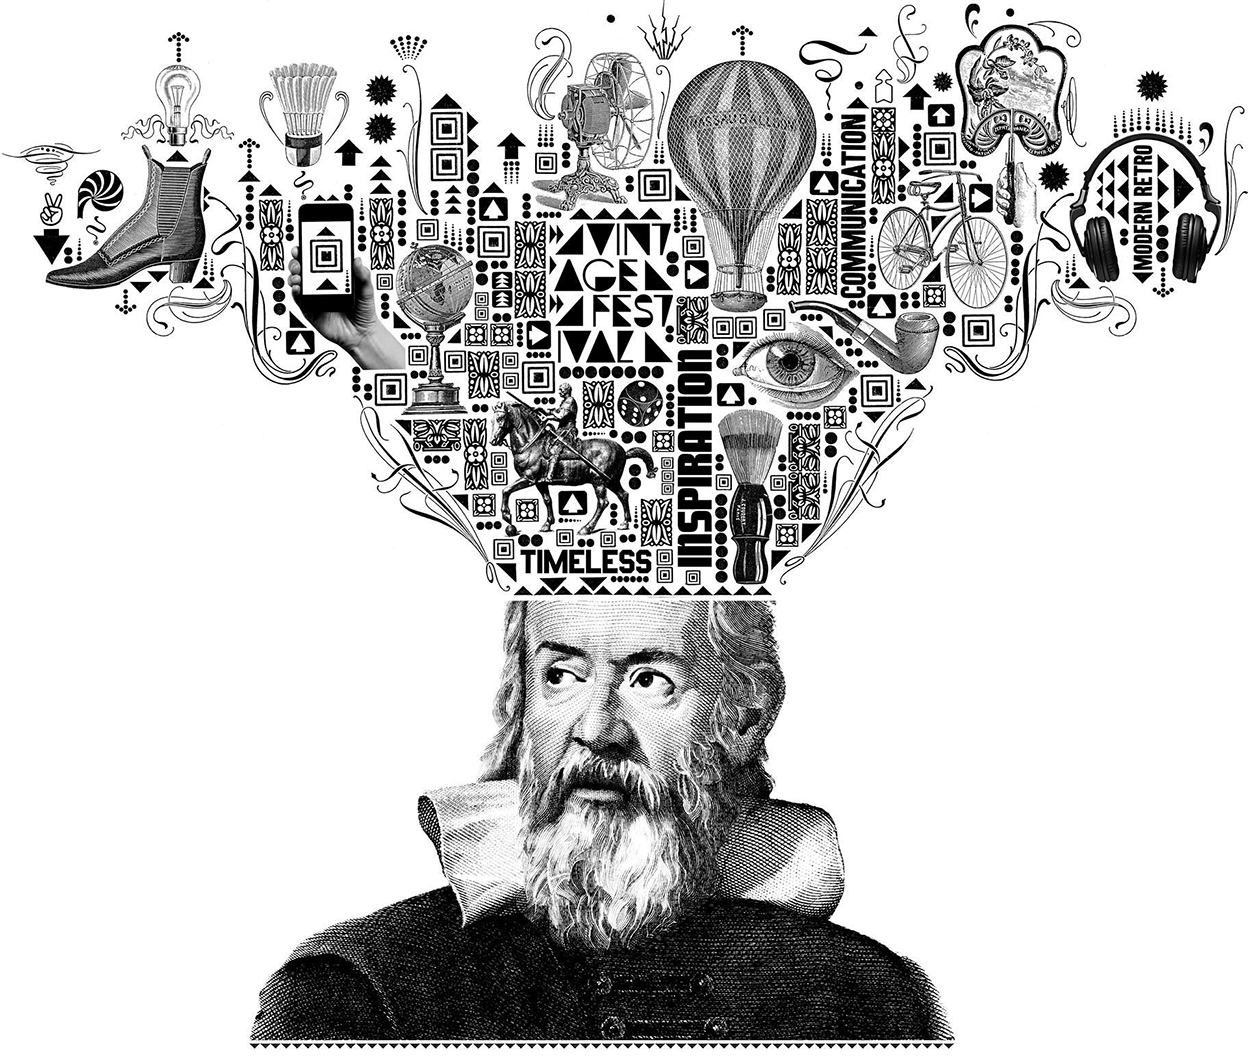
Using images from nineteenth-century antique books, Lorenzo creates these decidedly up-to-date illustrations, using old-school methods: a photocopier, knife, scissors, and glue.

From City Maps and Stories: https://amzn.to/2lm2ha2

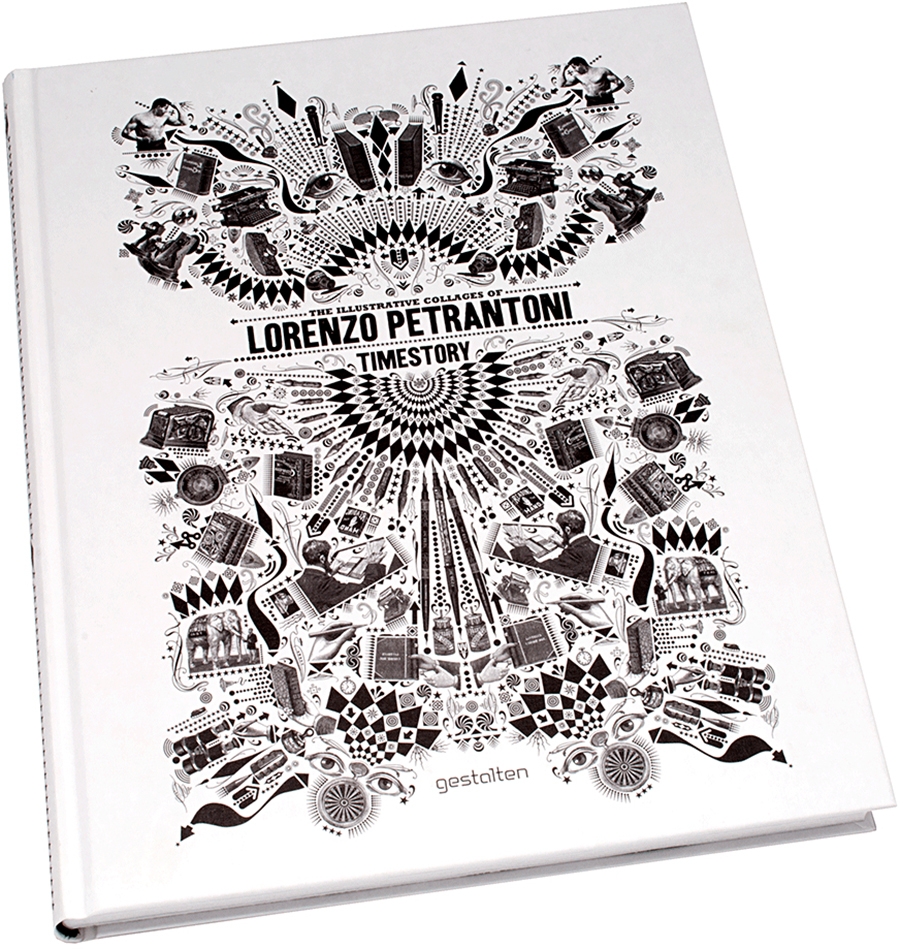
“Timestory” is a collection of Lorenzo’s projects, published by Gestalten. https://amzn.to/2K0NPyX

Lorenzo’s biography.

Website: http://www.lorenzopetrantoni.com

Instagram: https://www.instagram.com/lorenzopetrantoni/

Facebook: https://www.facebook.com/lorenzopetrantoni/

Cadillac

TWENTIETH-CENTURY WHEELS.

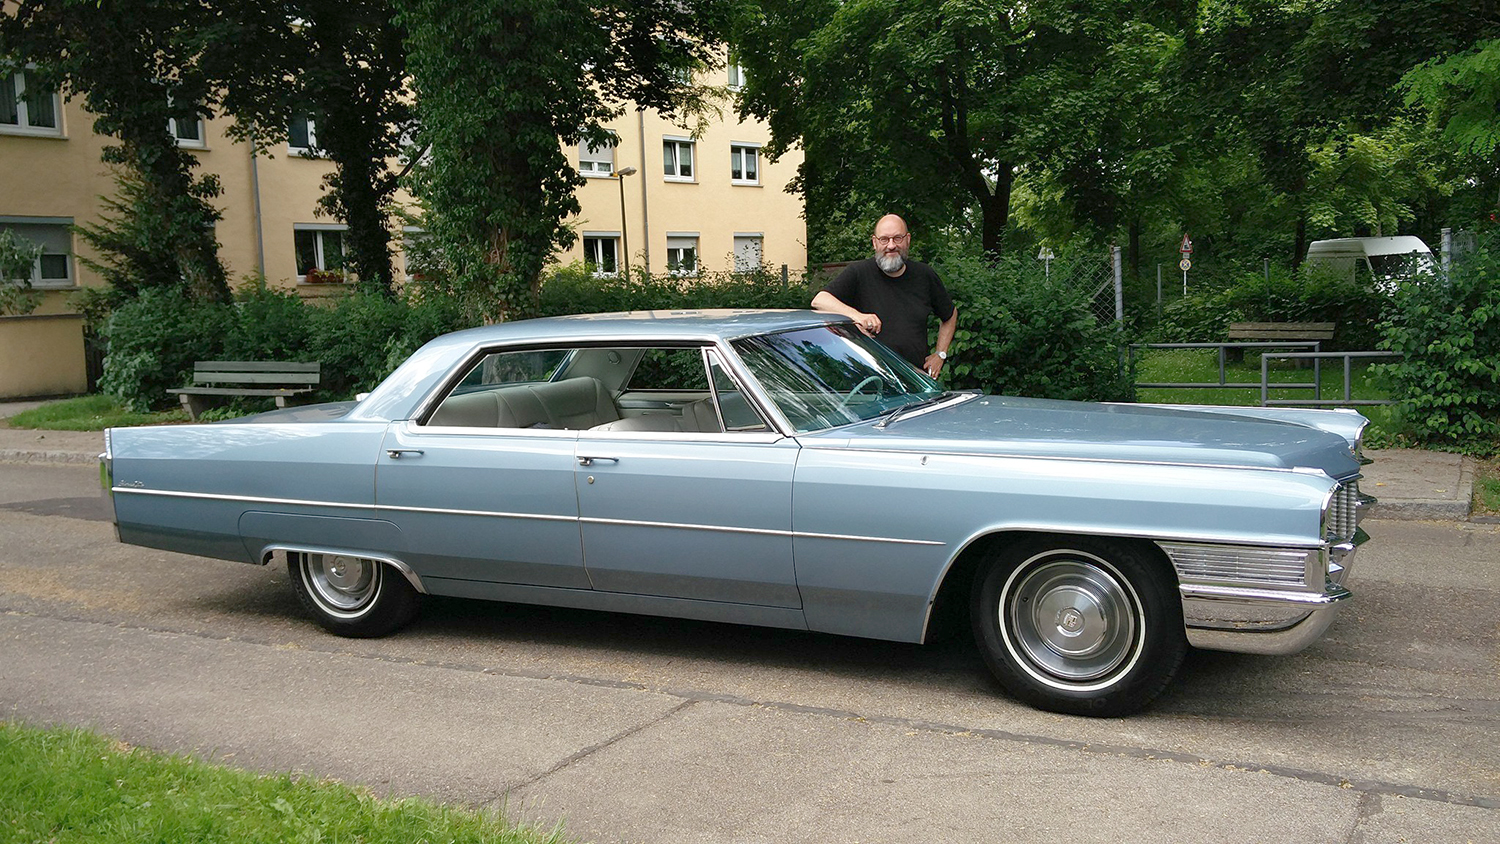
The latest addition to the “Michael Stoll Collection” takes us on the road. A magnificent 1965 Cadillac Hardtop Sedan de Ville, seen here with it’s new owner. It was purchased in Florida and shipped to Bavaria. After some minor conversions to conform to European standards, Michael is now dazzling the inhabitants of Augsburg with his beautiful Hampton Blue automobile.

The Sedan de Ville was designed by Bill Mitchell. He was only 24 when he became Cadillac’s Chief Designer in 1936, and his career at General Motors lasted 42 years. So many classic Cadillacs are his work, including the tail-finned models of the ’50s and early ’60s. (Fins were originally inspired by aircraft design, and were the brainchild of General Motors head designer, Harley Earl.)

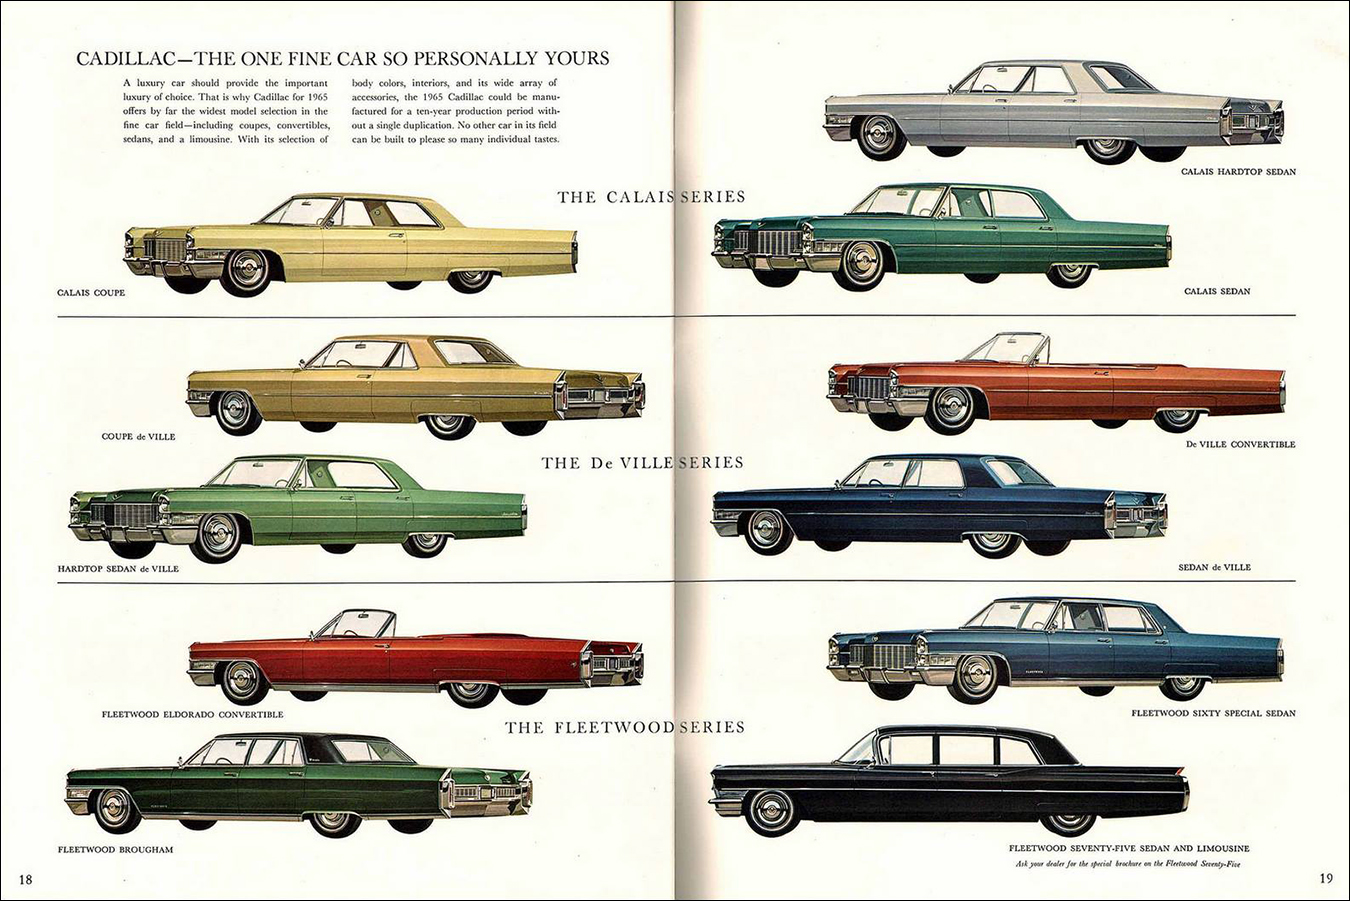
The 1965 Cadillacs where the first models for several years to be designed without tail fins. Michael’s car is third down on the left (shown in green here).

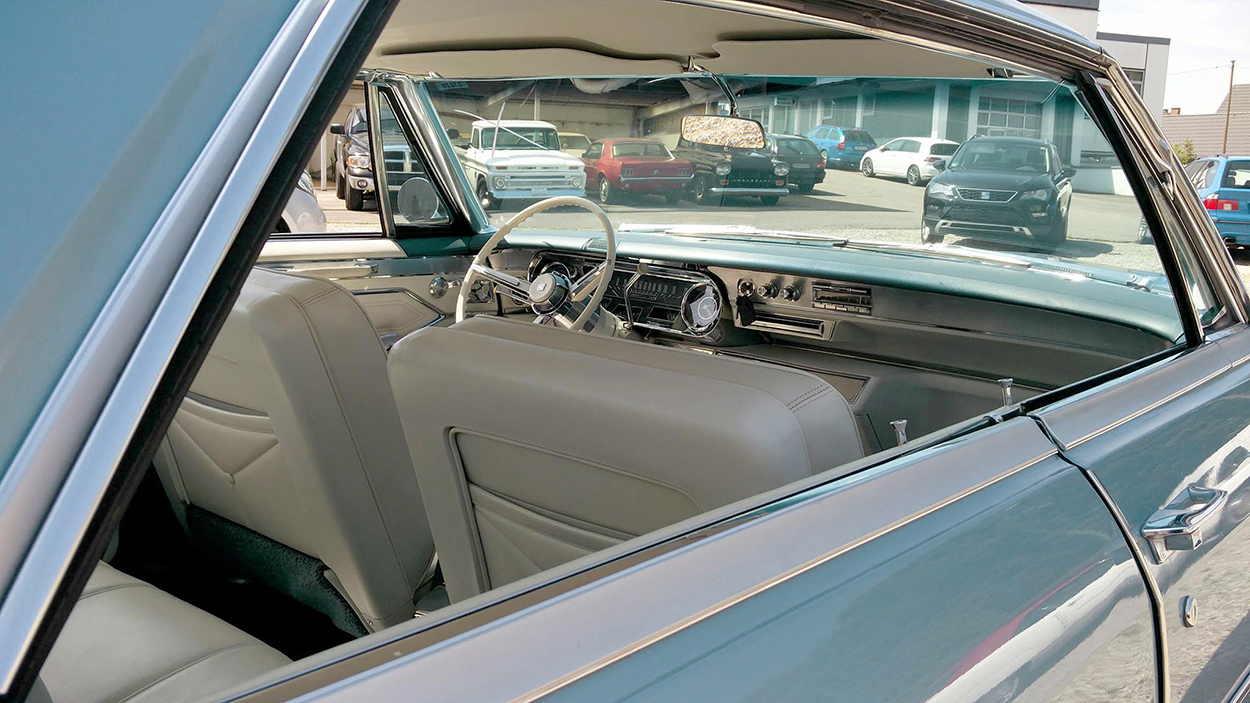
The stunning interior features Natural White leather. The absence of door pillars allows an uninterrupted view to the side.

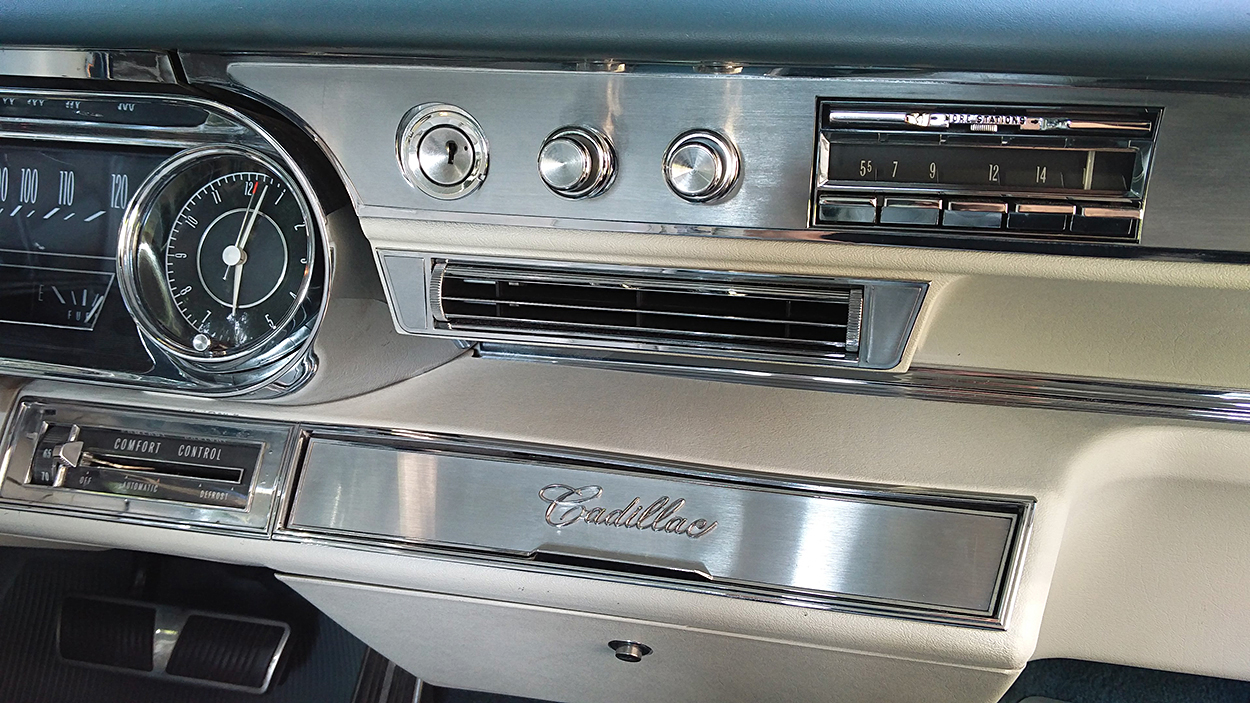
Dashboard detail.

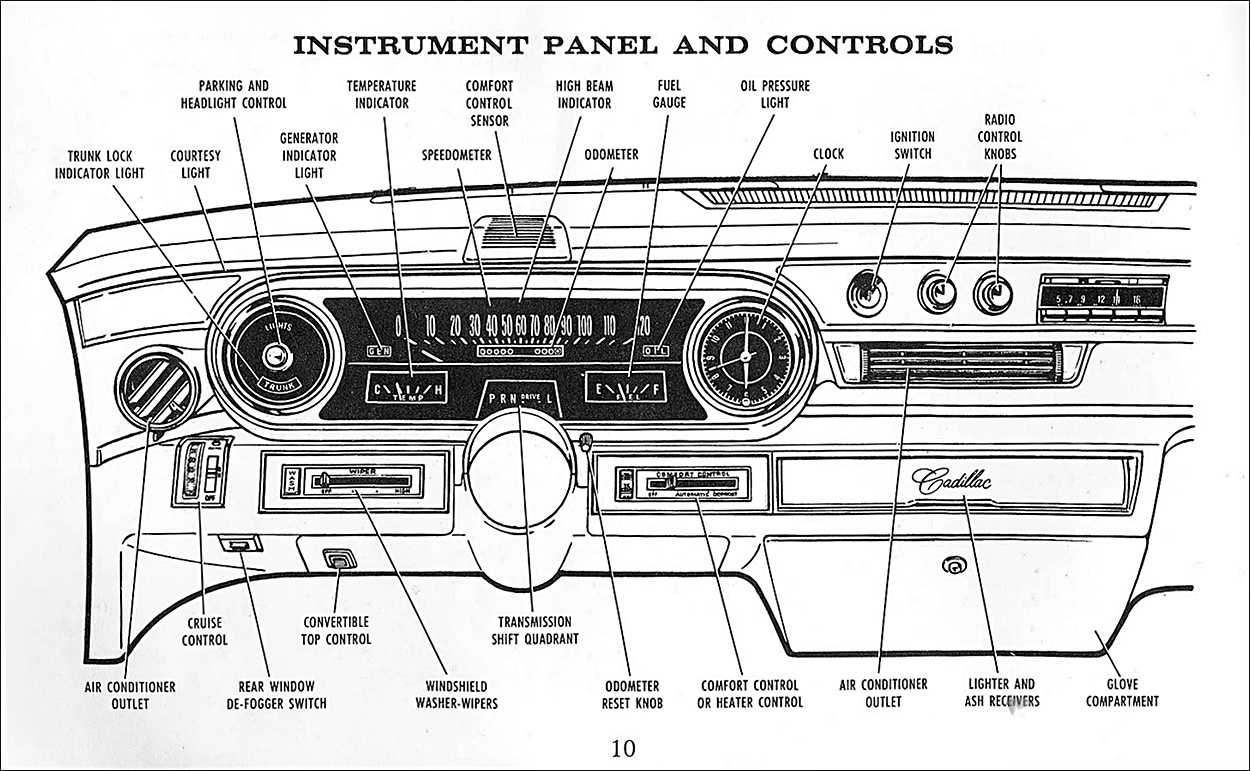
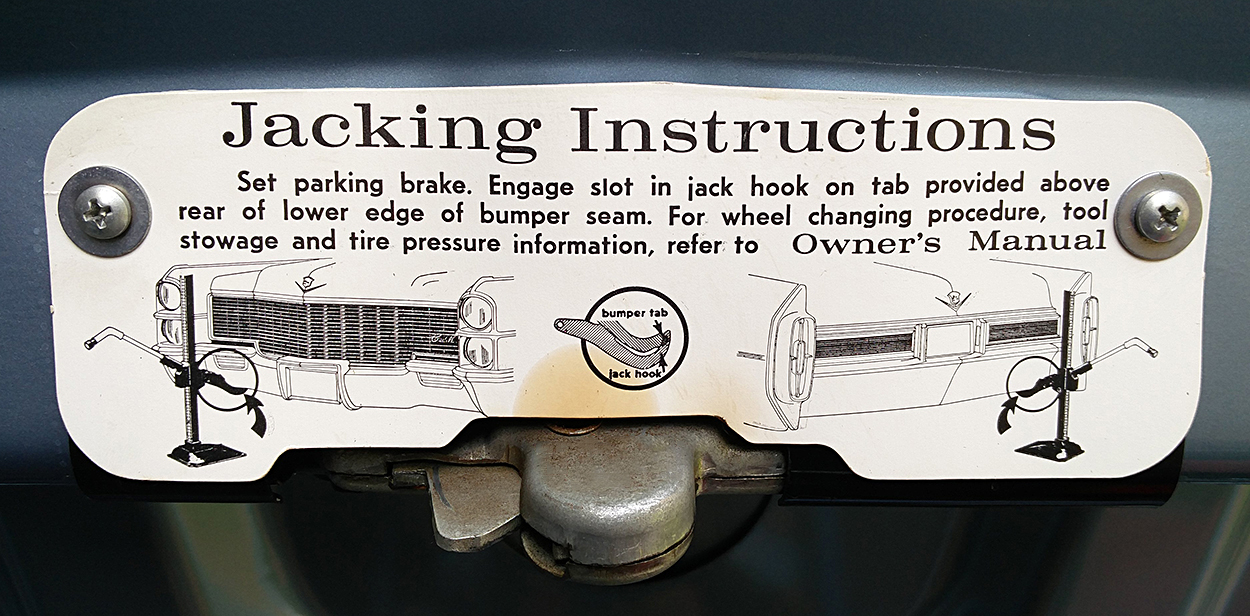
A diagram from the owner’s manual.

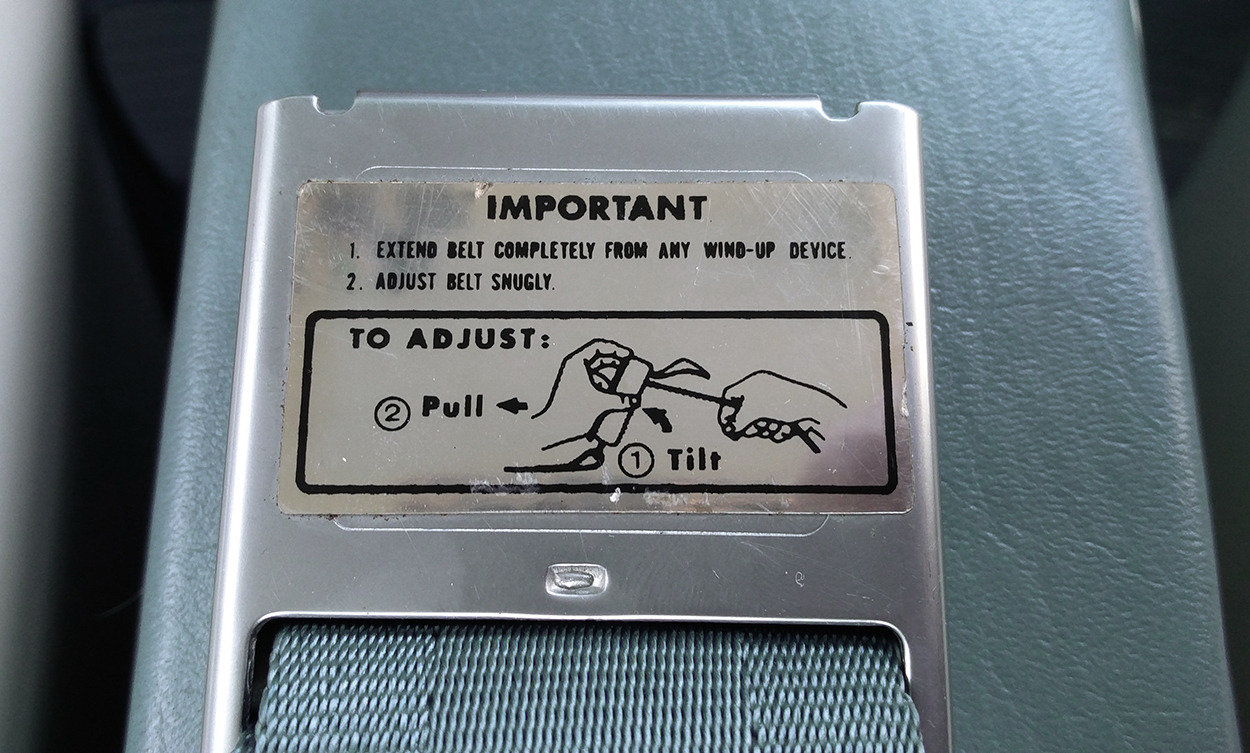
There are other small infographics around the car.

Badge history
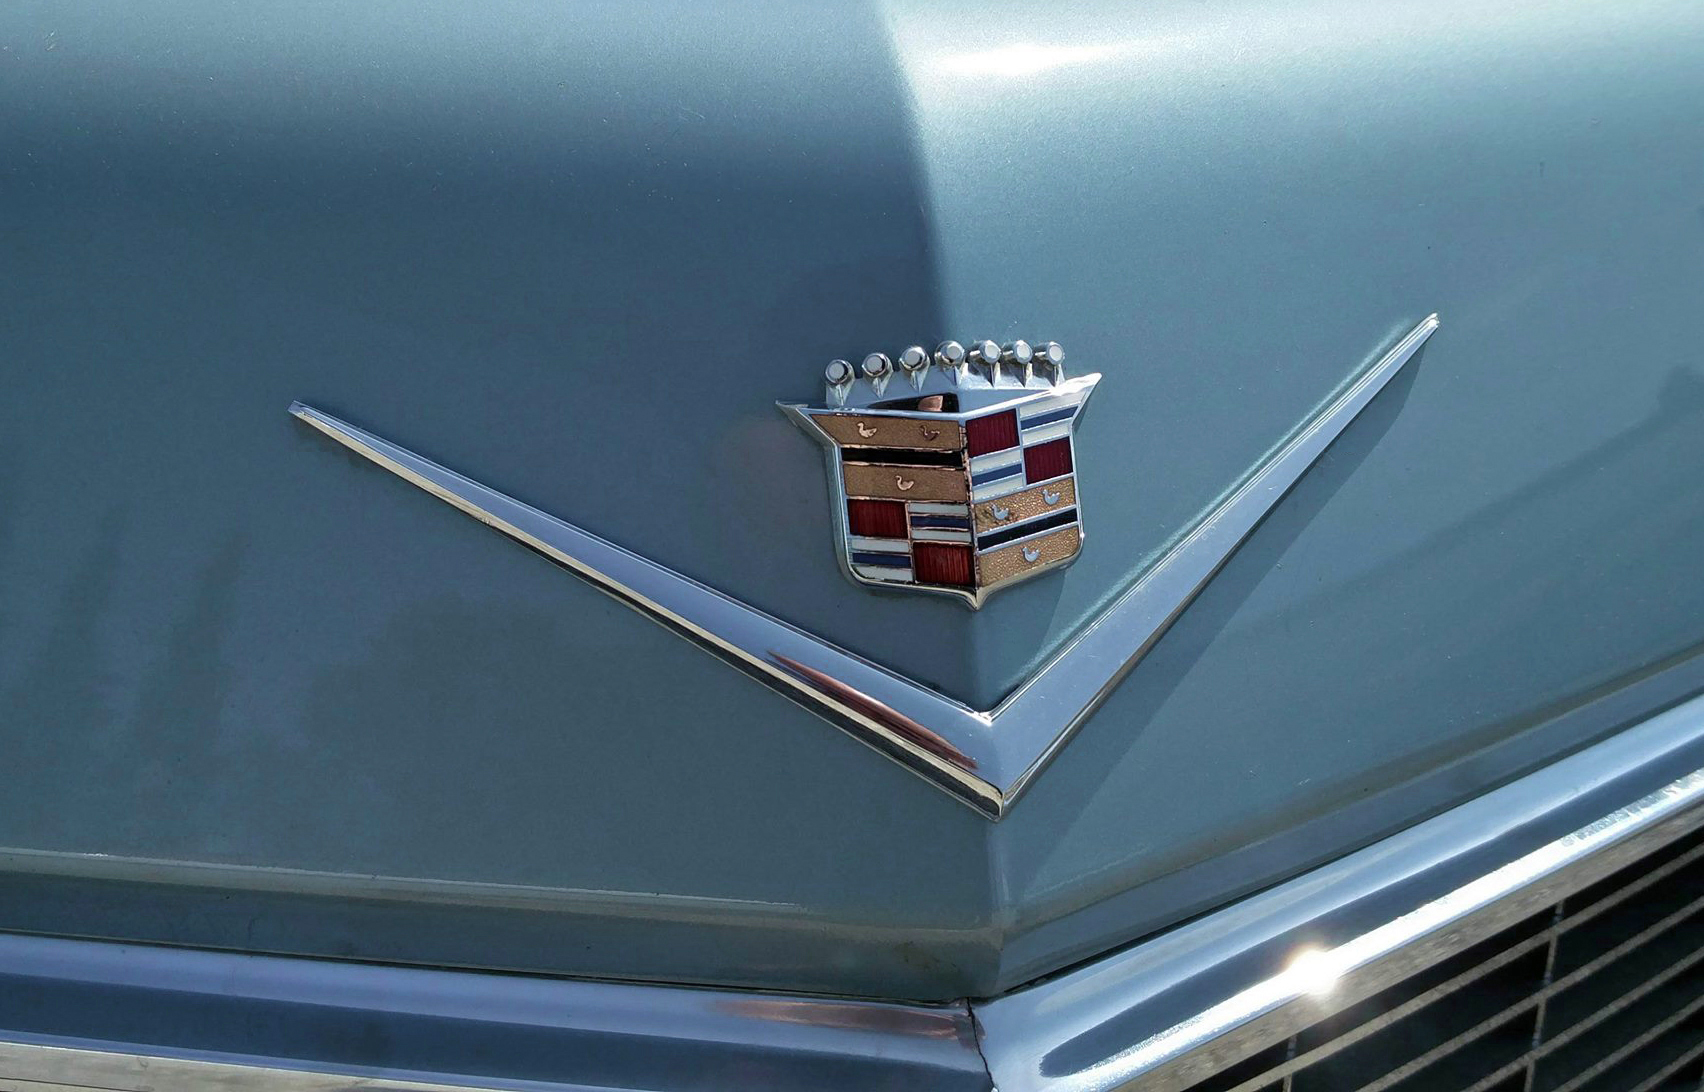
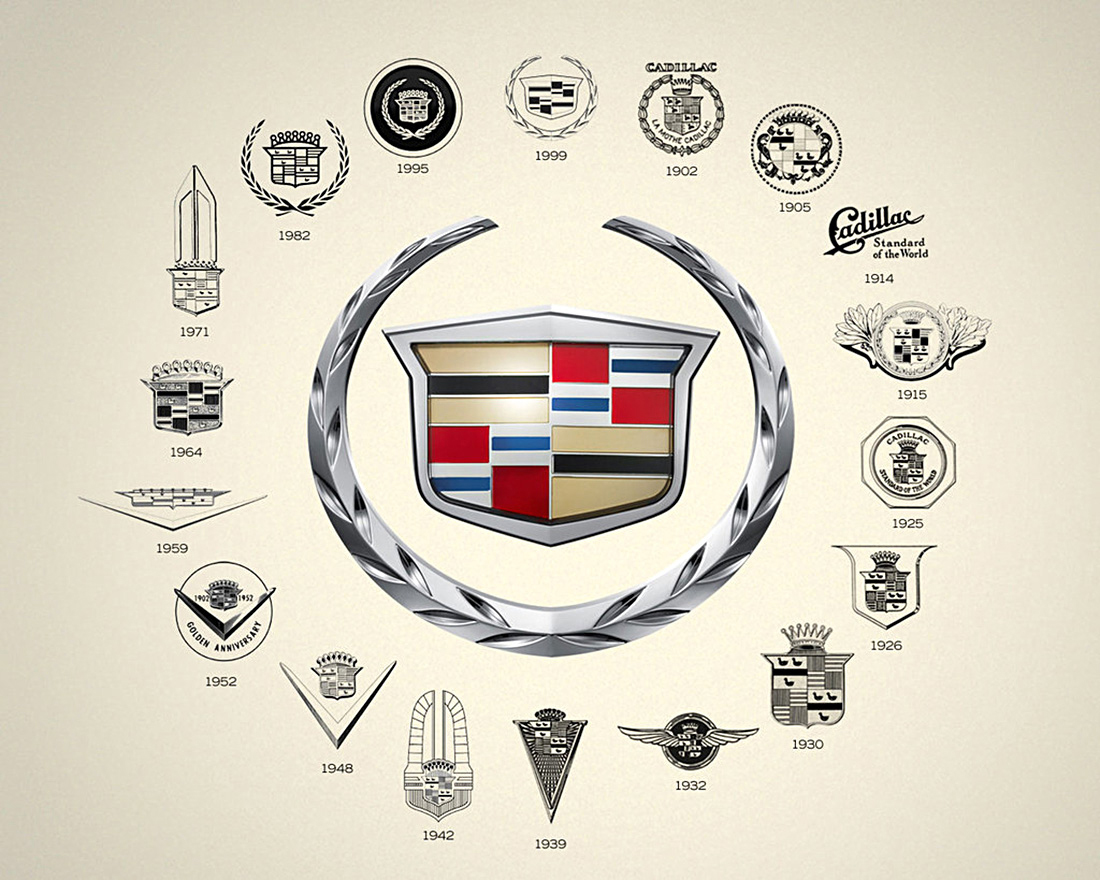
The crests used on Michael’s car mark one step in the long development of the Cadillac insignia. Below, on the hood.

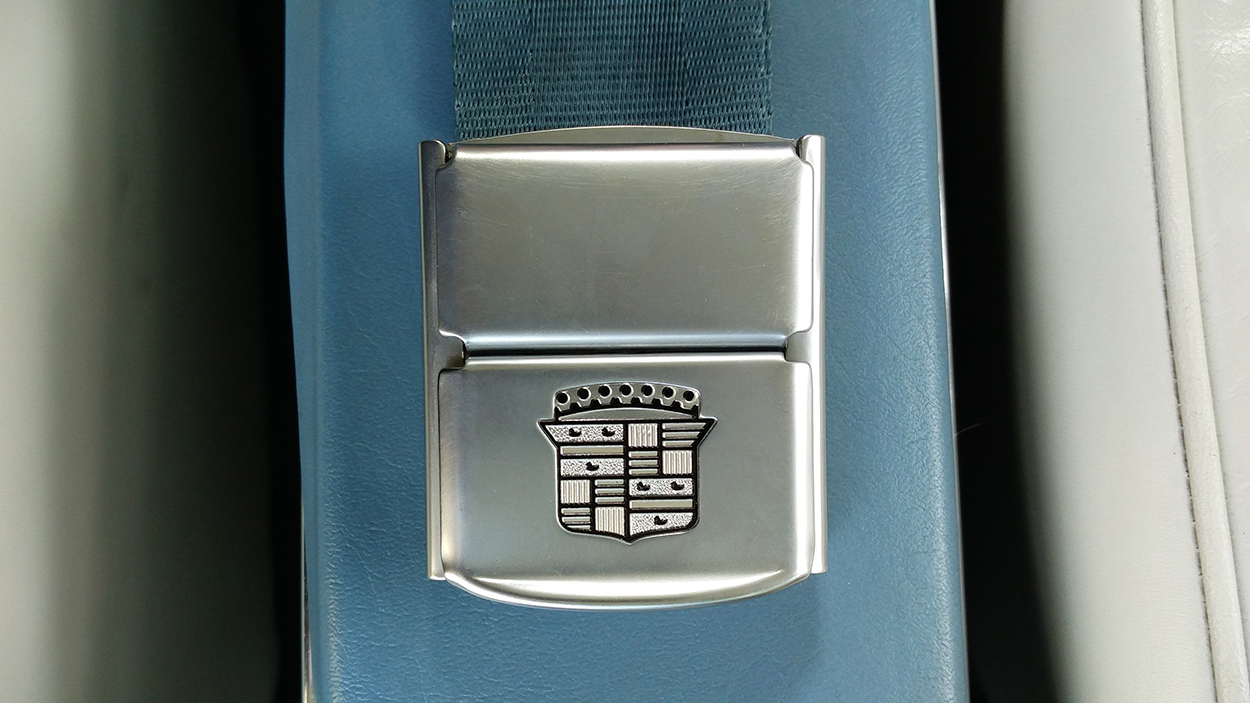
On the seat belt buckle.

The original 1902 badge contained the coat of arms of Antoine de la Mothe Cadillac, the founder of what is now Detroit. The current abstracted version came into use in 1999.


Image courtesy of General Motors Archive.

I recently purchased this nameplate in an antiques store. Now I only need the other 99.99% of the car.

Information design essentials
Michael’s collection of classic historical information design has been featured in this blog on several occasions. Obviously, we can all learn a lot from looking back at our rich information design heritage. Check out these previous posts:

Wall charts: https://wp.me/p7LiLW-1Sj
Eye model: http://wp.me/p7LiLW-1yx
Flap books: http://wp.me/p7LiLW-IV
Flight thru Instruments: http://wp.me/p7LiLW-Rr
Herbert Bayer’s Geo-Graphic Atlas: http://wp.me/p7LiLW-xO
The Atlas to Alexander von Humboldt’s “Kosmos”: http://wp.me/p7LiLW-jO

Above

TWO DIFFERENT WAYS OF LOOKING AT OUR PLANET.

Composite
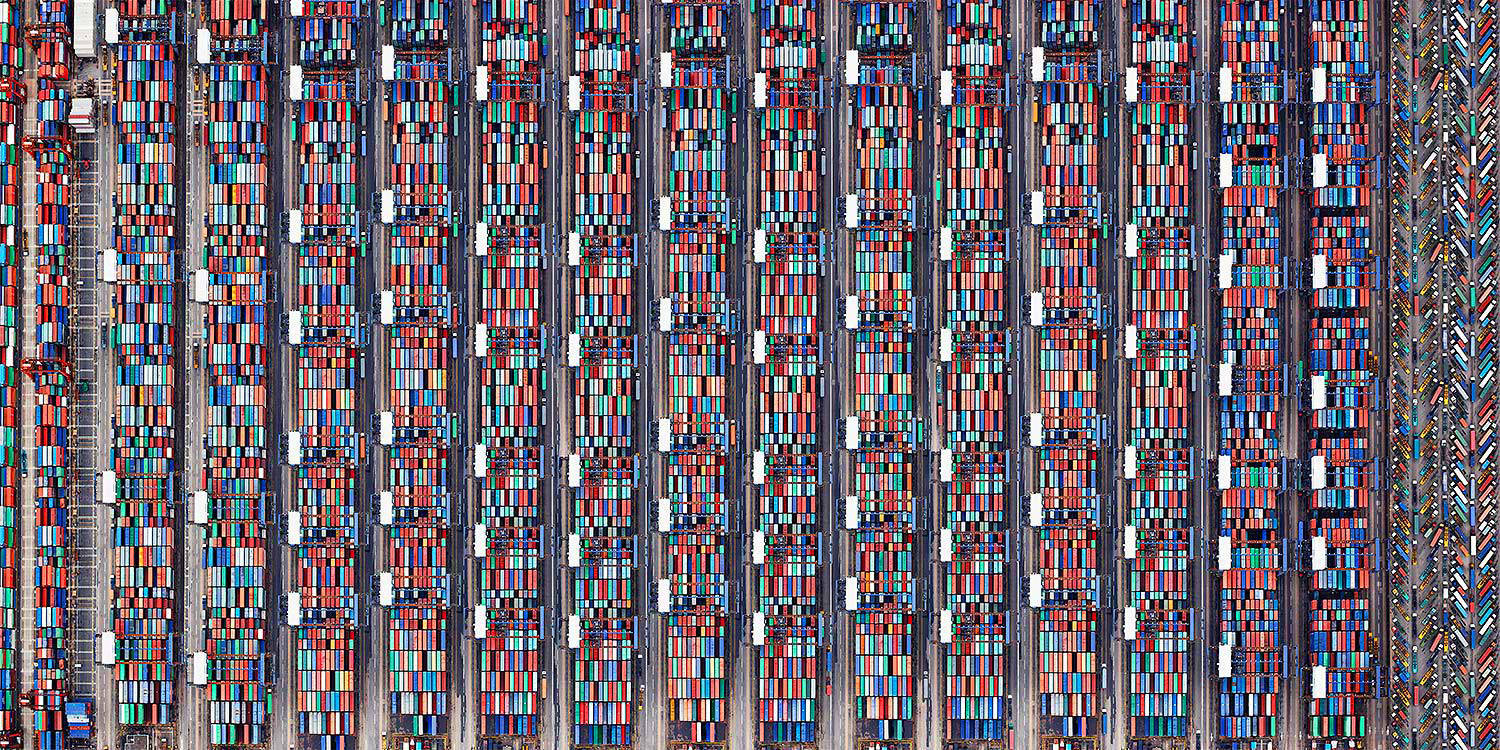
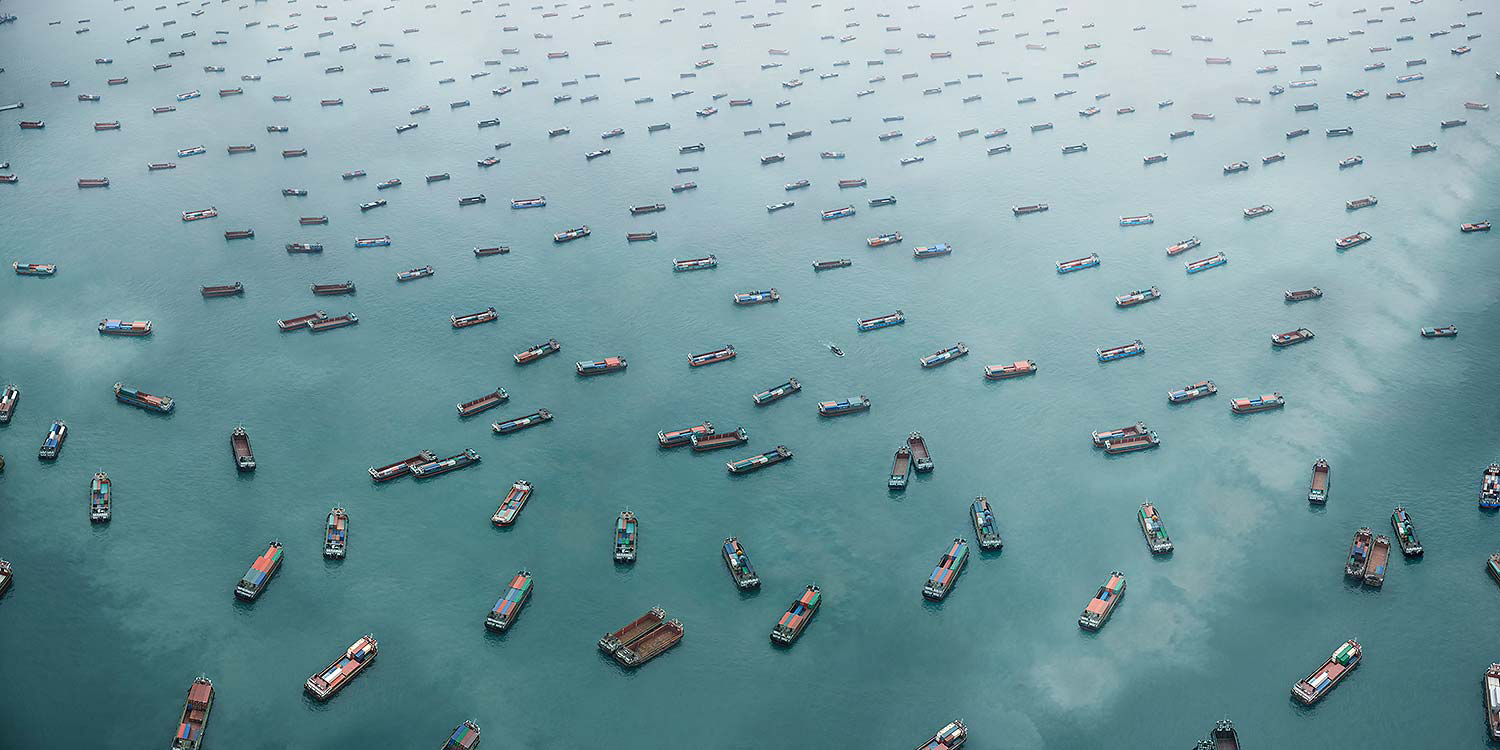
For his project “Exodus,” Marcus Lyon assembles multiple photographs to make large, richly-detailed visions of extreme mass transit. There are around 1,000 photographs of Dubai’s Sheikh Zayed Road in this image. They were taken from the roof of a hotel. The 750 vehicles represent the 750,000 miles that the average motorist drives in a lifetime. Click on the image for a larger version.
See more of “Exodus,” and other projects at http://www.marcuslyon.com

Air traffic over London.

Containers in Hong Kong.

Ships in the South China Sea.

Images © Marcus Lyons.

Oblique reality
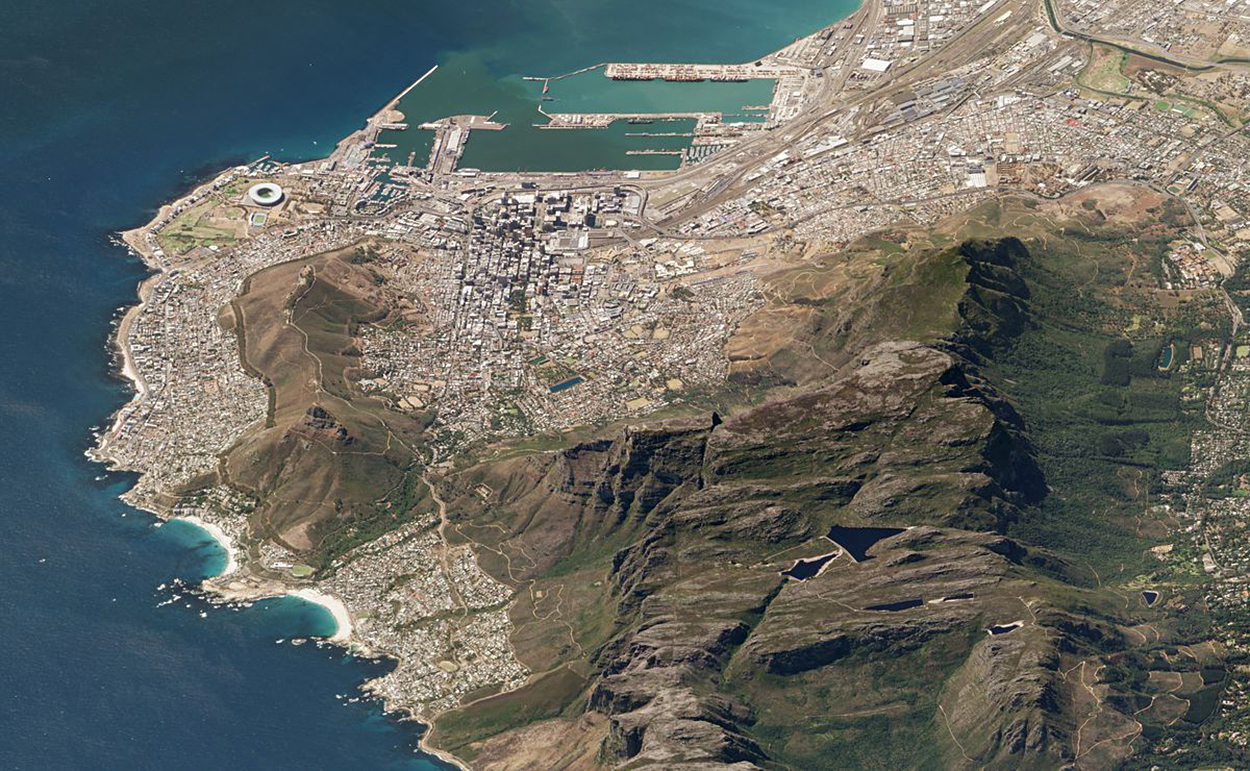
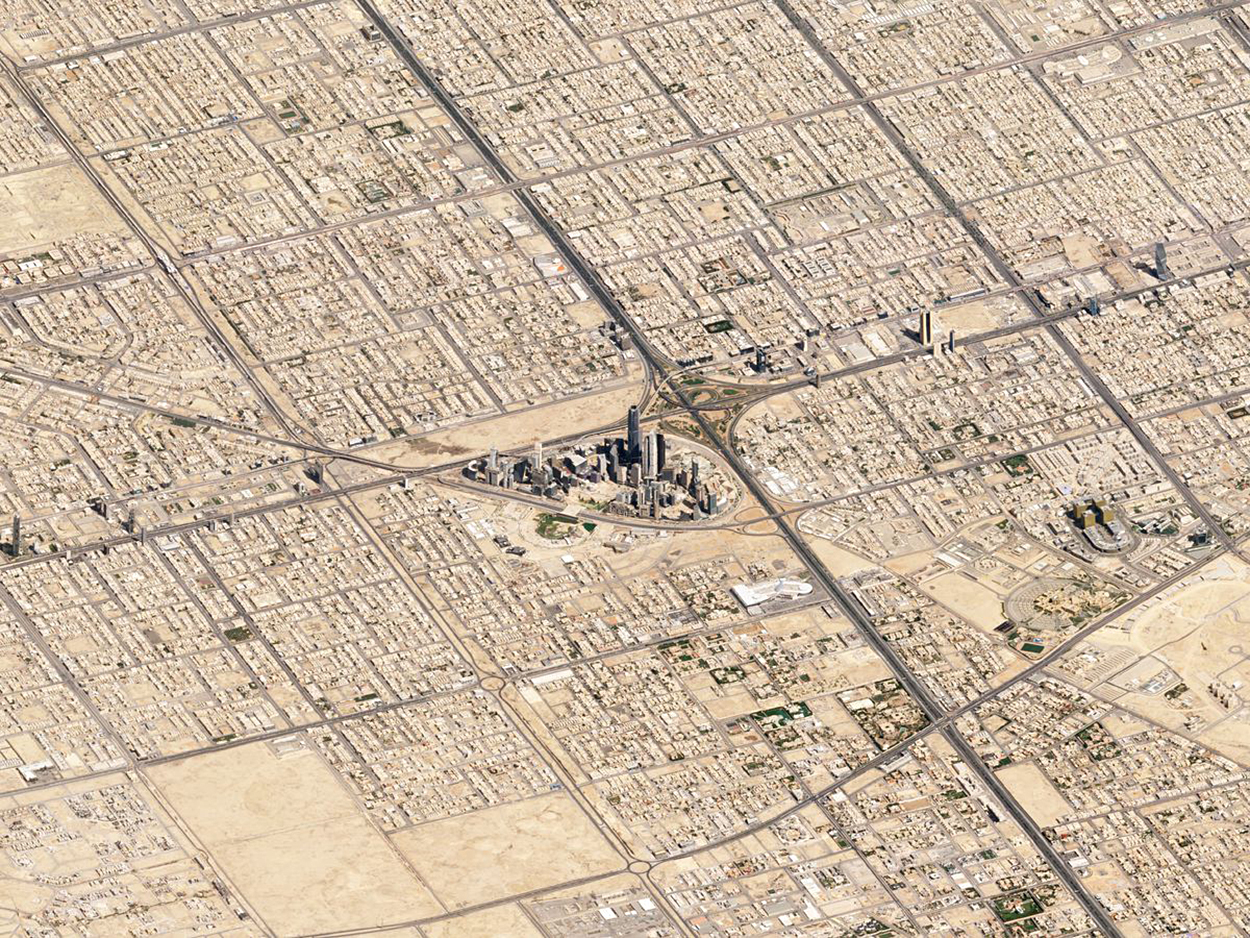
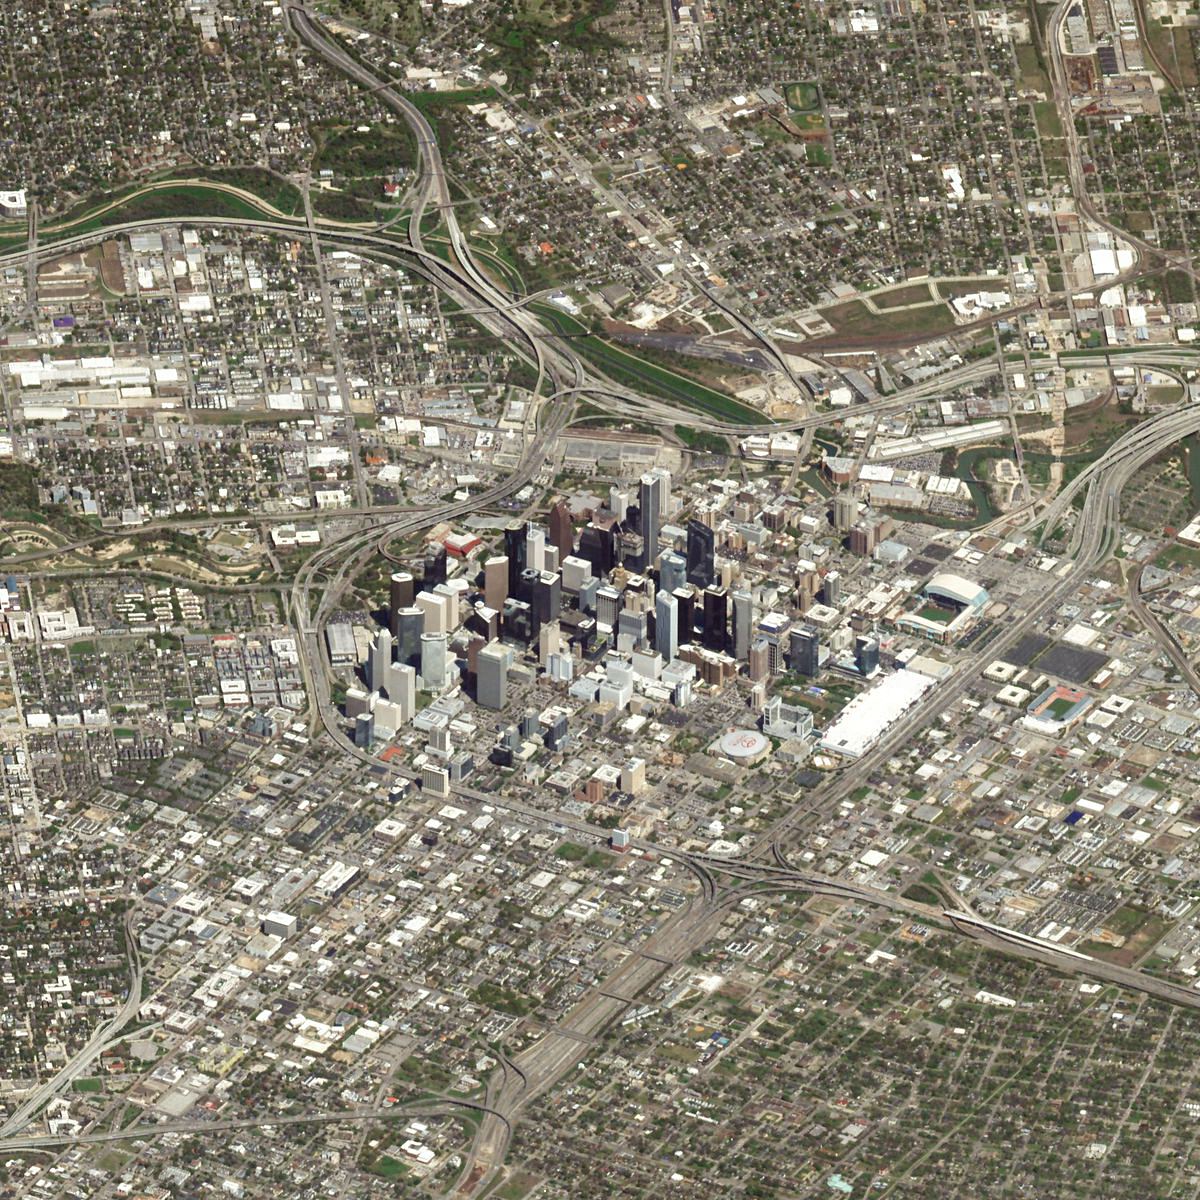
Planet Labs (https://www.planet.com) uses more than 190 Dove, RapidEye and SkySat satellites to capture comprehensive real-time imagery of the Earth. The miniature Doves (which Planet Labs manufactures) make a satellite constellation that once a day makes a complete image of the globe at 3 meter resolution.
Dove dimensions: 3.9 x 3.9 x 11.8 inches (10 x 10 x 30 cm).

They capture not only the kind of satellite views we’re used to seeing, from directly above, but also can give us views from oblique angles.
Below, Cape Town.

Monte Fitz Roy in Patagonia.

Riyadh.

Bora Bora.

Houston.


Images © Planet Labs, Inc.

Previous posts about aerial views

Plan view: https://wp.me/p7LiLW-21v

Aerial visions: https://wp.me/p7LiLW-1UM

Unmanned and overhead: https://wp.me/p7LiLW-Rb

Hands

APPENDAGE ART.


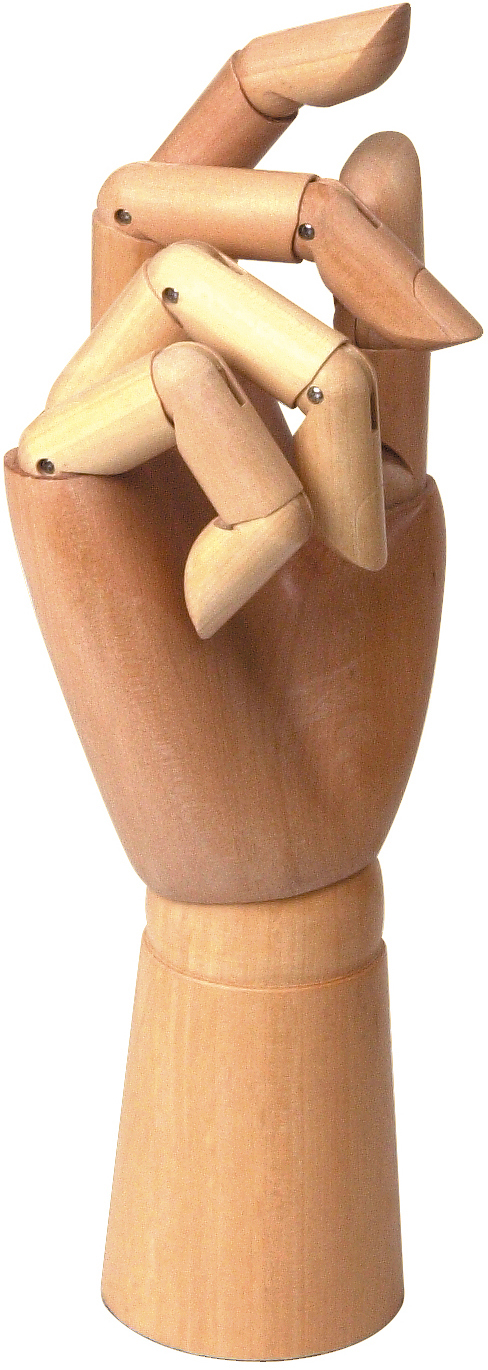
Wooden model
One like this stands on a shelf in my office. Probably a common item in artists’ studios (The ones with canvases and oil paints.)

Pointers
There are endless variants on this theme. And they’re usually the hands of men wearing a shirt and jacket.

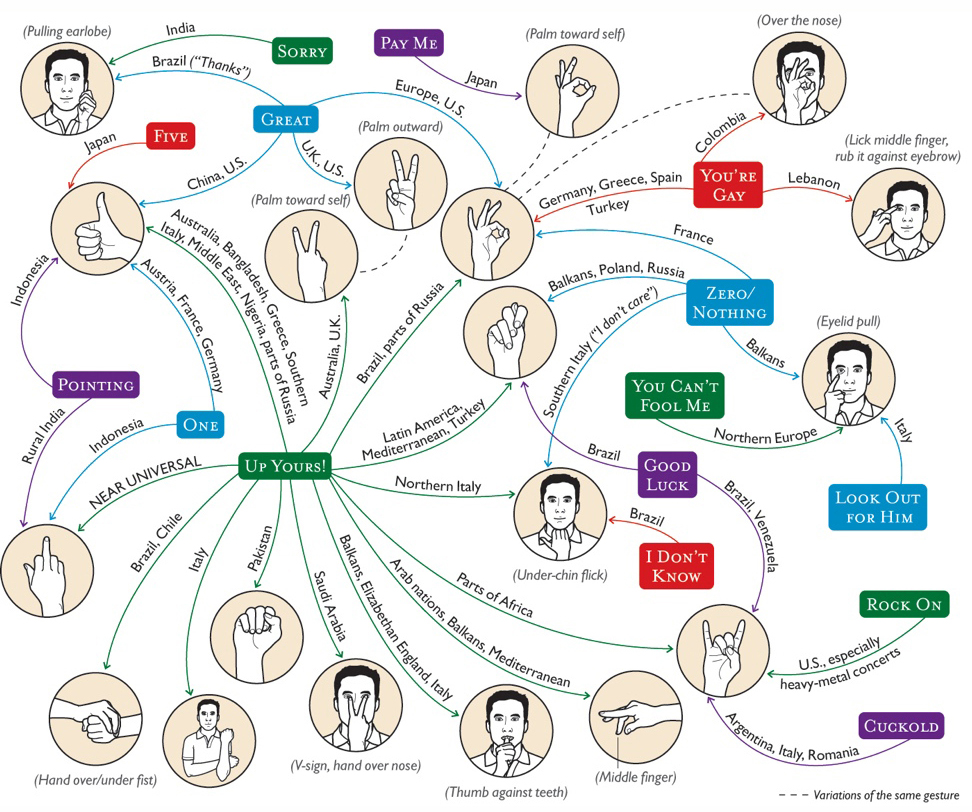
International understanding
To avoid making an embarrassing social mistake, it’s good to know what various hand gestures mean around the world.
Illustration by Brown Bird Design for Condé Nast Traveler. http://brownbirddesign.com

Fortune telling
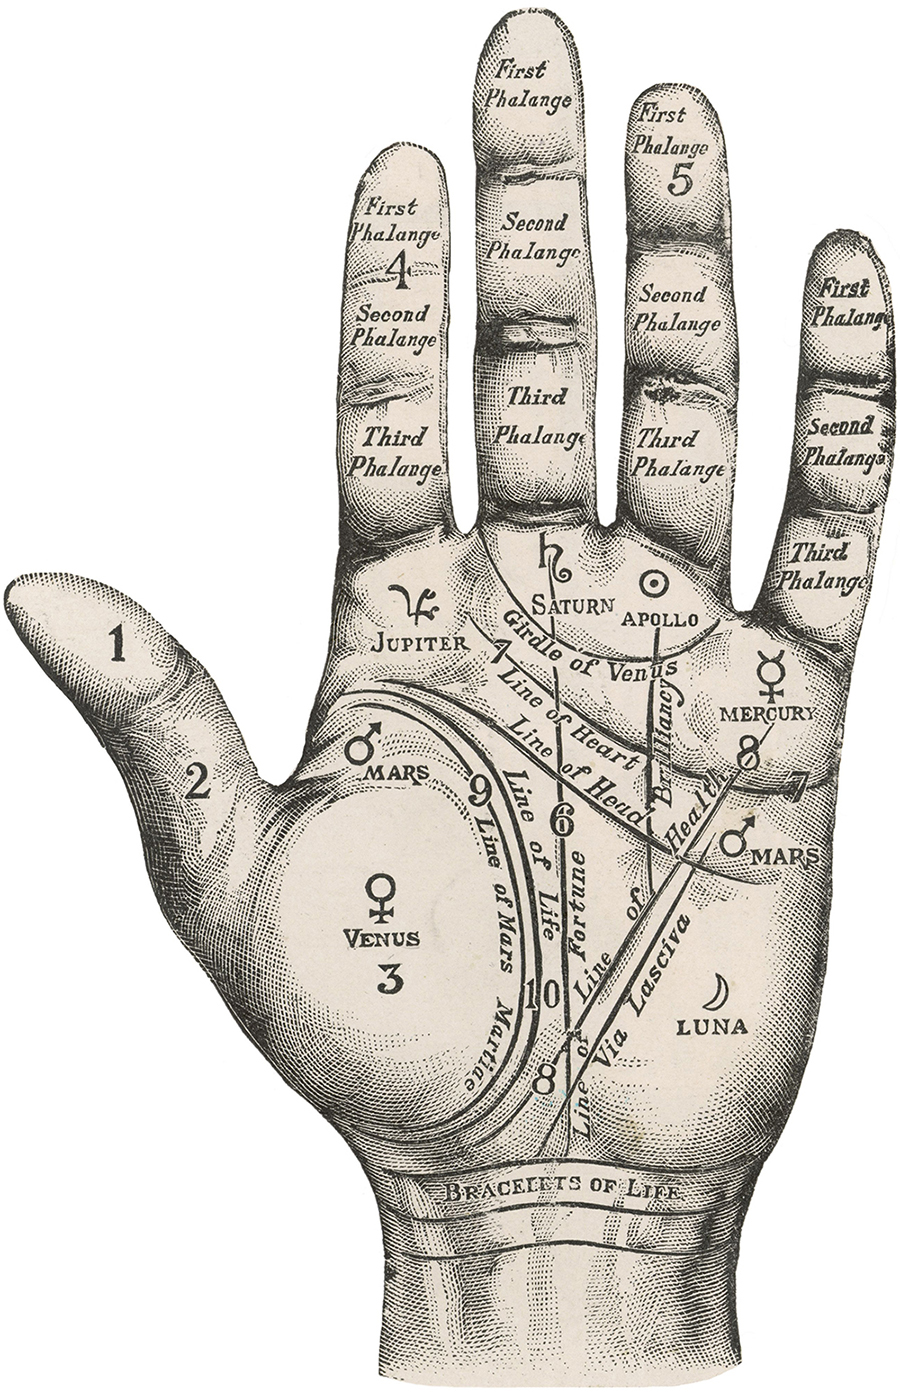
A palmistry (or chiromancy) diagram, used to unlock the secrets of our future.

Sign language
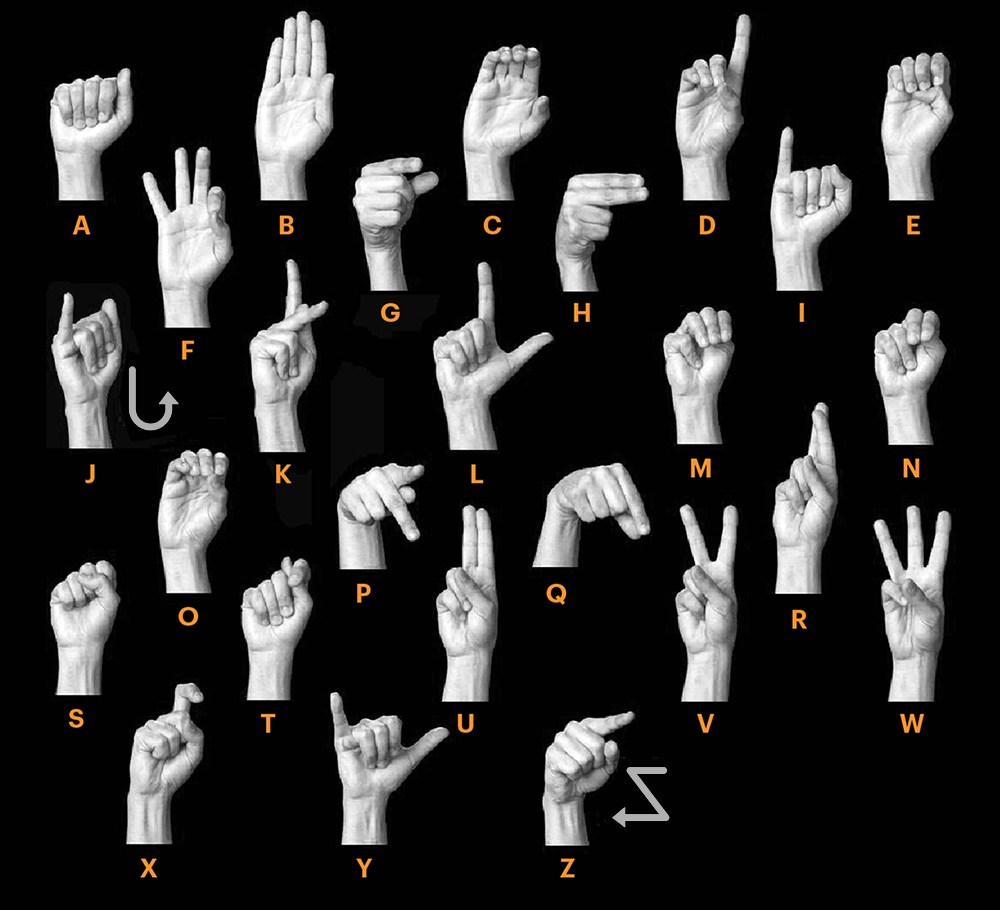
Communication through gestures. This is ASL: American Sign Language. The image appeared before in a post called “Signals”: https://wp.me/s7LiLW-signals

Realistic
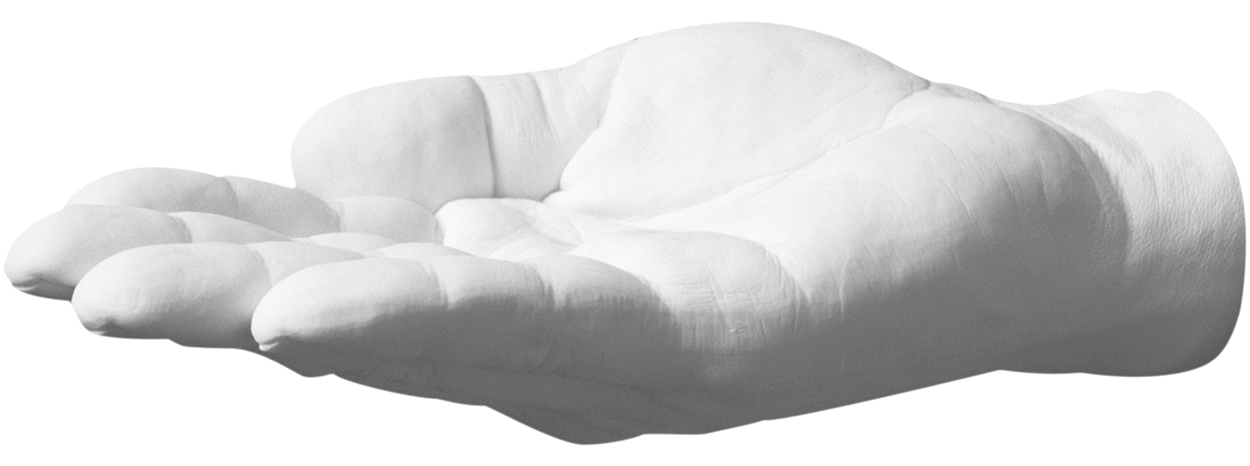
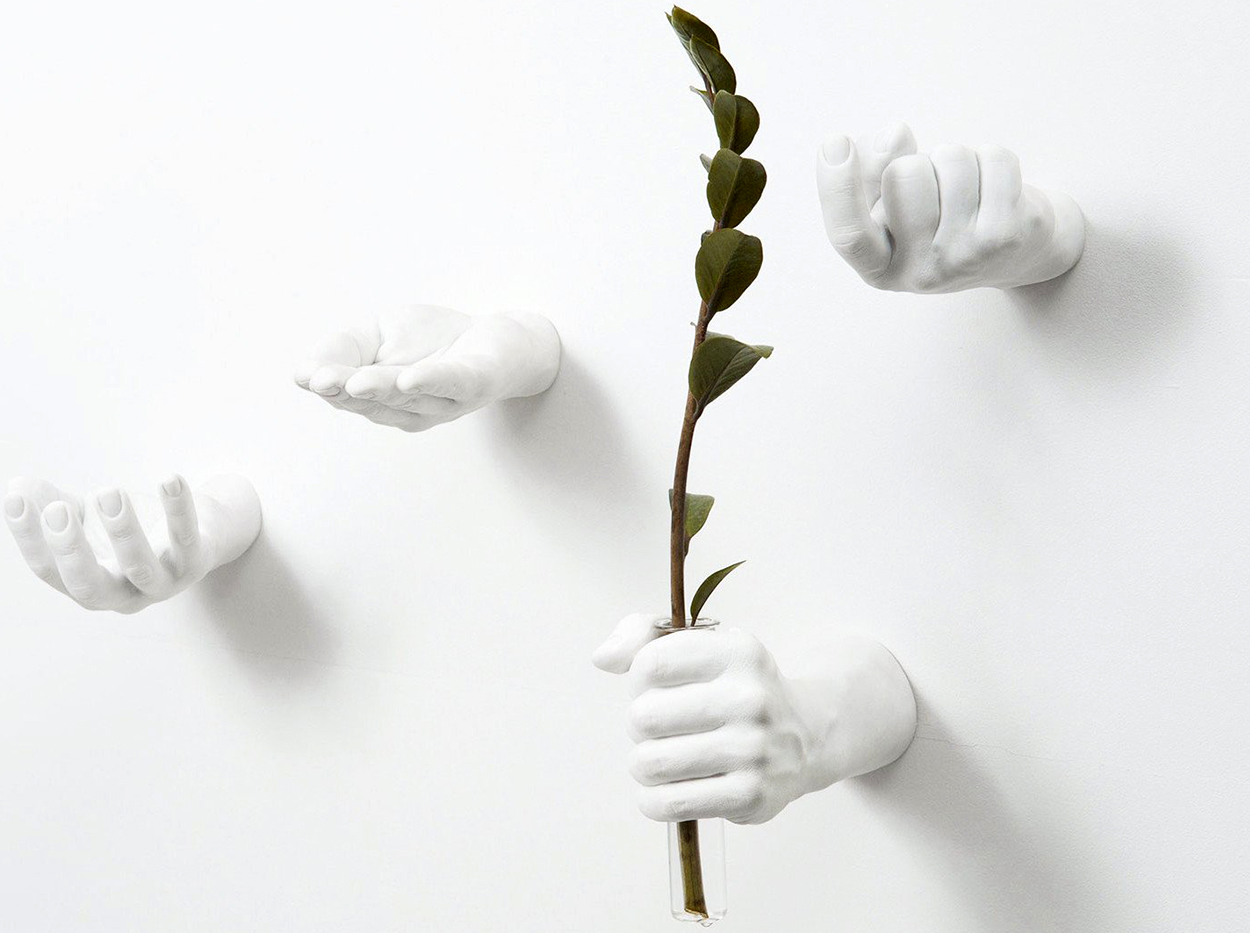
Life-like hands that act as a shelf, vase or hook: https://bit.ly/2LtVq9d


Paper magic

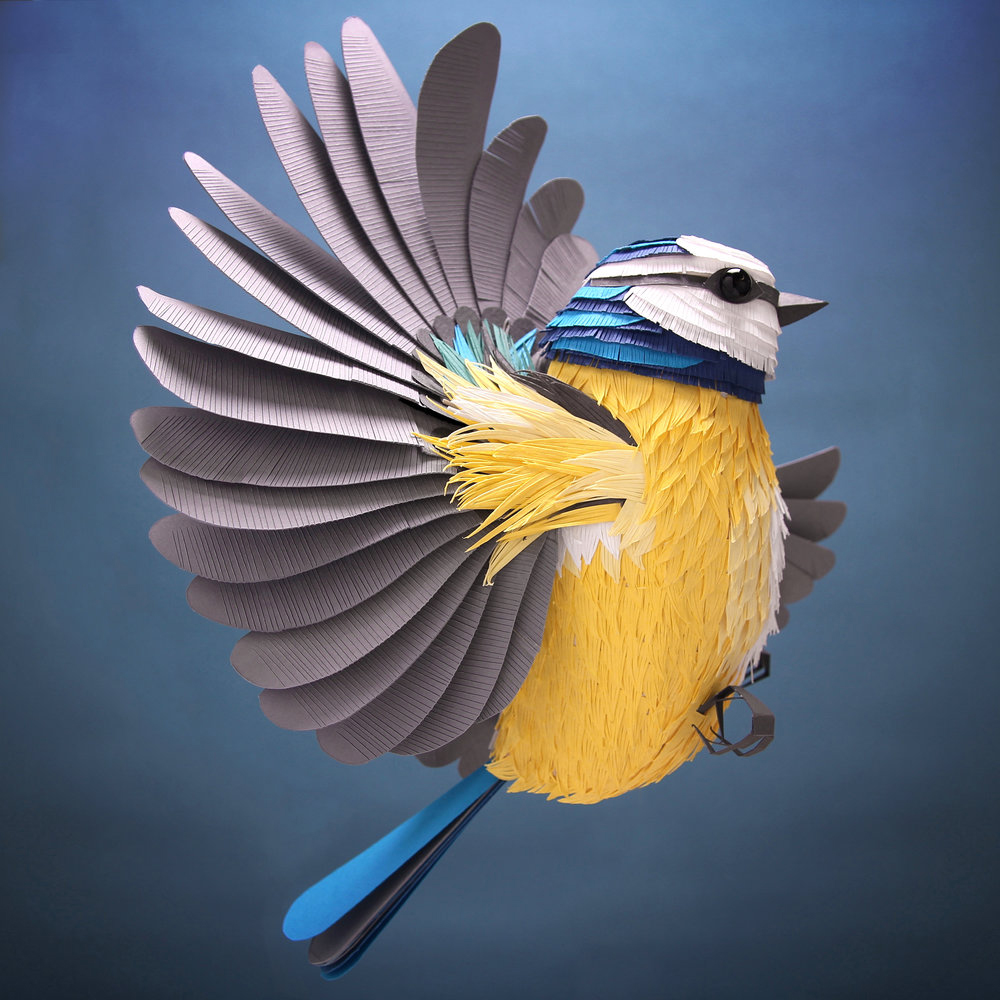
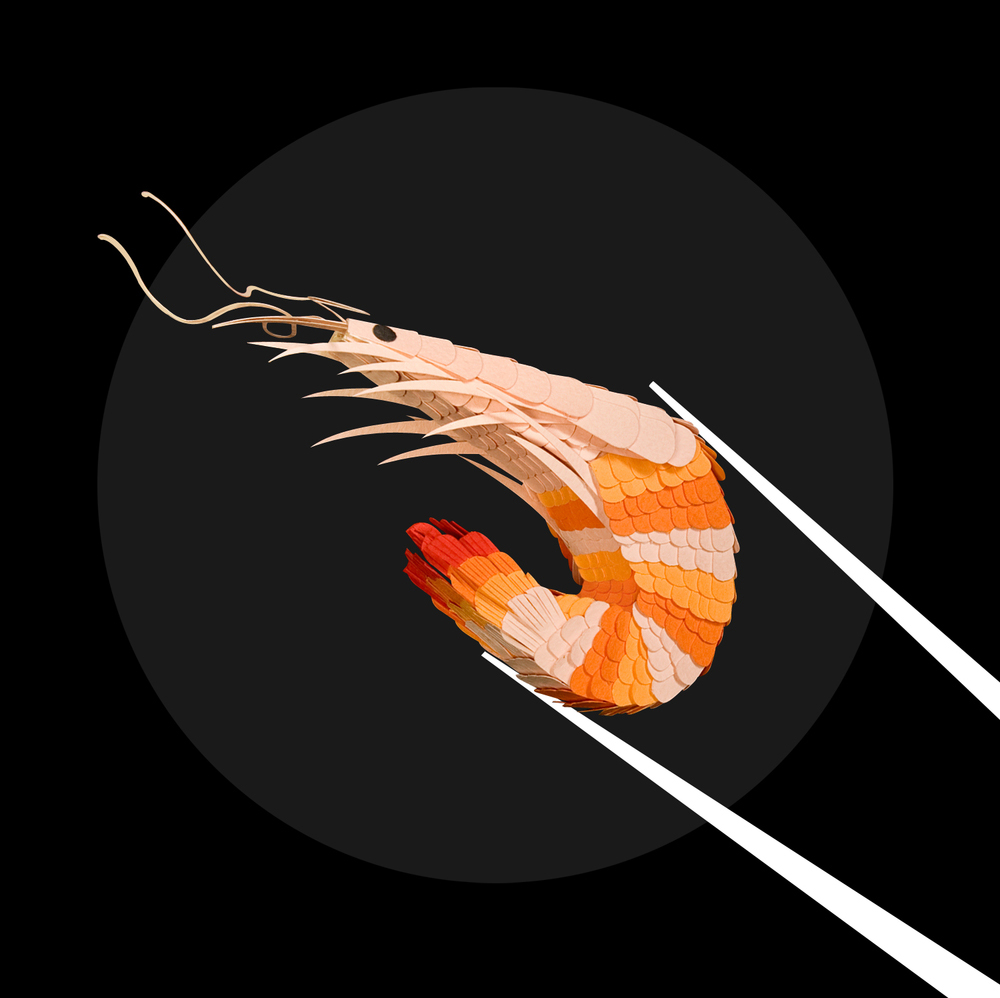
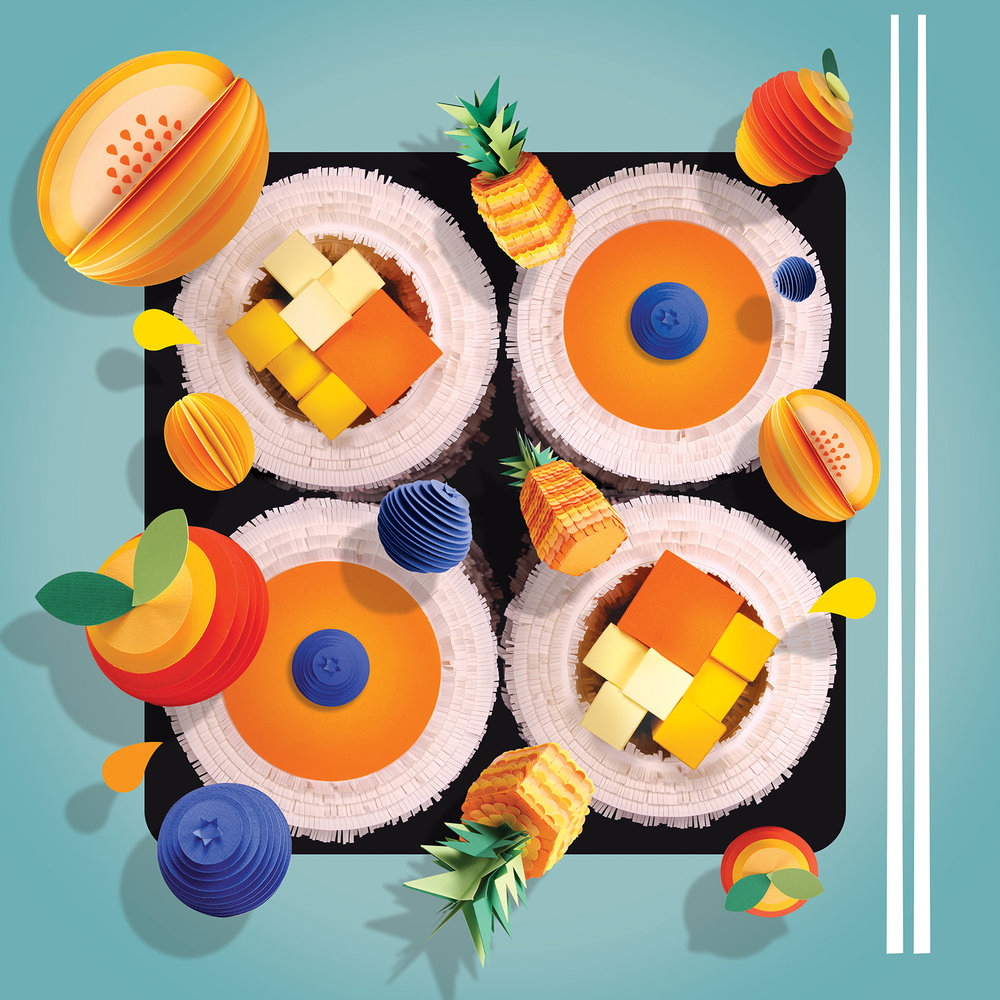
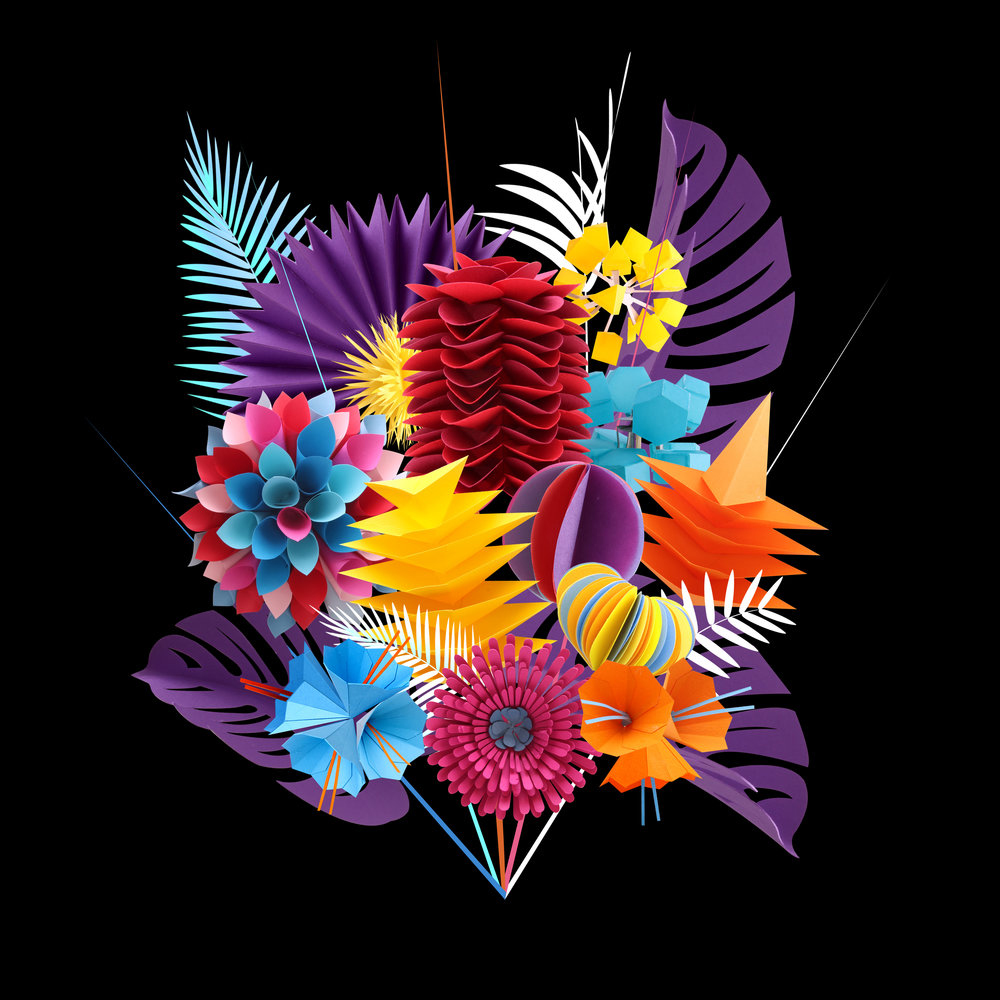
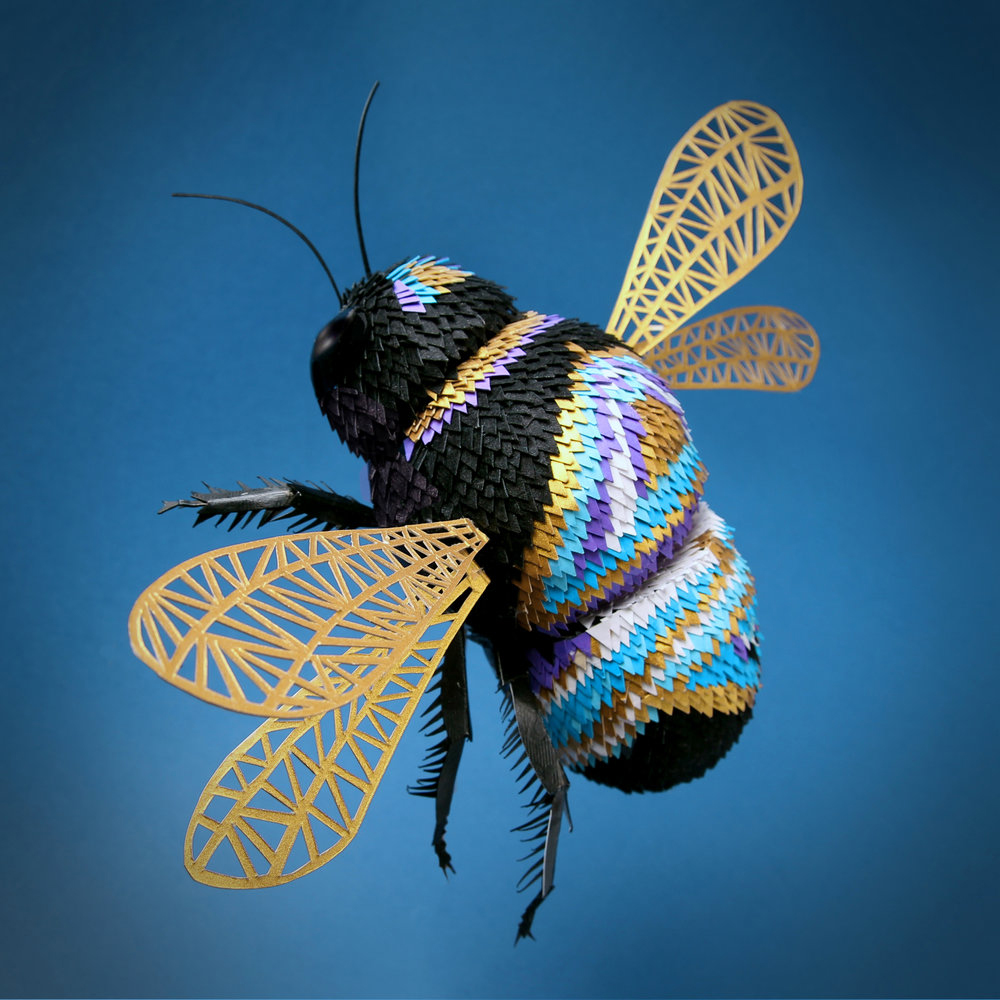
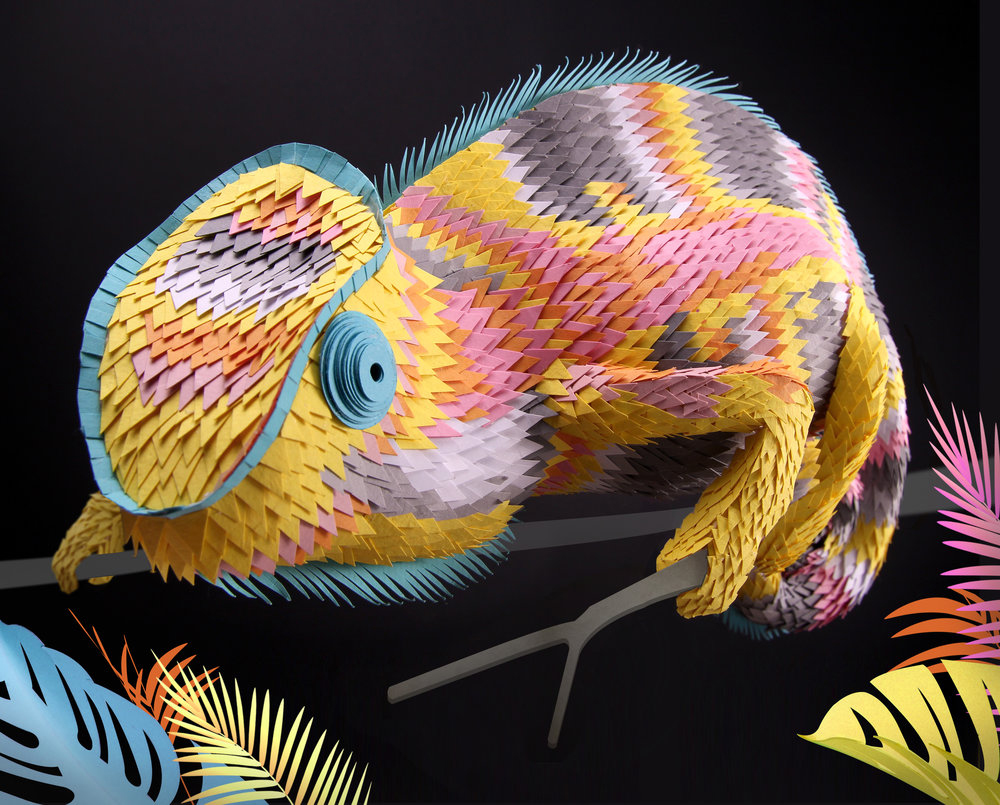
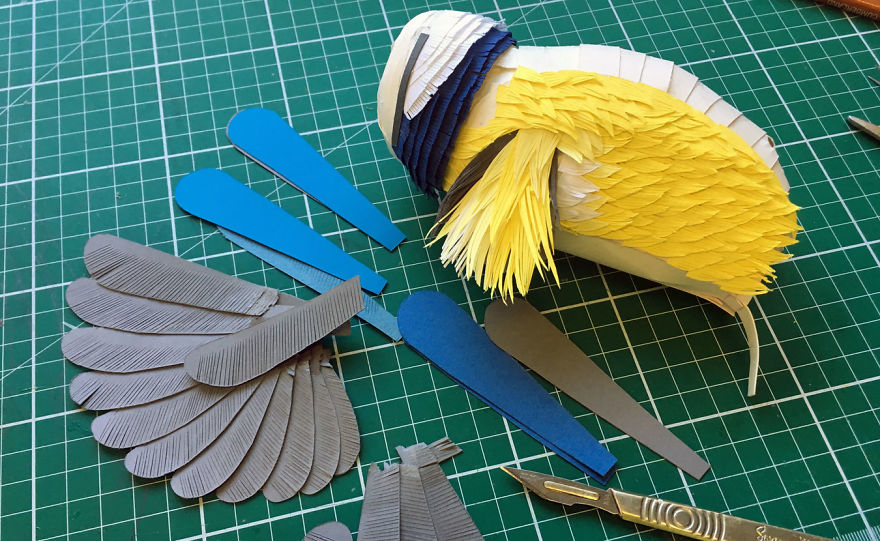
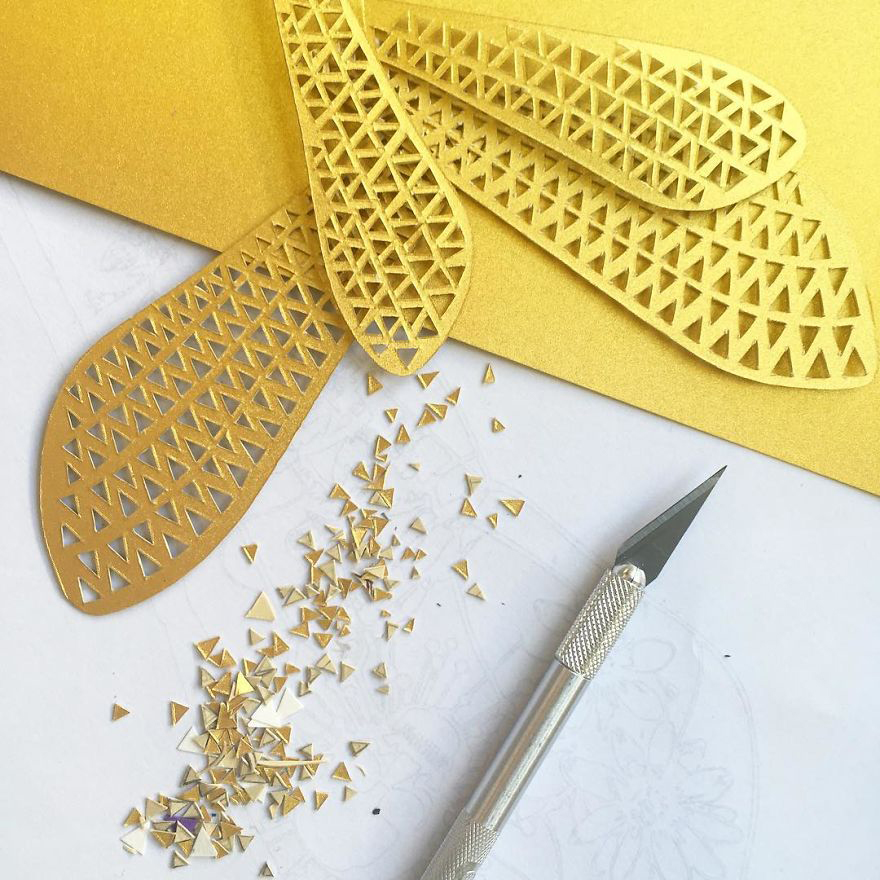
INTRICATE ILLUSTRATIONS BY LISA LLOYD.

Lisa is a UK-based artist making beautifully-crafted paper creations for many clients. She worked in graphic design and animation for several years before specializing in papercraft.

http://www.lisalloyd.net


See Lisa’s process on Instagram: https://www.instagram.com/lisa_lloydpaper/


Some previous posts featuring paper art:

Symbol art: https://wp.me/p7LiLW-1U3

Pop-up: https://wp.me/p7LiLW-1pU

Paper graphics: https://wp.me/p7LiLW-17m

Crazy Competitions (2)

INSIDE NIGEL HOLMES’ INFOGRAPHIC MIND.
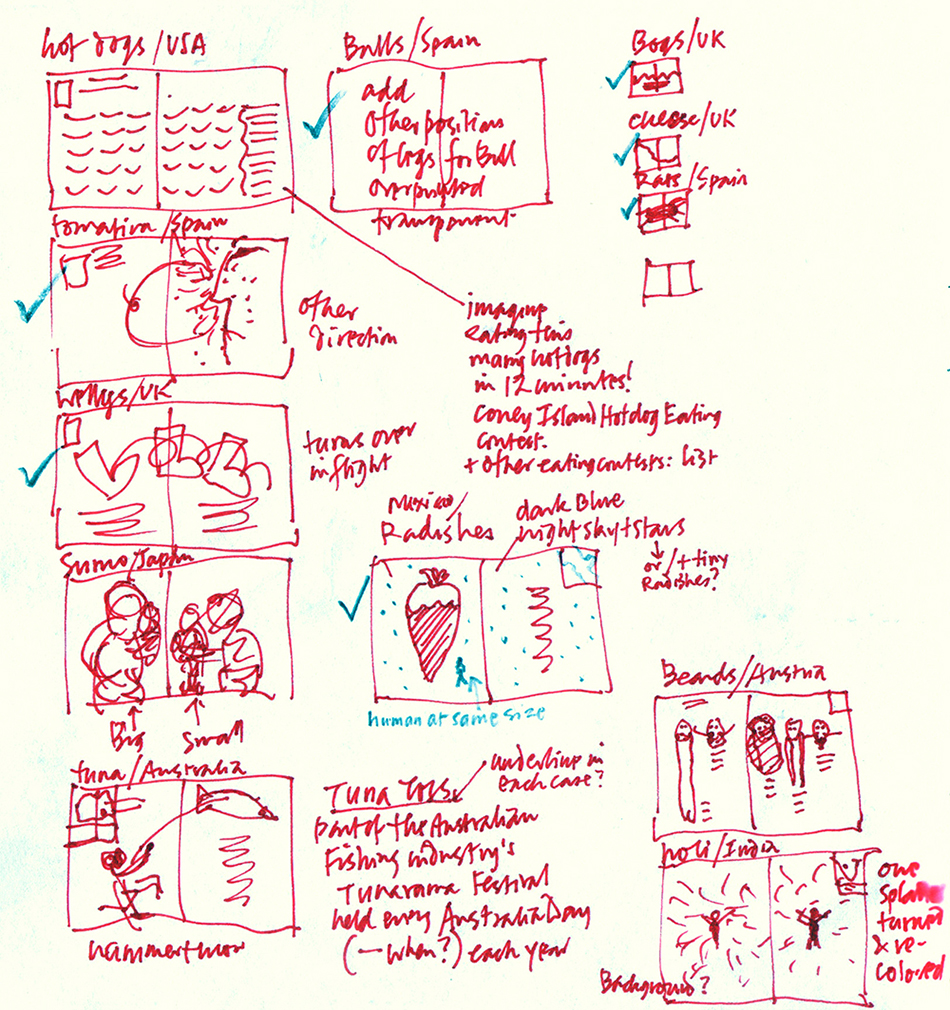
This is the second post about Nigel’s new book. The first one is here: https://wp.me/p7LiLW-2oj

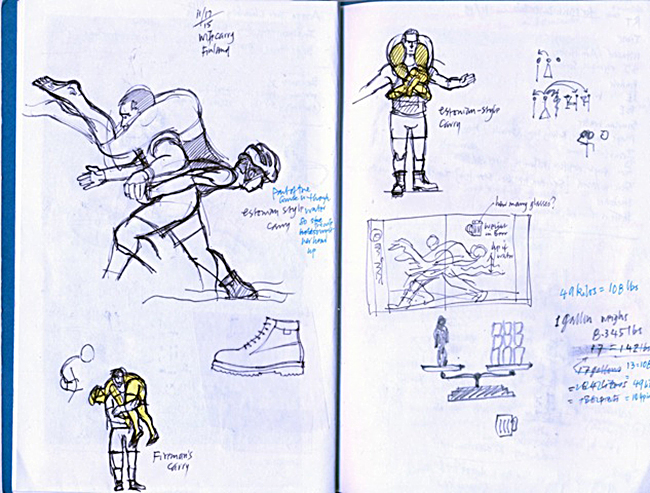
Above, from Nigel’s notebook, these are the very first (and very rough) sketches for the 12 spreads that he eventually developed and sent to Taschen to sell the book idea. He originally intended the format to be small and portrait-shaped, with very simple graphics and minimal text.

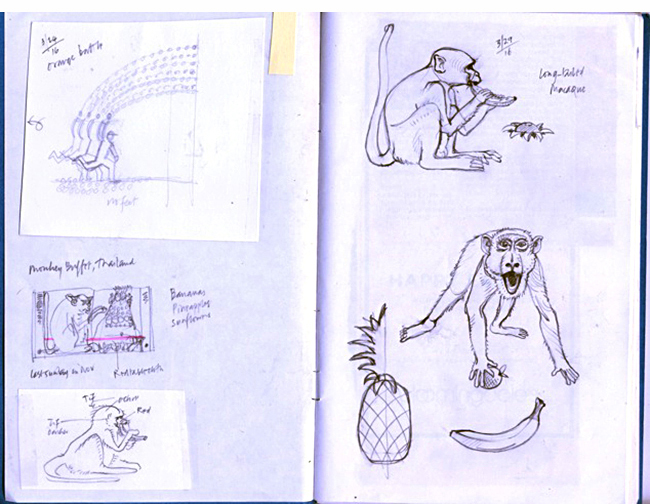
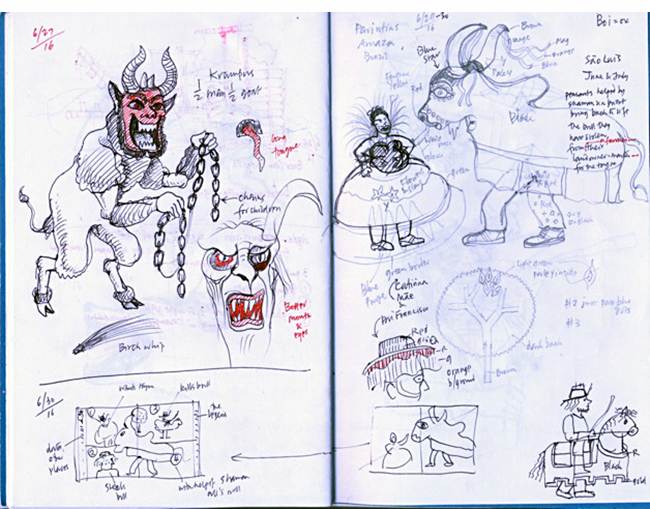
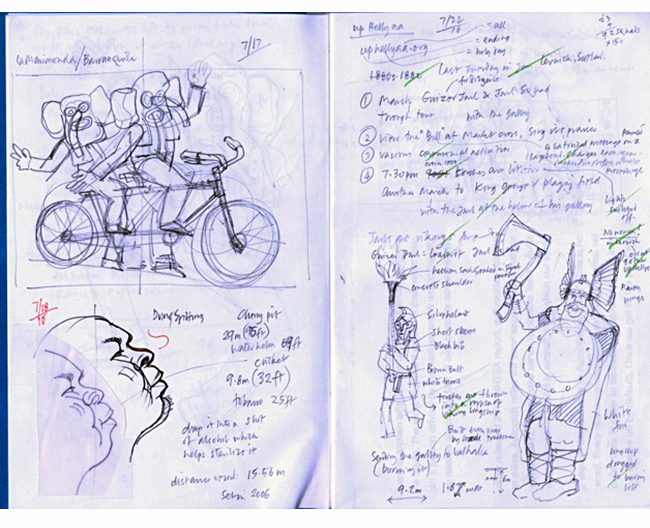
More pages from Nigel’s notebooks:
Q&A

I recently asked Nigel some questions about the book.

This is an unusual subject. In fact, the working title was “Odd.” So first, I have to ask: Why?

I really wanted to do a book that included infographics but wasn’t academic, or “how-to-do-it.” Yes, I wanted to call it “Odd” because I loved the idea of designing a cover with just that one word on it. But the sales people overruled me! Actually, the title changed three times during the making of the book: “Odd,” “They Throw Dead Rats in Spain,” and “Wow!” before “Crazy Competitions.” I argued against the final title, first because the events aren’t all competitions, and also the word crazy might offend the sensibilities of participants taking part in the many religious-festival-based events. But this was the only point of contention in the entire job. Like myself, Taschen really wanted the book to be fun, accurately-researched and approachable.

It’s one thing to have a creative book idea, and another thing to get it published. (Especially by such a prominent publisher.) How did you that happen?

I met Julius Wiedemann, the senior editor at Taschen at a graphics conference some 10 years ago, and we kept in touch. At lunch in June 2015, I casually mentioned the idea of a small graphic book about weird events, and he was interested. He suggested I do ten of them and he’d see if the idea would fly with his boss, Benedikt Taschen. To my surprise, the boss said yes! But he would like it to be a collection of 100! Again to my surprise, it was easy to find that many. Julius has been a wonderful partner in the project. He told me just a couple of months ago that he had miscalculated the amount of time the translations would take. (Taschen typically publishes everything in English, French, and German.) Also the sales team at the head office in Germany were not sure about how they’d sell the book; in fact they were rather against publishing it. Julius got Benedikt to say he wanted the book to be done, and that was that.

Although the approach, in terms of visual explanation, is unquestionably very “Nigel Holmes-like,” you use several different styles of illustration. Was this a deliberate decision to make the spreads more varied visually?

I treated this book more like a series of magazine pages than traditional book pages—after all, most of my career has been in magazines. So yes, it was a very deliberate decision to give readers a variety of things to look at, rather than setting everything in a strictly formatted approach. (The color bars on the edges of each page and the two outside columns were a kind of recurring format, and that was enough.) Also, frankly, I wanted to amuse myself for the year-plus it took to draw and write everything, and in any case, many of the events were difficult to portray as “proper” information graphics. So I used freehand drawing for the real action events; I think a freely drawn line has much more energy and life than my rather stilted vector illustration. (An aside for computer nerds: the vector program I used for the whole book (text and art) was Freehand MX. I saved my files in Illustrator format for the production guys in Germany.)

Can you detail the process of creating the graphics? From idea to finished spread.

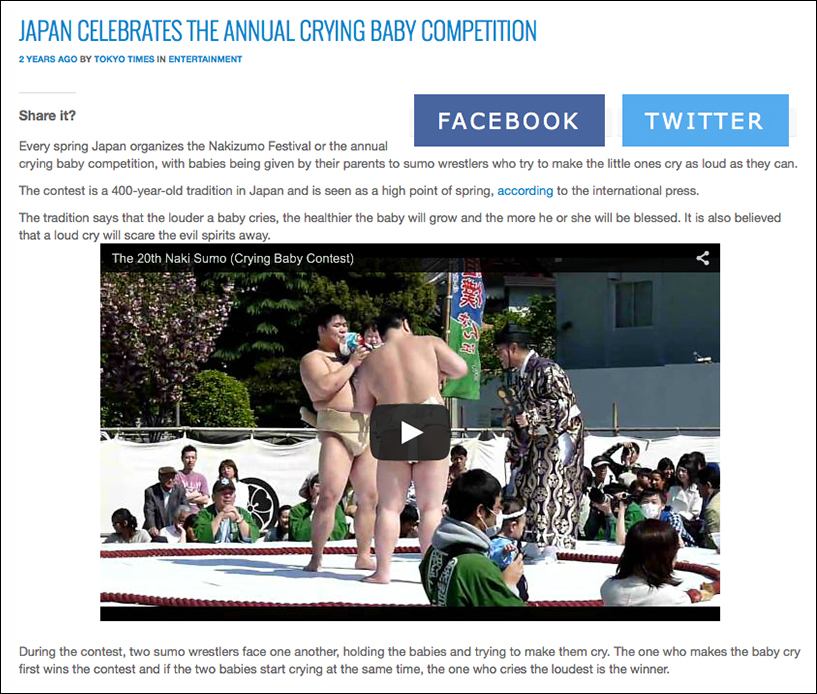
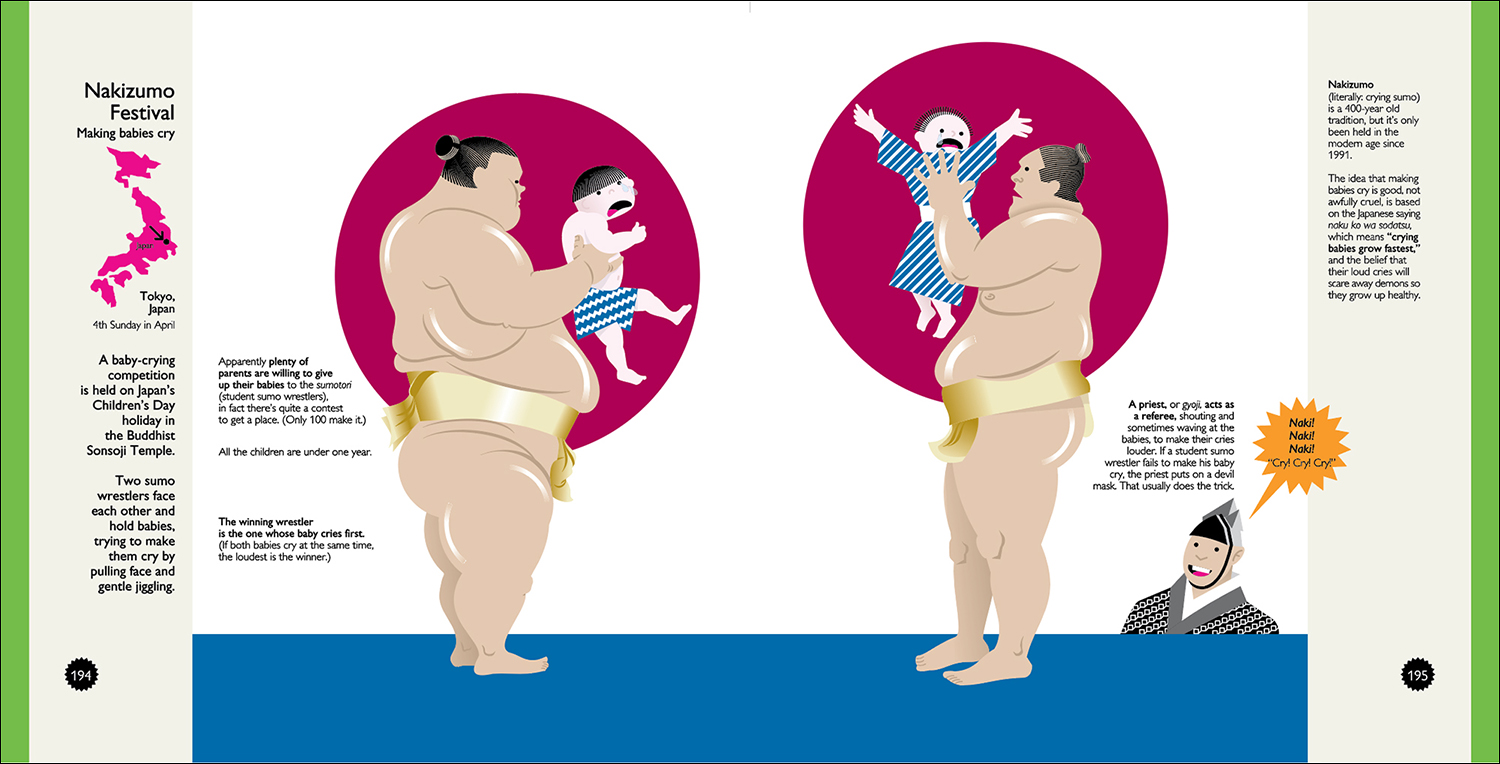
This event is the Nakizumo Festival (Sumo wrestlers making babies cry. No babies are harmed!) I worked with Chris Mizsak, a researcher in England, to find the best reference. Where possible, we used the official websites of the events, but sometimes I had to rely on press reports, both for specific details and pictorial reference. The example below is from the Tokyo Times.
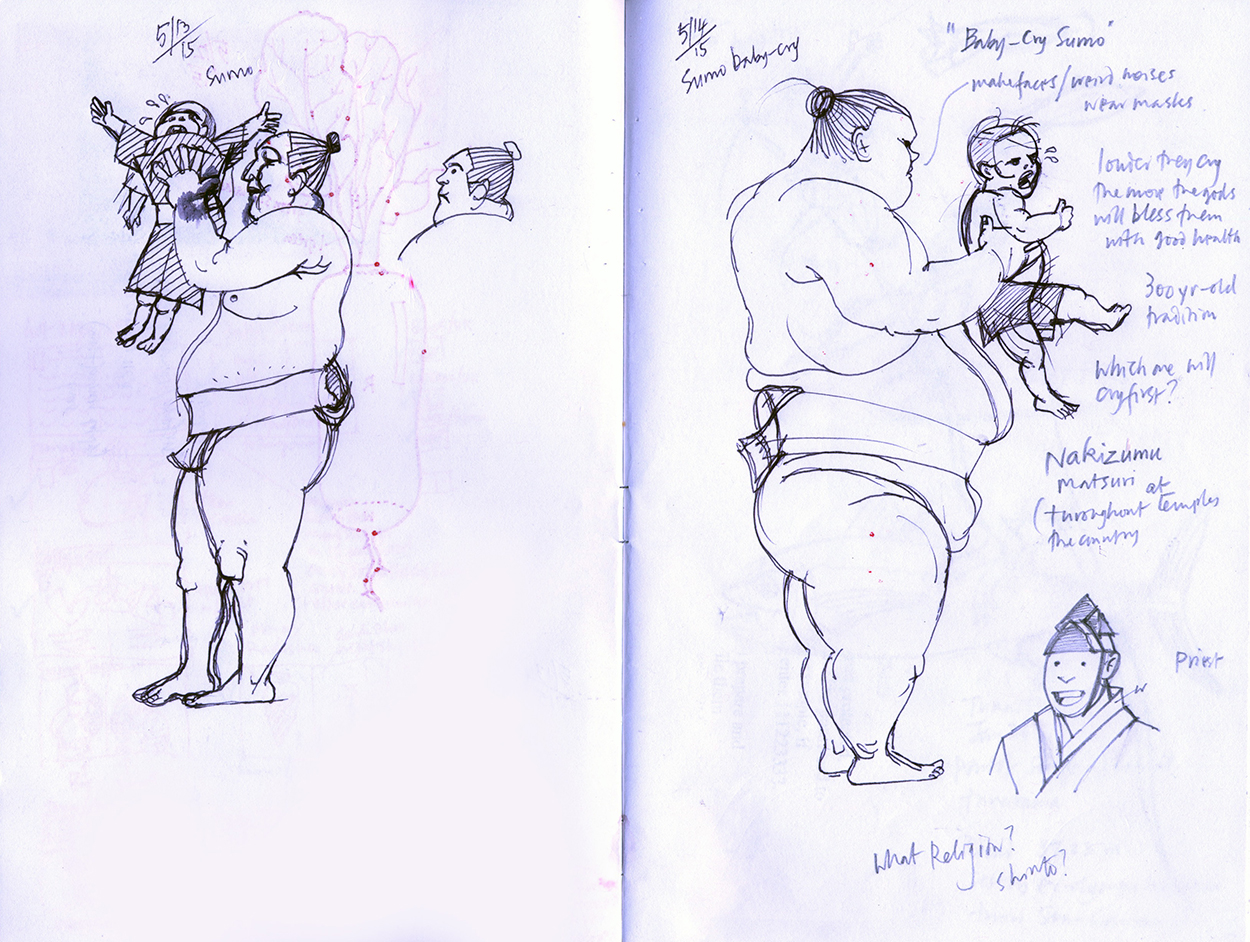
The first step for me in almost any information graphic is drawing by hand, even if it’s hand-plotted numbers for a chart. In this case, the end result was pretty much just a large illustration of two big sumo (student) wrestlers holding the hapless toddlers, so the actual drawings were key. (You can see a radish showing through on the left-hand page. That’s from the Night of the Radishes event!)
The drawings were scanned, flipped right to left, and placed into a spread. It’s still in the original portrait format, and has dummy type.
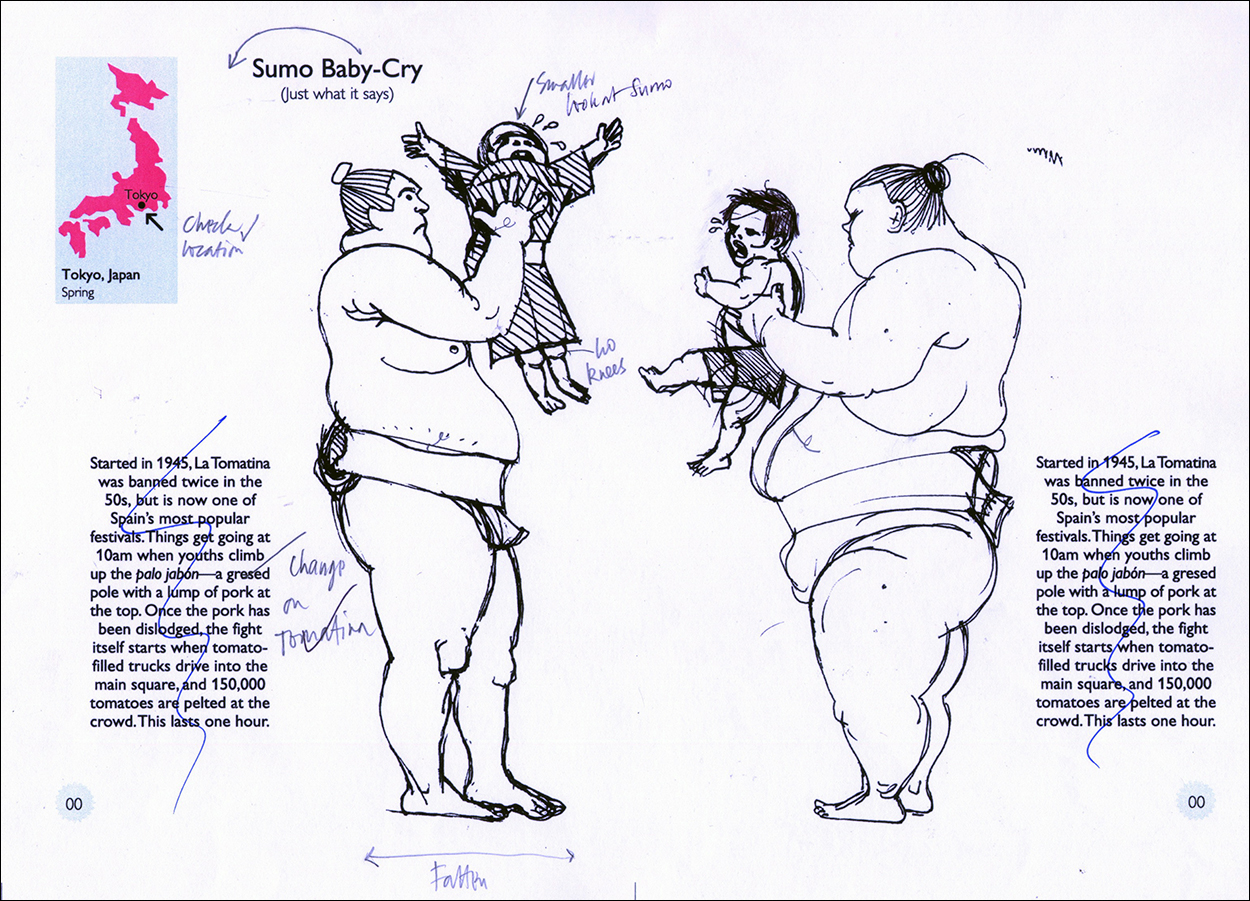
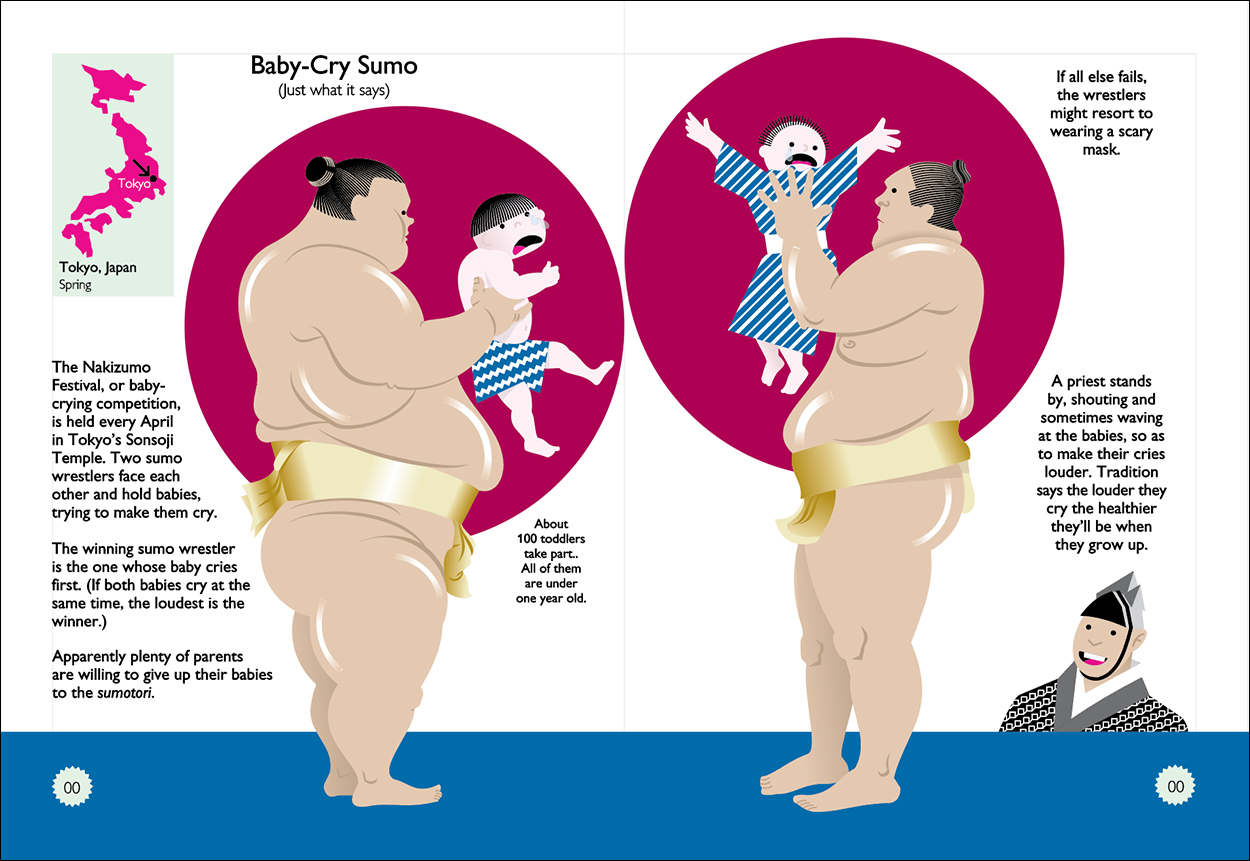
This is how the spread looked, with real type, but still in the old format, when sent to Taschen. Based on this and 11 other spreads, I got the go-ahead to do the whole book, but they wanted it to be square, and bigger. I showed them several of the original spreads in three different larger sizes, and they went with the biggest one (7.5 x 7.5 inches, 19 cm x 19 cm). At this time I decided to include two outer columns; on the left for the locator map and general introduction, and on the right for interesting trivia.
The final as it appears in the book. Since there were over 200 pages, I had to leave a fairly big gap in the center of each spread so stuff didn’t disappear into the gutter. It was easy to open up the sumo event, but some of the images in the book go right across the spread, and in retrospect I should have left more space in some cases. Oh well!
Click on the image for a larger version.
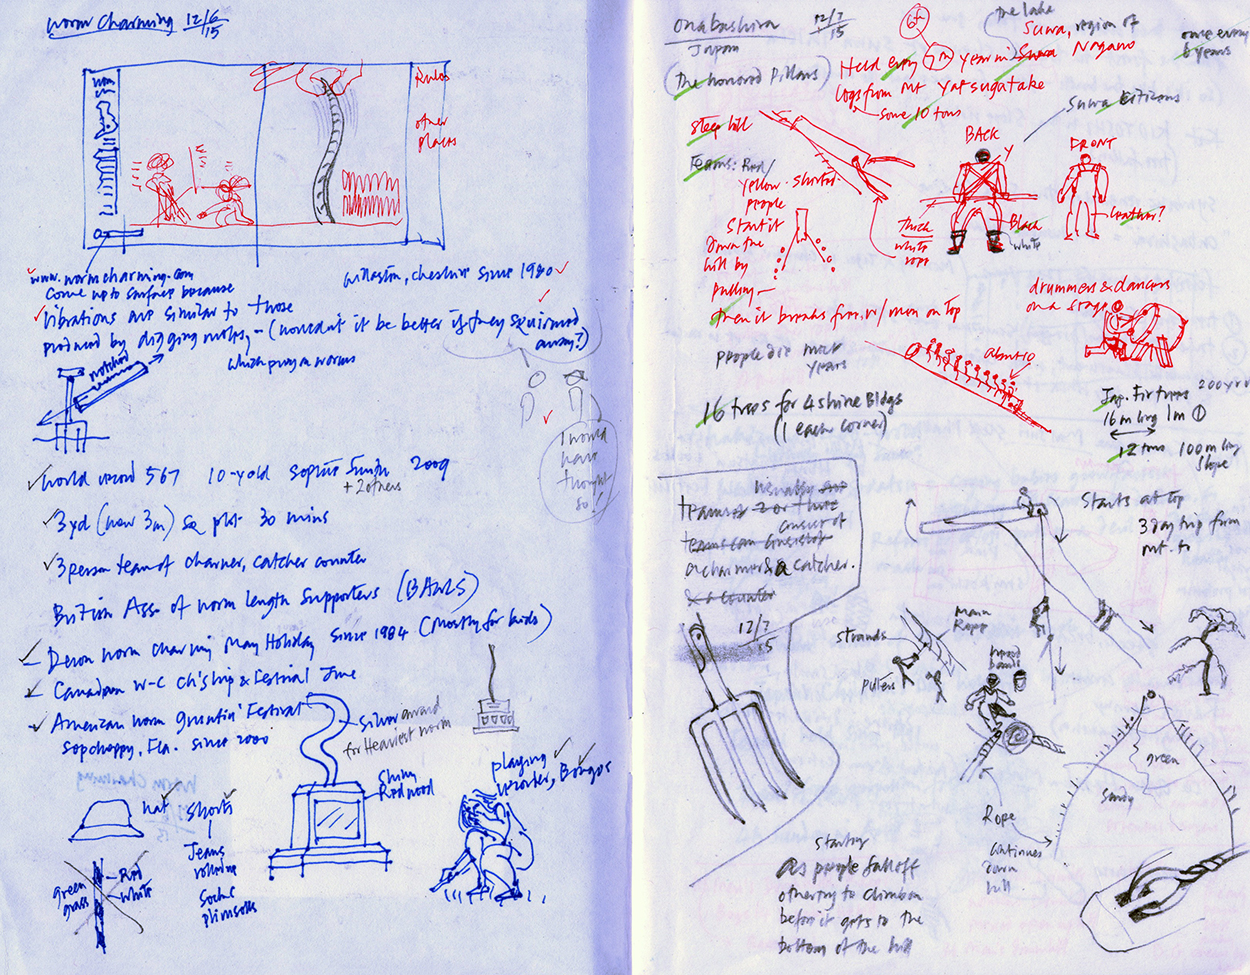
A typical spread from my notebook is often a hodgepodge of text ideas, reference notes and small drawings. Here are my notes for wormcharming (very safe, but wiggly!), and a particularly dangerous log-riding event held in Onbashira, Japan, which has resulted in the death of several participants over the years. Taschen never saw sketches; I always sent them final files, and all they did was to edit my text lightly for consistency. It was the best working relationship I’ve ever had.
We probably all have a competition or two that we find the most interesting (for various different reasons). For example, I used to think I had Olympic-level potential in stone-skimming. Do you have a favorite?

Two favorites: Kudu Dung Spitting, because it’s the most disgusting thing I can imagine! And, though it’s not a competition at all, the Twelfth Night Holly Man, because it came out the way I visualized it, and that didn’t happen every time!

Buy the book here: https://bit.ly/2LaKxJE
Crazy Competitions (1)

THE LATEST TOUR DE FORCE FROM NIGEL HOLMES.

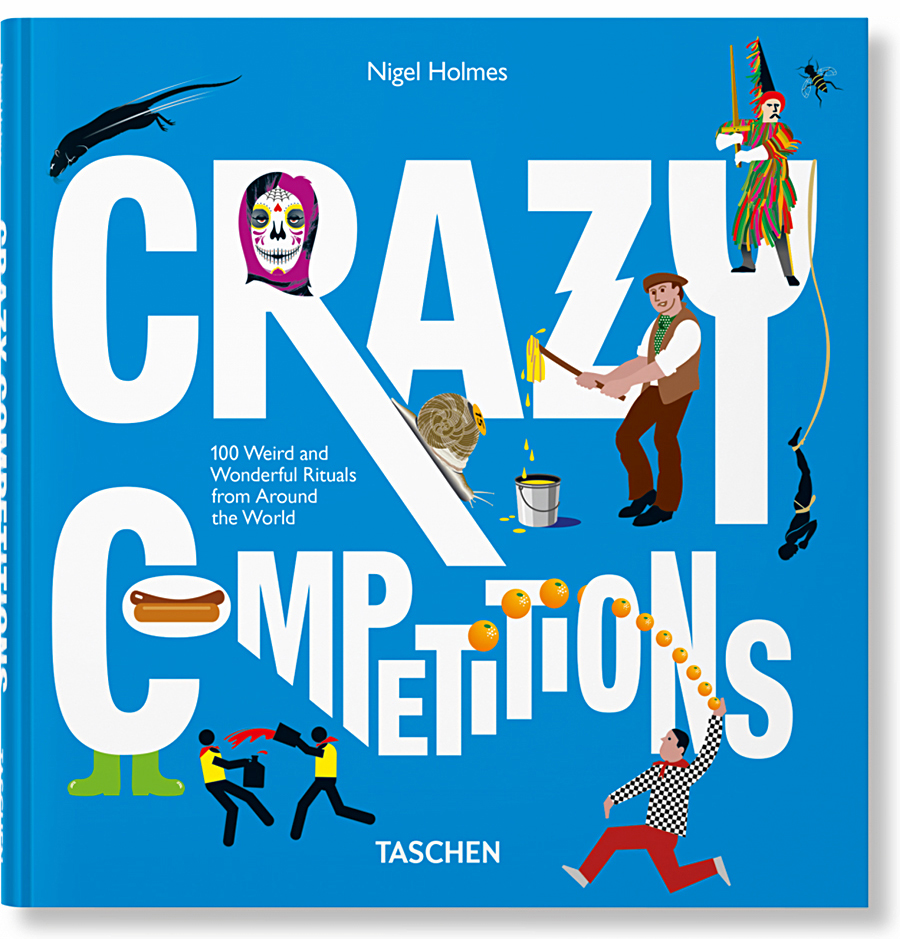
Nigel’s new gem is an infographically-driven book (published by Taschen) that explains 100 strange rituals from around the world.
We soon learn that people do some really weird stuff to pass the time. Like snorkeling in a peat bog, throwing dead rats, and rolling big cheeses down a steep hill. There’s even a Night of the Radishes.

The book contains a lot of information and explanation, but this is the work of Nigel Holmes, so naturally there are humorous insights (and outright jokes) running through the pages. One of the spreads in the book is completely fake. Sorry, no clue to which one here.

My advice: Get the book, and see how engaging infographics can be when the joy of explanation runs free. Buy it here: https://bit.ly/2LaKxJE

Below are five of the 100 spreads, with comments by Nigel. Click on them to see larger versions.
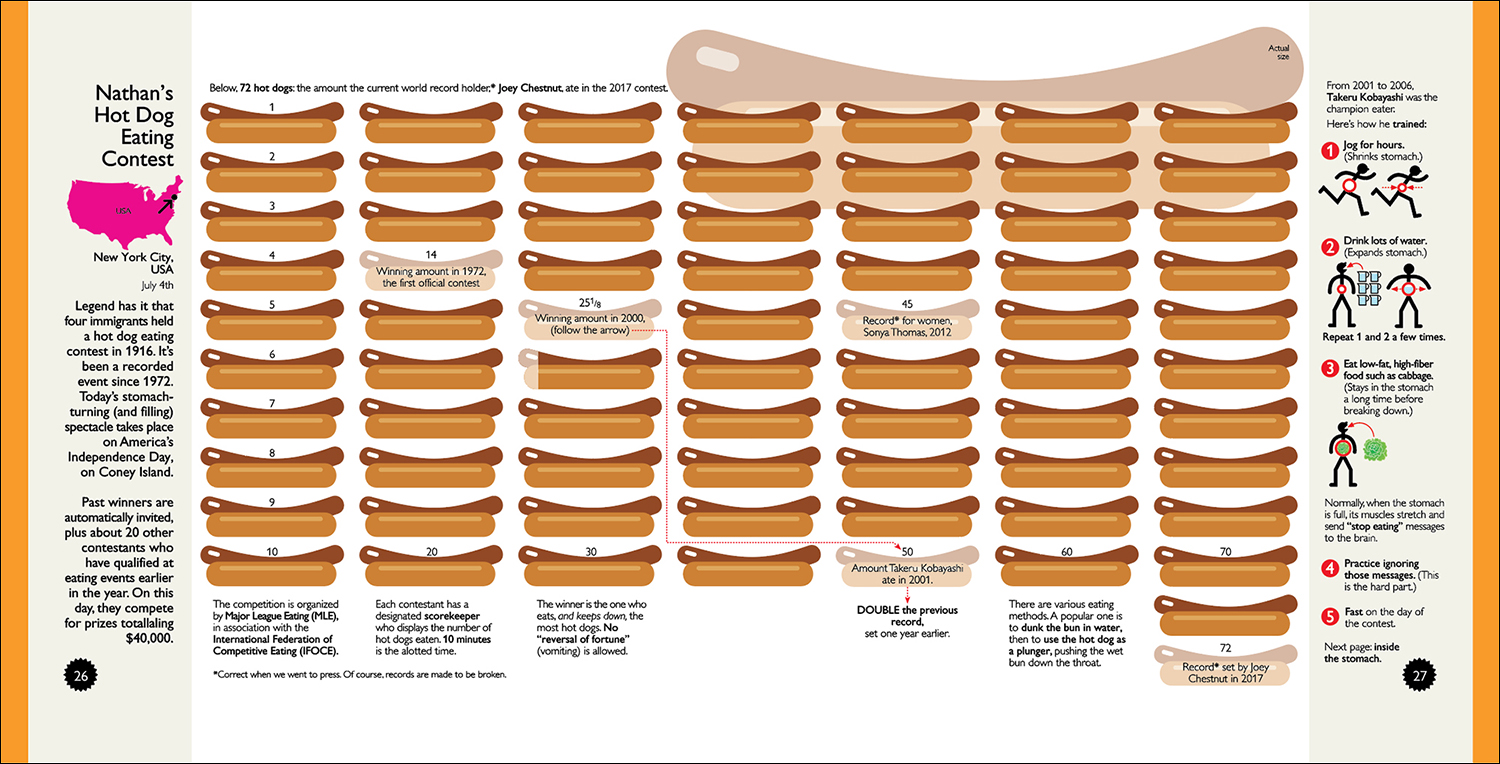
Nathan’s Hotdog Eating Contest
This stunning, if rather disgusting, event had intrigued me for years; it was the original impetus for the book, and the only one of the 100 that I actually attended. The contest organizers feel they should entertain the crowds for an event that only takes 10 minutes, so there are hours of pre-main-event sideshows while we wait in the boiling sun!
In many of the spreads in the book, I’ve included something that’s shown at its actual size. Here, the hot dog itself was a no-brainer.

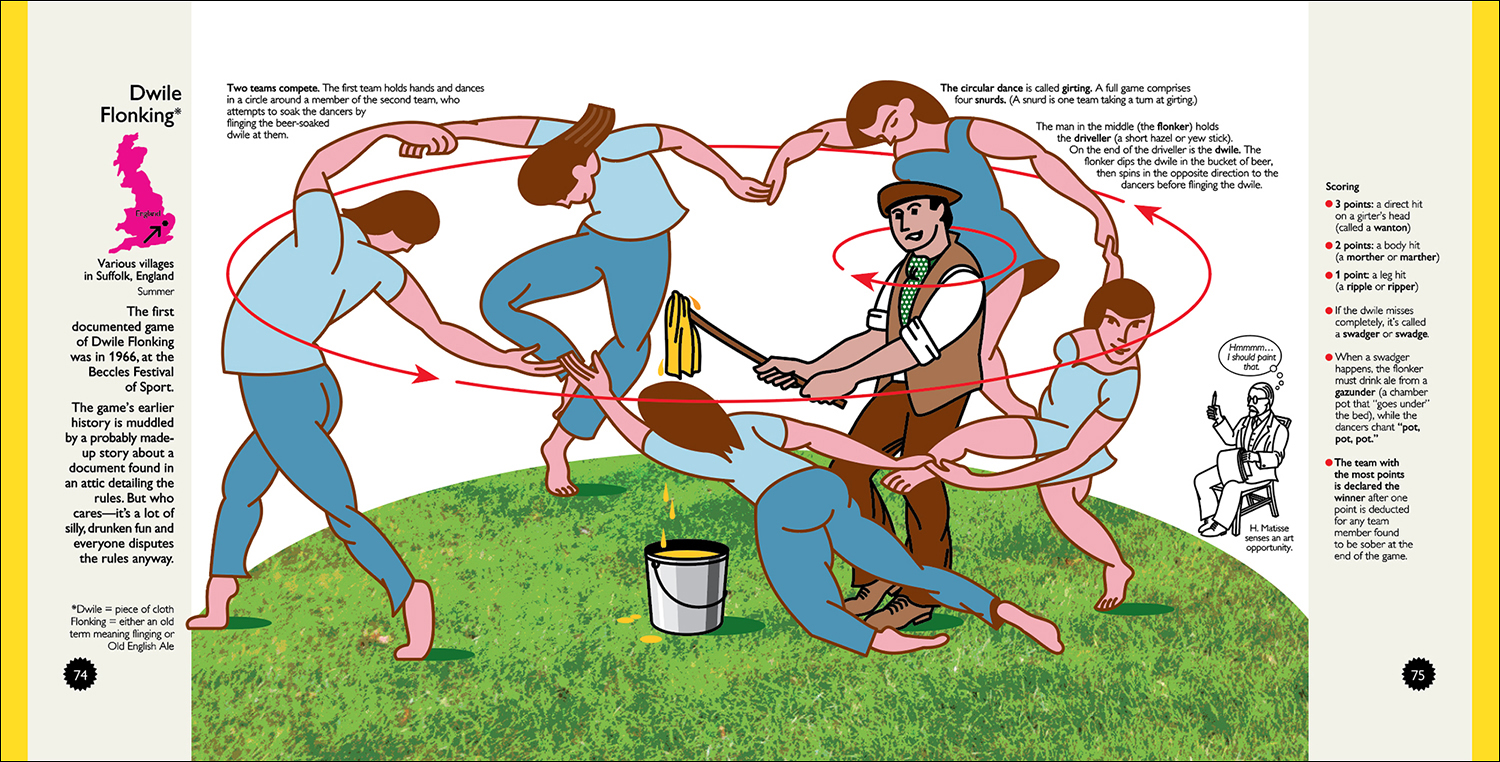
Dwile Flonking
One of the silliest English examples in the book—the odd names for everything, for a start—straight out of Monty Python. My oddly-shaped dancers are based quite closely on a famous Henri Matisse painting (La Danse, 1909–10; Google it, you’ll see). That’s why the painter is sitting there having a thought about doing a painting of the event.

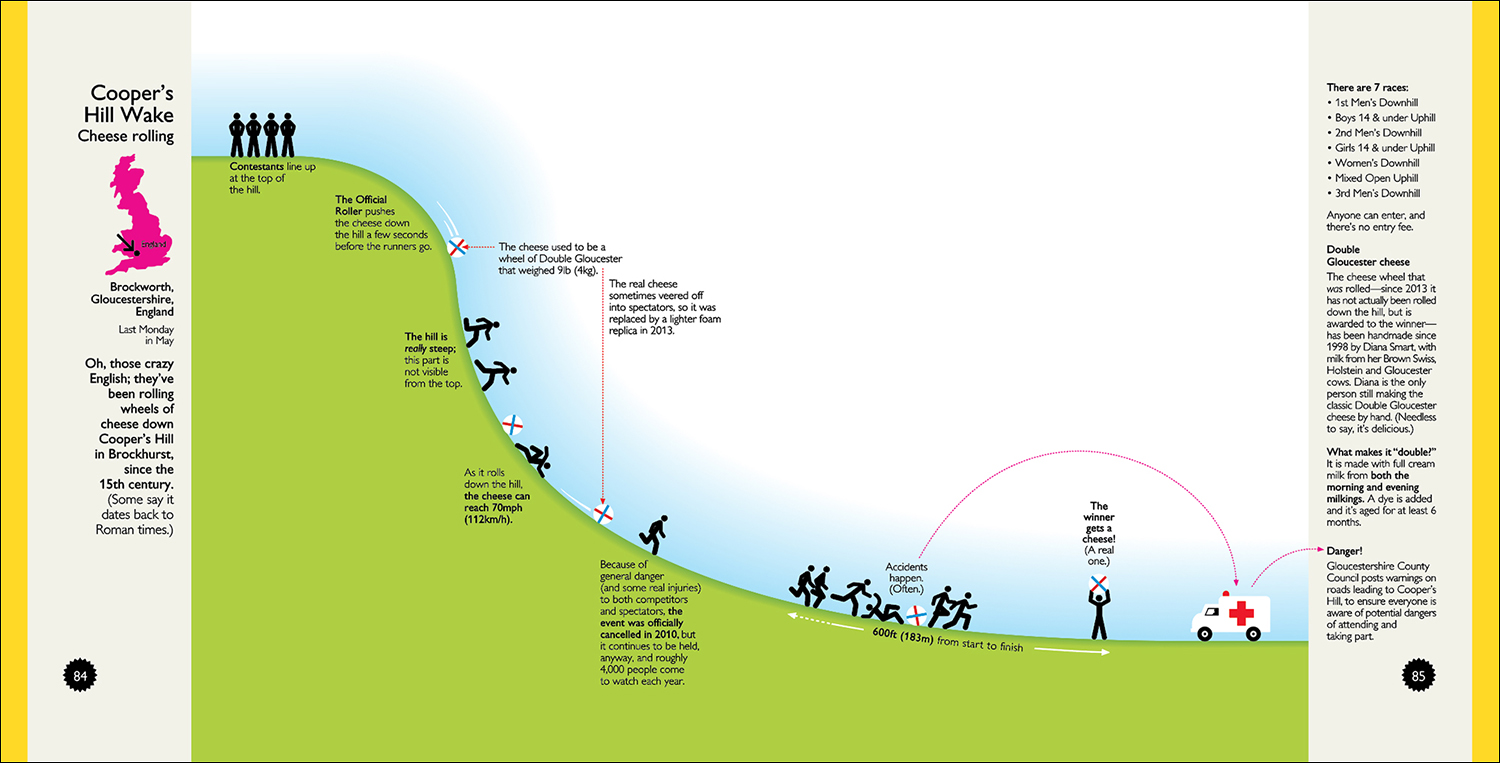
Cheese Rolling
I adapted this from my book Instant Expert, adding extra details. I was happy to leave a big white space on the right-hand page, and Taschen never questioned that kind of design choice. But they did want a worldwide collection, even though this could have been a whole book just devoted to UK silliness (with Spain as a close second). I’m constantly amazed at the odd things people do all round the world.

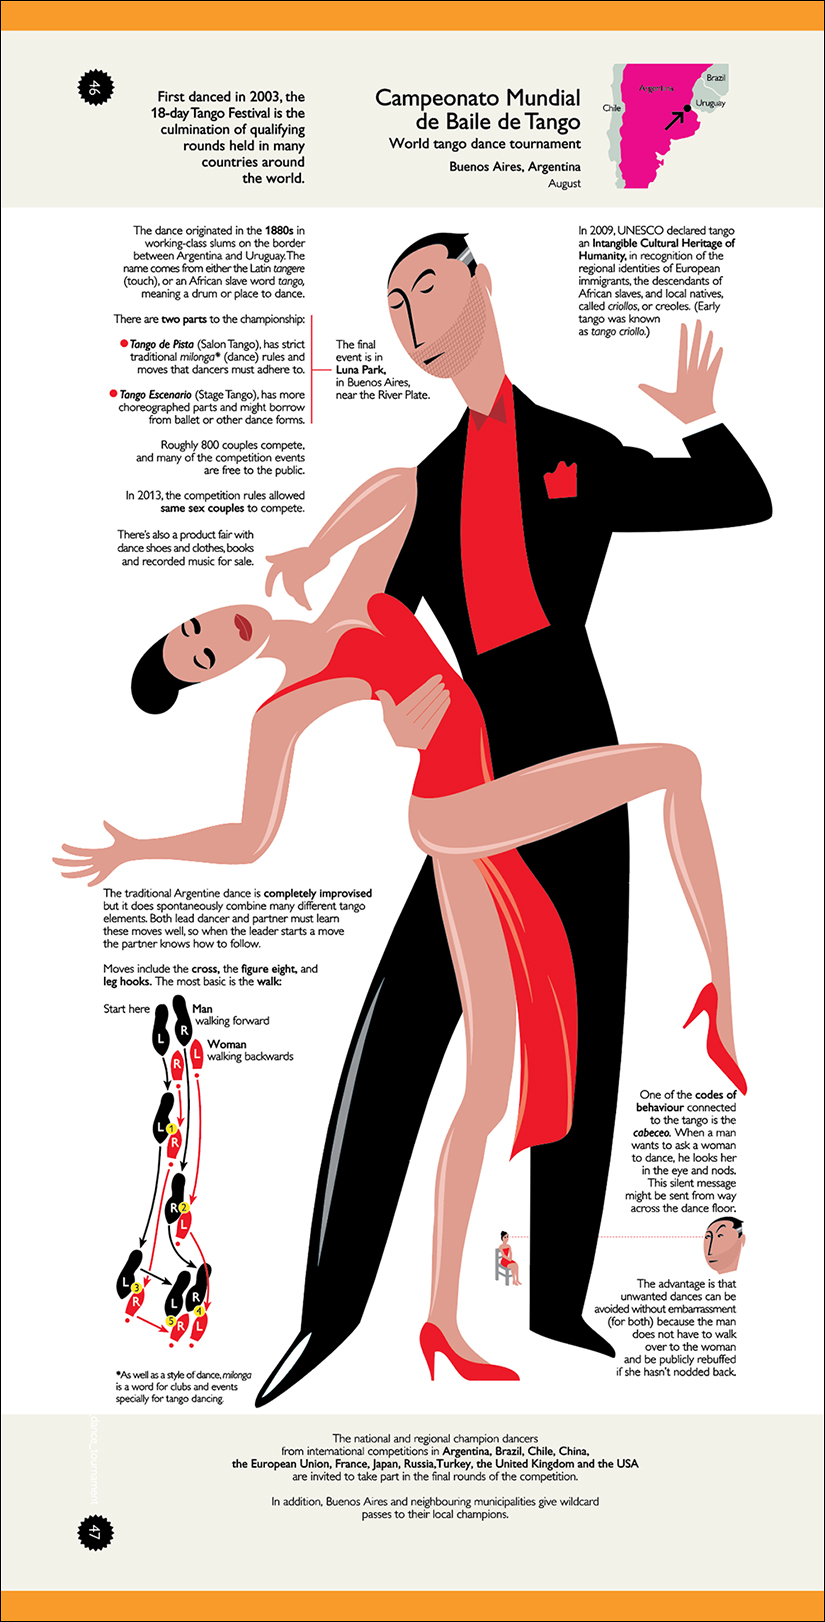
Tango
For events that seemed more natural in an upright shape, a few of the spreads are turned sideways. Like some other spreads, the Tango is really just a big illustration, with text explanations. But it was an obvious chance to include a diagram of the most basic move (color-coded to the dancers, of course!), and another little piece about how male dancers can “ask” for a dance (and how female dancers can avoid them!).
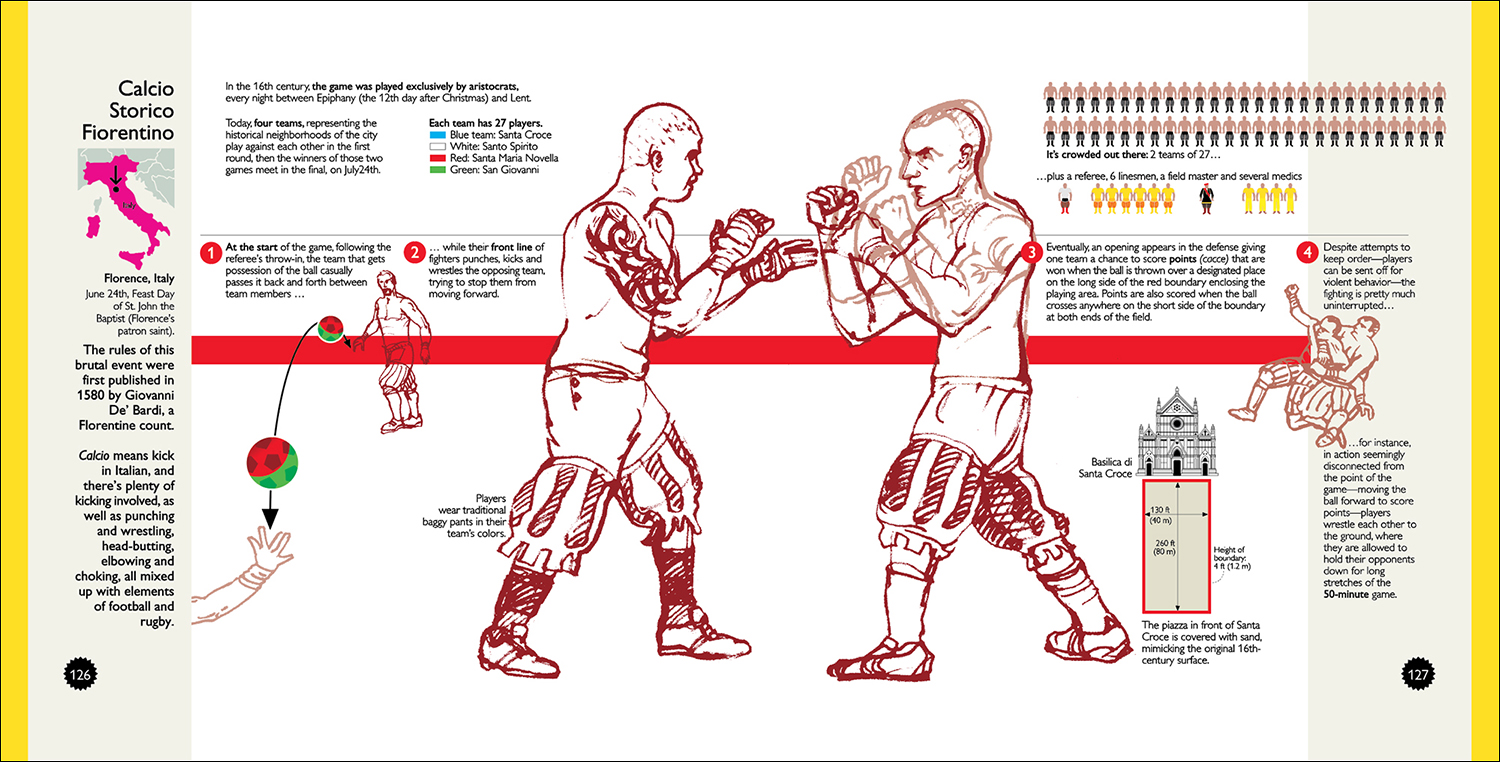
Calcio Storico
An Italian “sport” that mixes up wrestling, boxing, soccer, rugby elbowing and head-butting. The graphic is an example of mixing traditional infographics with freehand hand drawing on one spread. There’ll be more about the different styles used throughout the book (and about the almost extinct Freehand as my drawing program of choice) in the next post.

Next post: The process behind the infographics.