TWO DATA VISUALIZATIONS THAT ARE WELL WORTH EXPLORING.
My good friend, Alberto Cairo (University of Miami), gives us his thoughts on these current examples.
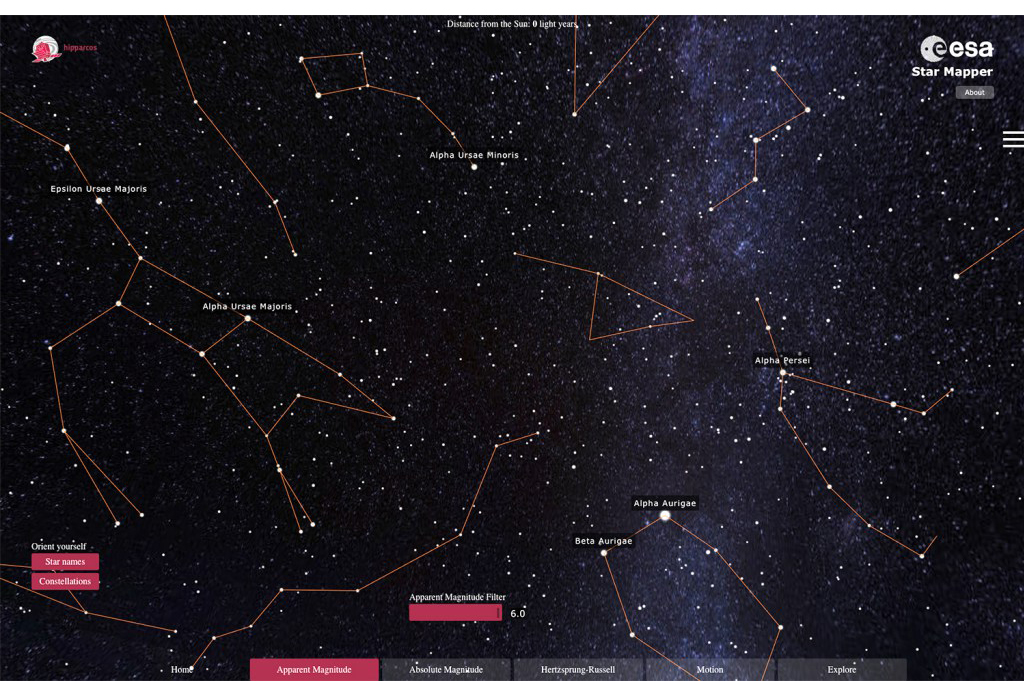
Star Mapper by Tulp interactive
http://sci.esa.int/star_mapper/ http://tulpinteractive.com
“This massive visualization of 60,000 stars, a subset of the entire catalogue, was commissioned by the European Space Agency. The interface allows the user to easily explore the data in many different ways. What I like most about it, is that you can switch smoothly between views by using the navigational tabs along the bottom of the page. In visualizations, transitions are information, and here they are clear.”
2016 Election Forecast by FiveThirtyEight
http://projects.fivethirtyeight.com/2016-election-forecast/
“An excellent combination of charts and maps. This visualization is much simpler on the surface than Star Mapper, but the statistical analysis behind the numbers is complex. It’s a masterful representation of the data. Simple, but not simplistic, using a broad range of chart types: choropleth map, time series, box plots, cartogram*, diagram, bar charts, histogram. By the way, cartograms (which are often criticized) can be very useful if they are paired with a traditional representation of the geographic area, as here. Overall, this series of graphics is a very good way to present a complex dataset”.
*A great new tool to make cartograms: https://simonrogers.net/2016/09/22/tilegrams-make-your-own-cartogram-hexmaps-with-our-new-tool/
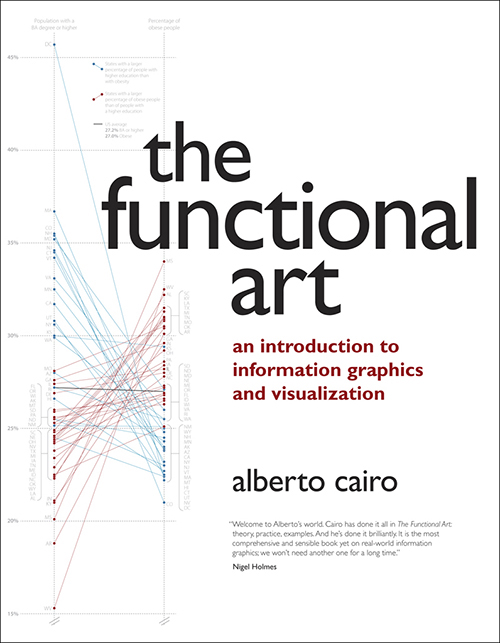
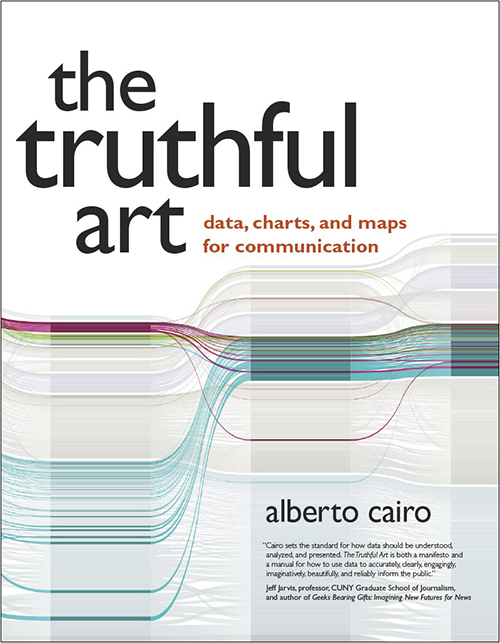
Alberto has written these two essential books for people interested in infographics and data visualization. Read them!
Professor Cairo is Knight Chair in Visual Journalism at the School of Communication of the University of Miami, and director of the visualization program at UM’s Center for Computational Science. His online course “Introduction to Infographics and Data Visualization,” has attracted more than 14,000 students from more than 100 countries. He also runs a track in UM’s MFA in Interactive Media that is focused on infographics and visualization.


