VISUAL DEFINITIONS OF THE INFOGRAPHIC CRAFT.
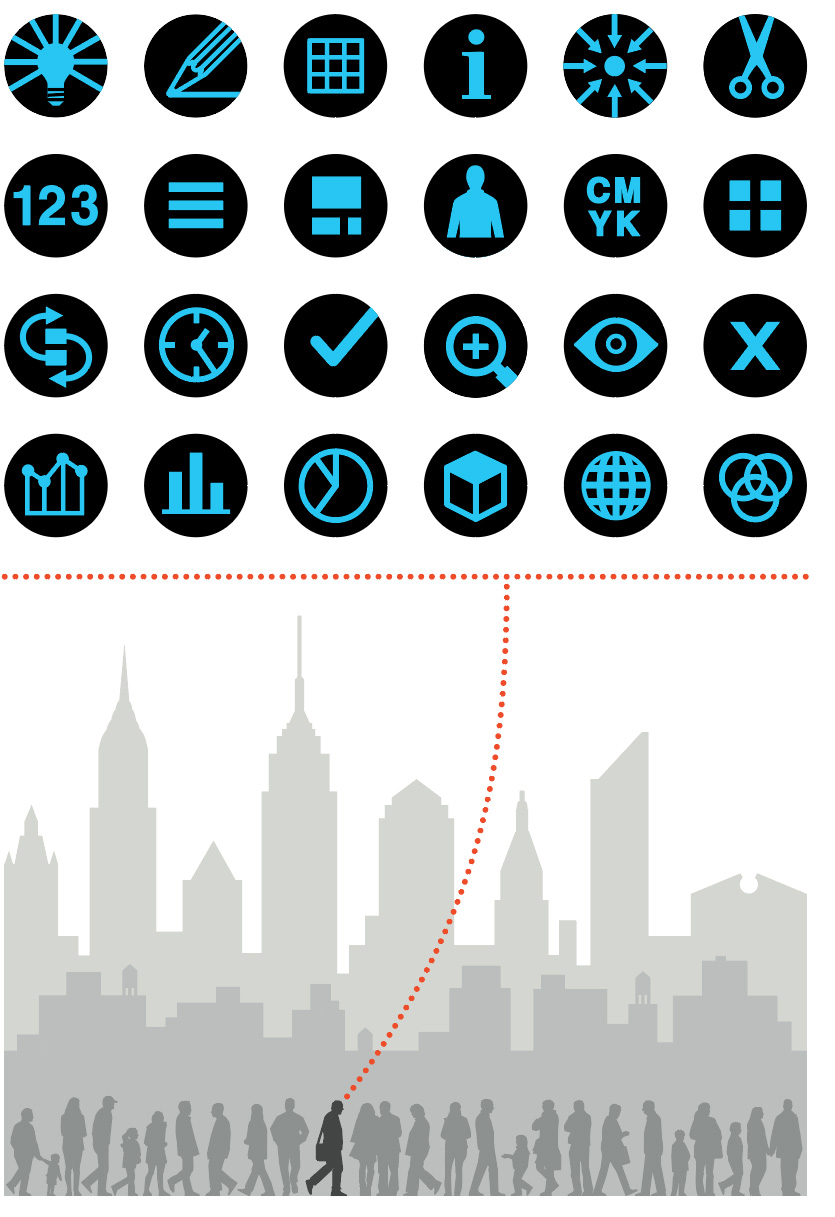
I’m walking in Manhattan (where I used to live), my head full of thoughts about making infographics. Expressed (of course) in pictograms. If you click on the image, you’ll see that I’ve decoded it. (Note: Keep your expectations reasonably low before clicking. It’s not rocket science.) This illustration originally appeared in the book “Infographics. A Visual Definition”. Eighty-one infographic designers submitted a page. It was produced to mark the twentieth-anniversary of the Malofiej conference. This year will be the twenty-fifth. More about that in later posts. The book can be purchased here: http://www.snd-e.com/es/libros/infographics-visual-definition
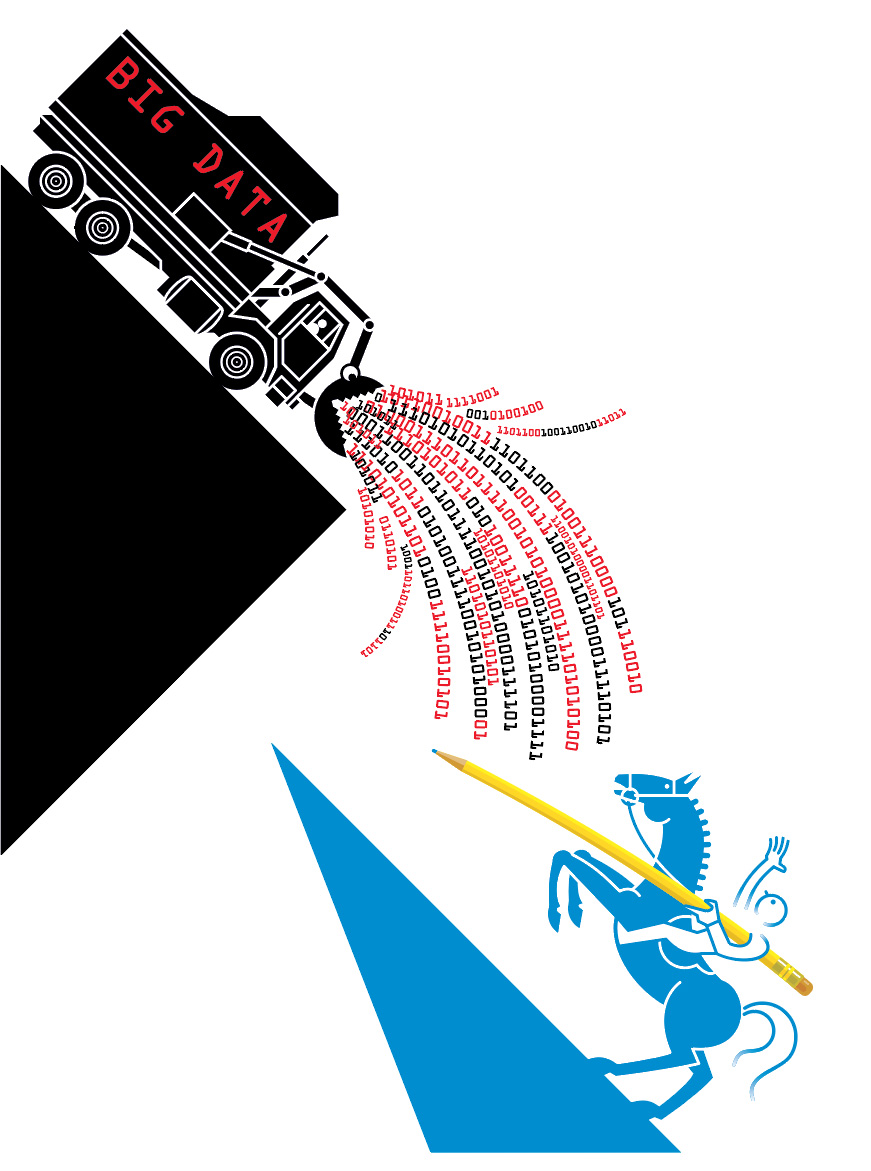
The example below is my favorite from the book. Nigel Holmes is protecting us from the onslaught of Big Data with a pencil. For some of us, it’s a mouse or a stylus, but the role of the designer in a world of ever-increasing information has never been more valuable. In a best-case scenario, that data is analyzed, and the truths within it are explained with clear, concise visuals. That’s my dream.


