The latest issue is going out to subscribers this week, and will be on newsstands next Tuesday. A brilliant combination of features, engineered by Robert Priest and Grace Lee. Here’s some sample spreads from the issue. Subscribe here: https://shop.8by8mag.com/collections/subscribe
Click on the graphic for a larger version.
A cautionary tale I planned this visualization using the 2014 FIFA World Cup Technical Report, but when the 2018 version came out, some of the data was not included. So I sat down and watched the highlights of all 64 games (with a notepad).
Clearly, I didn’t follow the advice that I give to students: Don’t commit to visualizations before you have the actual data (or are sure you’re getting it). It might never materialize.
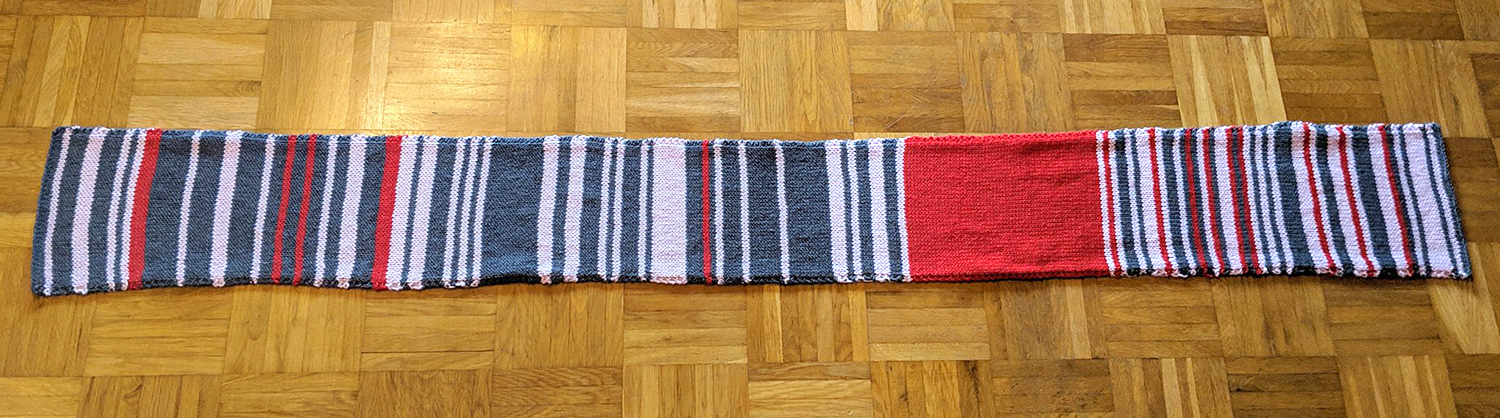
Claudia Weber recorded her Munich commuting delays in 2018 by knitting them into a scarf. Two rows for each day.
(On a good day, the trip takes 40 minutes.)
Gray: Delayed less than five minutes
Pink: Delayed five to 30 minutes
Red: Delayed over 30 minutes one-way, or delayed both ways.
The red strip was a six-and-a-half week period when the tracks were being replaced. During this upheaval, the ride took just under two hours each way. Generally, train delays have become an area of concern in Germany.
Journalist Sara Weber, Claudia’s daughter, revealed the project on Twitter nine days ago. https://bit.ly/2FzrRn8
The tweets generated a lot of interest, and that led to the scarf being auctioned on eBay for Bahnhofsmission, a charity that helps people in need at rail stations. The auction ended yesterday and raised an impressive 7,550 Euros ($8,675).
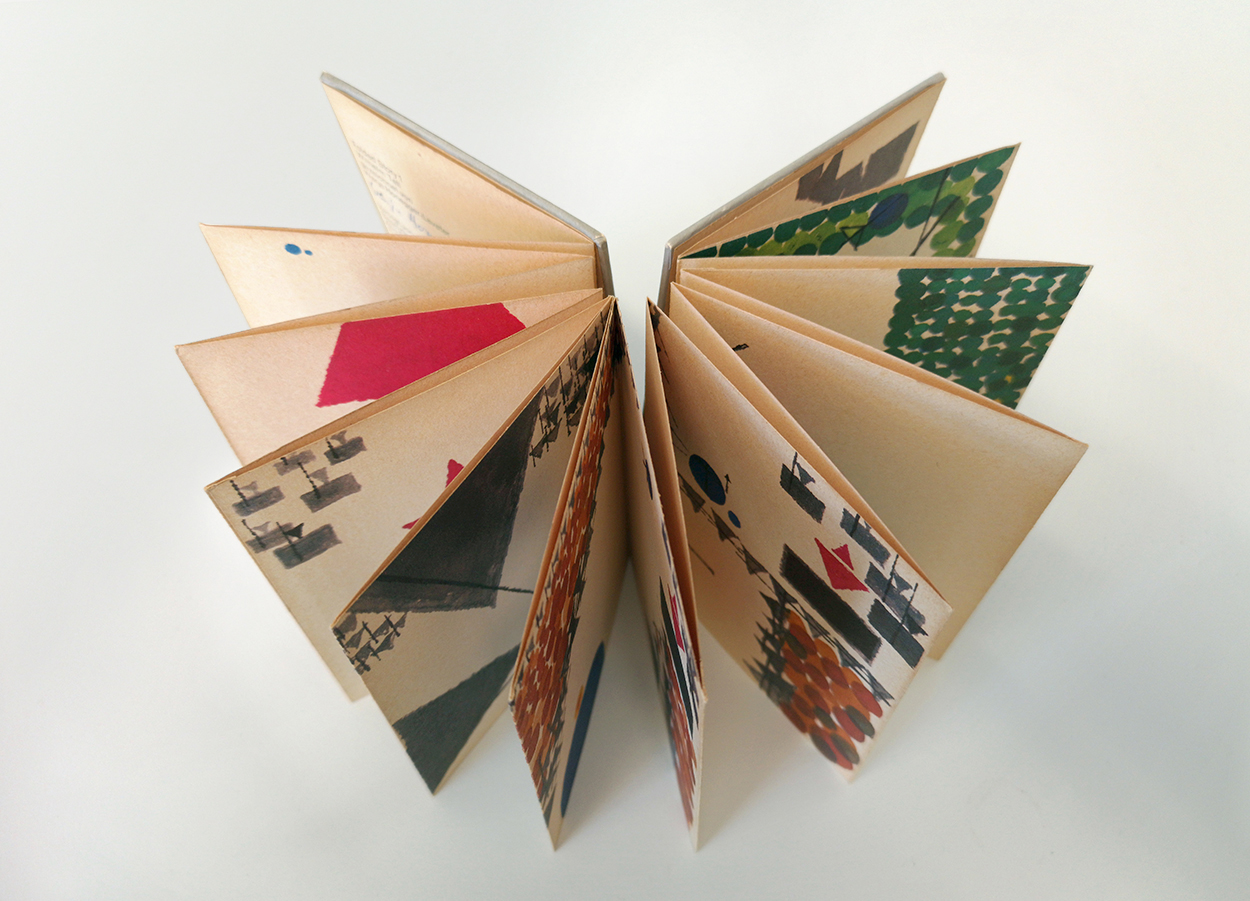
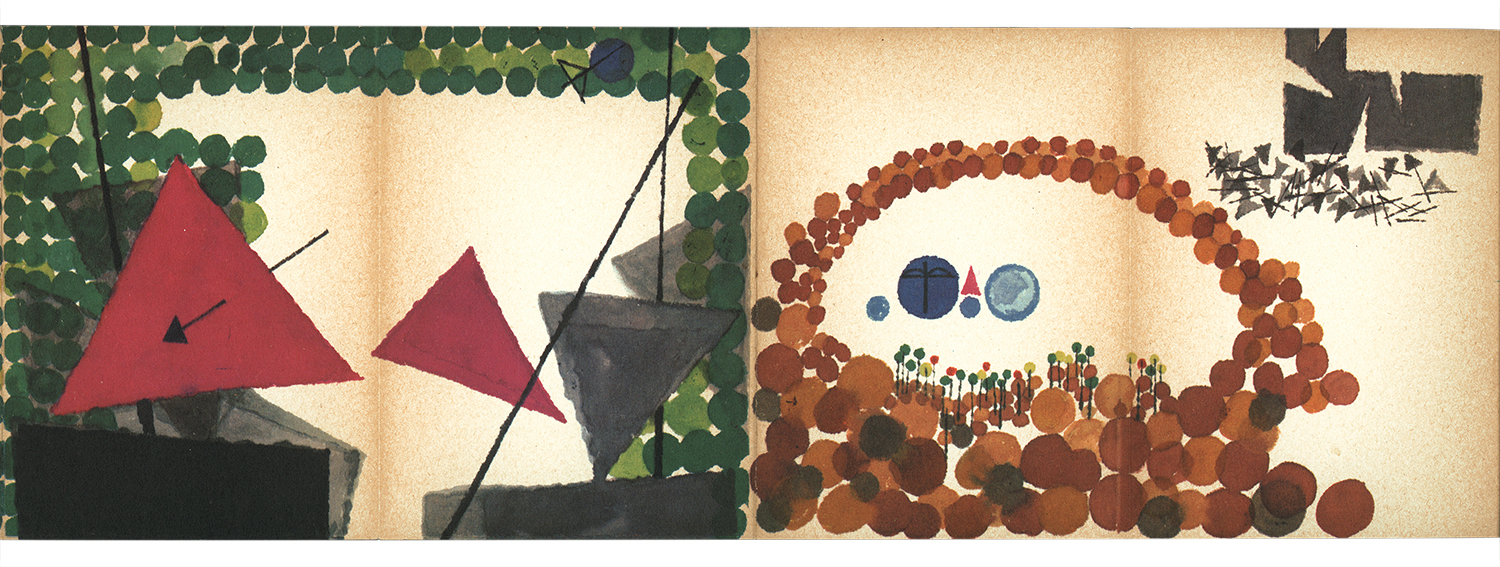
This experimental book is the work of Warja Honegger-Lavater, a Swiss artist and illustrator, who had a design career that included creating logos and trademarks. In 1962, MoMA published “William Tell” as an accordion-fold book. Warja went on to produce several books that featureclassic fairy tales by Hans Christian Andersen, the Brothers Grimm and Charles Perrault.
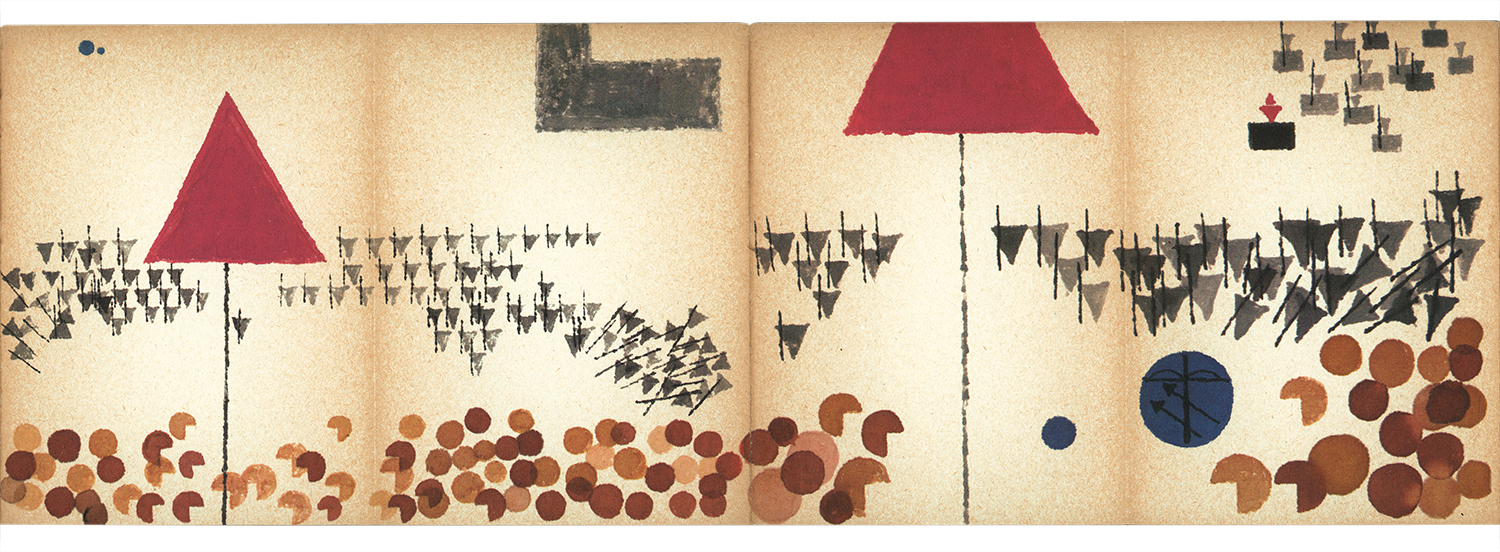
The Tell legend holds an important place in the folklore surrounding the birth of the Swiss nation. It’s told here entirely with symbols, which are explained in the key on the opening spread. The idea of communicating entirely with pictograms has been tackled by a number of people. Nigel Holmes wrote a series of excellent posts on this blog about attempts to create a language using icons. This is the first one: https://wp.me/p7LiLW-LX
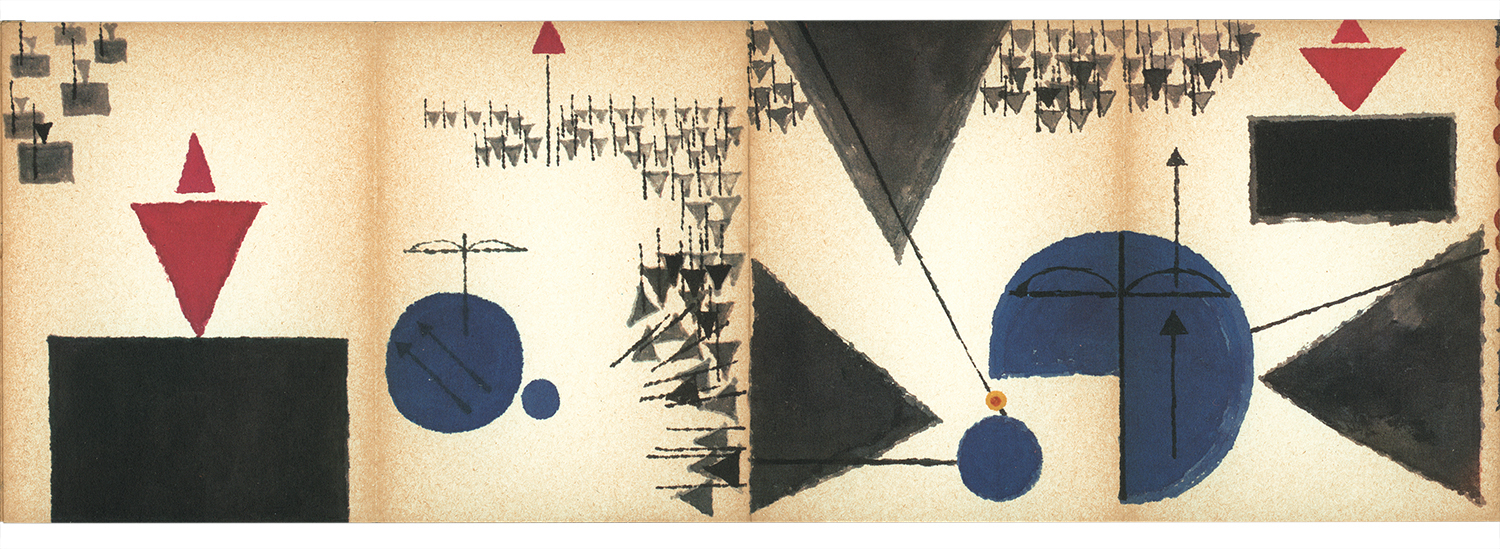
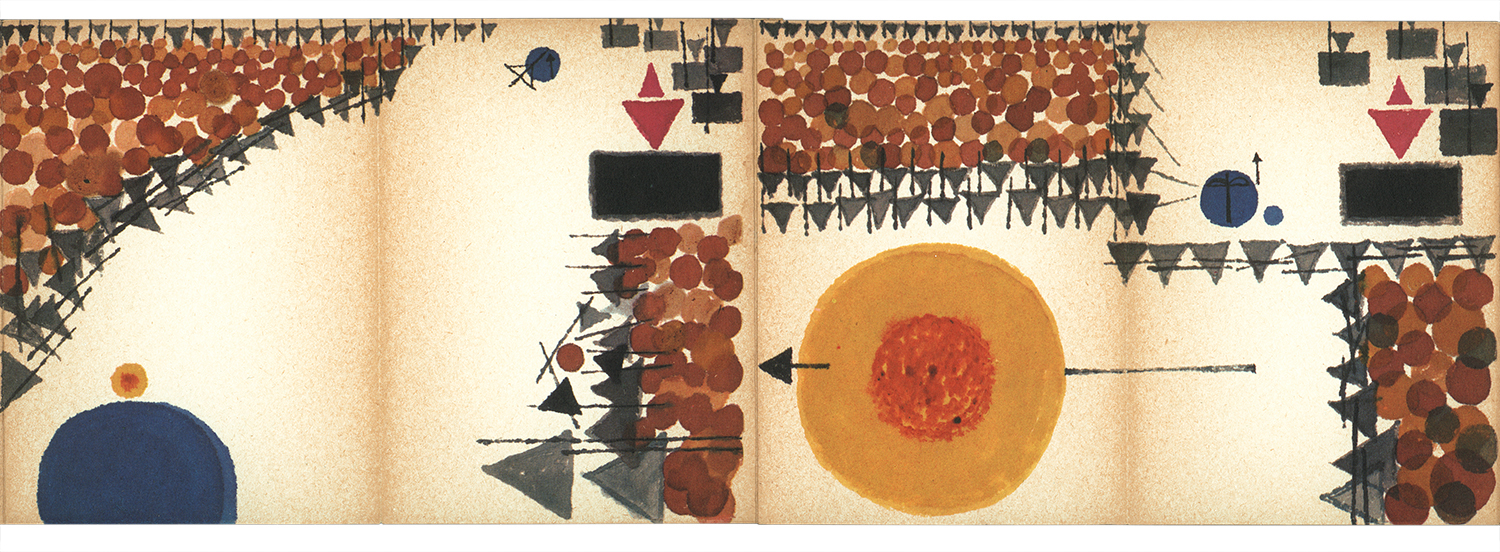
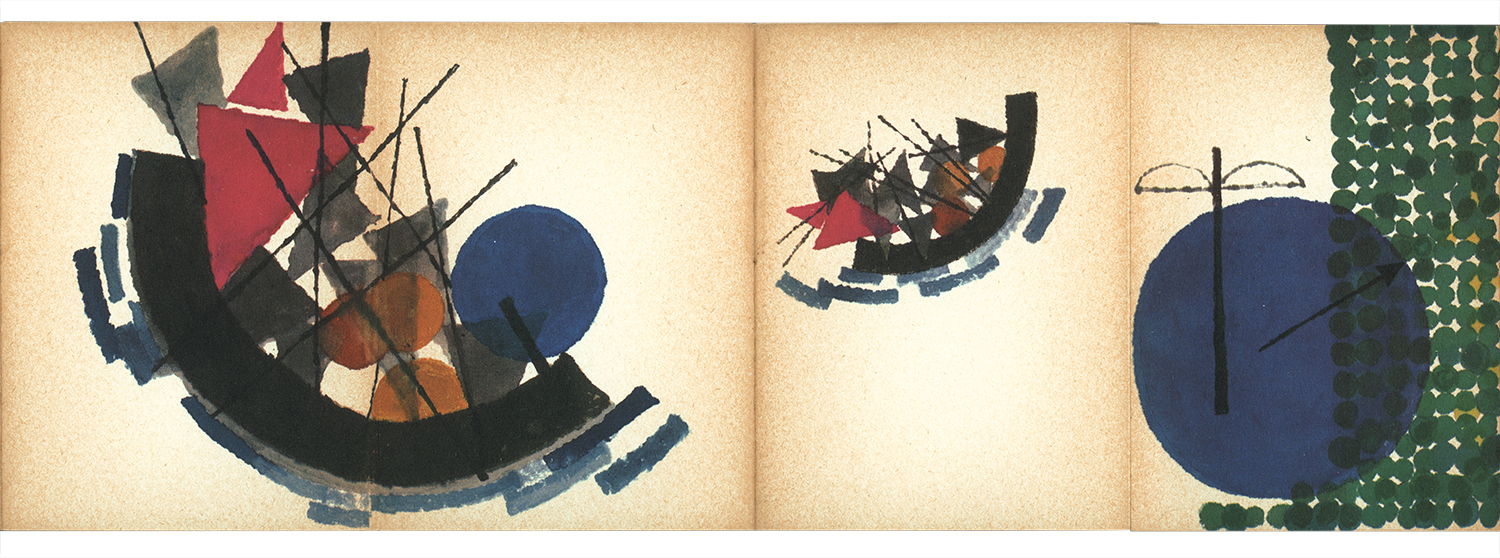
Below is “William Tell” told with symbols. The icons change size based on their importance to that part of the story. (I added a translation of the key.) It‘s a fascinating and creative infographic exercise that is clearly aimed more towards adults. Although for children, the use of a symbol language softens the worrying aspects of this rather dark tale. A counterpoint to this argument: As much as I love pictograms, and the book, I’m left feeling that this ultra-graphic approach is perhaps not the most engaging way to introduce your child to the magic of storytelling.
The legend in words
Bailiff Gessler, who was a very nasty piece of work, put his hat on a pole in Altdorf town square, and made the people bow down before it. But William Tell walked straight past, so he was arrested. Knowing that Tell was an expert marksman, Gessler ordered him to shoot an arrow (from 120 paces away) into an apple placed on Tell’s son’s head. Failure, or refusal to do it, would mean death for both Tell and his son. Of course, we all know that Tell shot the apple straight off his son’s head without harm.
However, Tell had taken a second arrow from his quiver, and when Gessler asked him what it was for, Tell replied that if his son had been harmed, he would have used that arrow to kill Gessler. The result of this revelation was that Tell was dragged to a boat in which Gessler was traveling back to his castle at Küssnacht. The general idea was that when they arrived there, Tell would be thrown in the dungeon indefinitely.
On the trip across Lake Lucerne, a strong storm sprung up and a scared Gessler was pressured by his soldiers to release Tell so that he could steer the boat to safety. Tell maneuvered the boat to land, grabbed his bow and quill and jumped out. Then he kicked the boat back out into the lake, and escaped. Tell raced to a lane that led to Gessler’s castle, and killed him with an arrow to the heart as he passed by. The people were free of the tyrant.
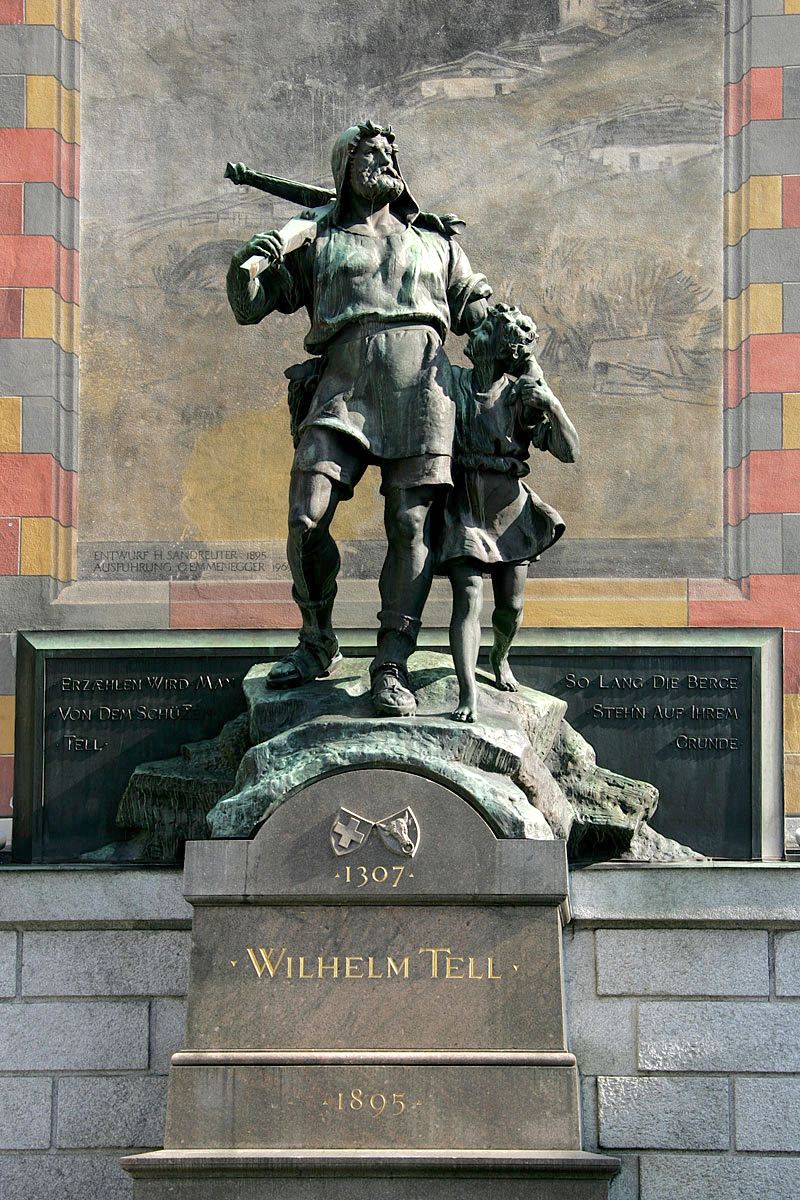
Tell Monument In the market place, Altdorf.
Photograph by Roland Zumbühl
The collector
I’m once again indebted to my friend, Professor Michael Stoll, who owns this signed copy of the book, and suggested the subject. There are several posts from Michael’s wonderful collection of historical information design on this blog. Of course, we can all learn a tremendous amount from the best work of the past.
Start with Michael’s amazing Cadillac: https://wp.me/s7LiLW-cadillac
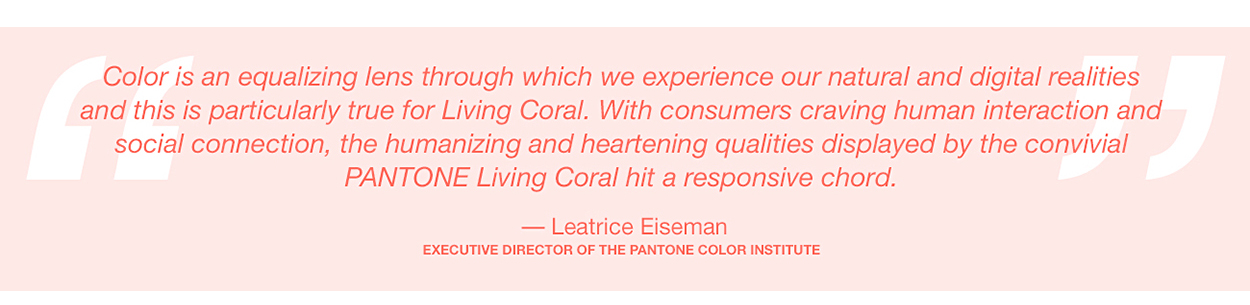
Let’s start the new year with the right color. Once again, Pantone shows us the way forward for our infographic color palette. I’m intending to get “Living Coral” into every project in 2019. And if I happen to get asked by National Geographic to make a graphic about living coral, I will be so ready.