SOME THOUGHTS ON A THURSDAY.

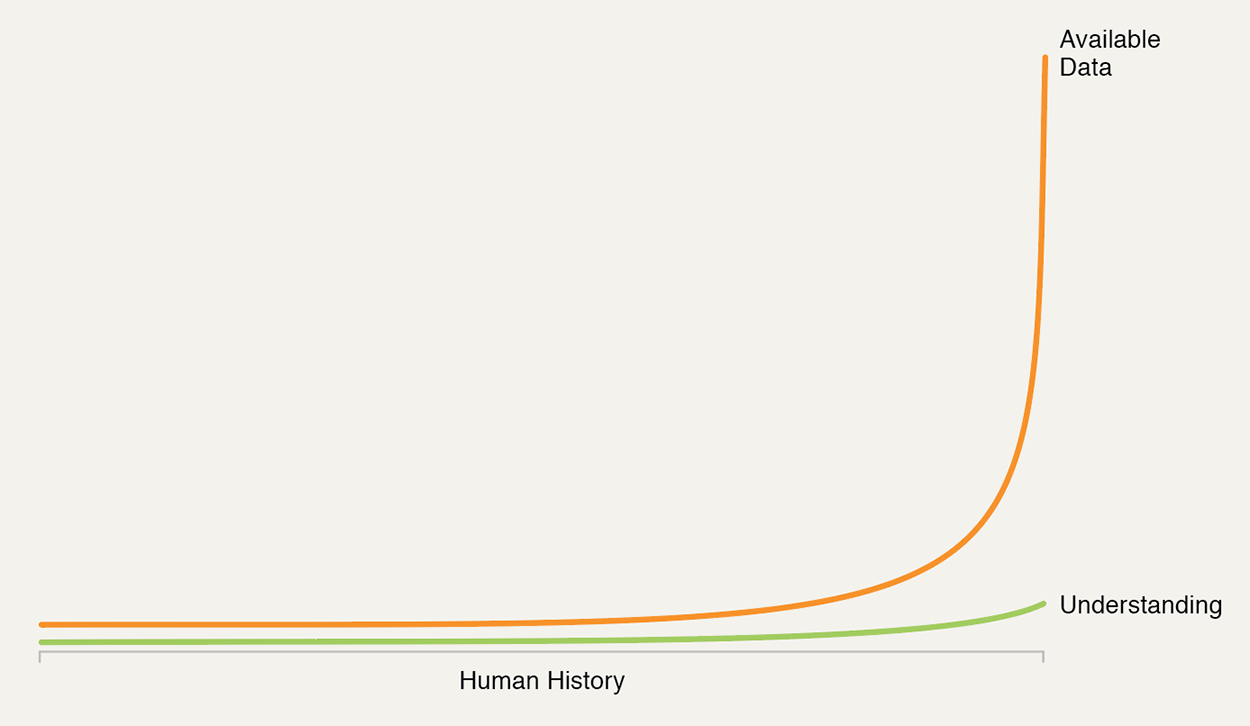
Information upswing Stephen Few succinctly captures the position we’re in. From his book: “Signal.” On Amazon: goo.gl/mAVGLW
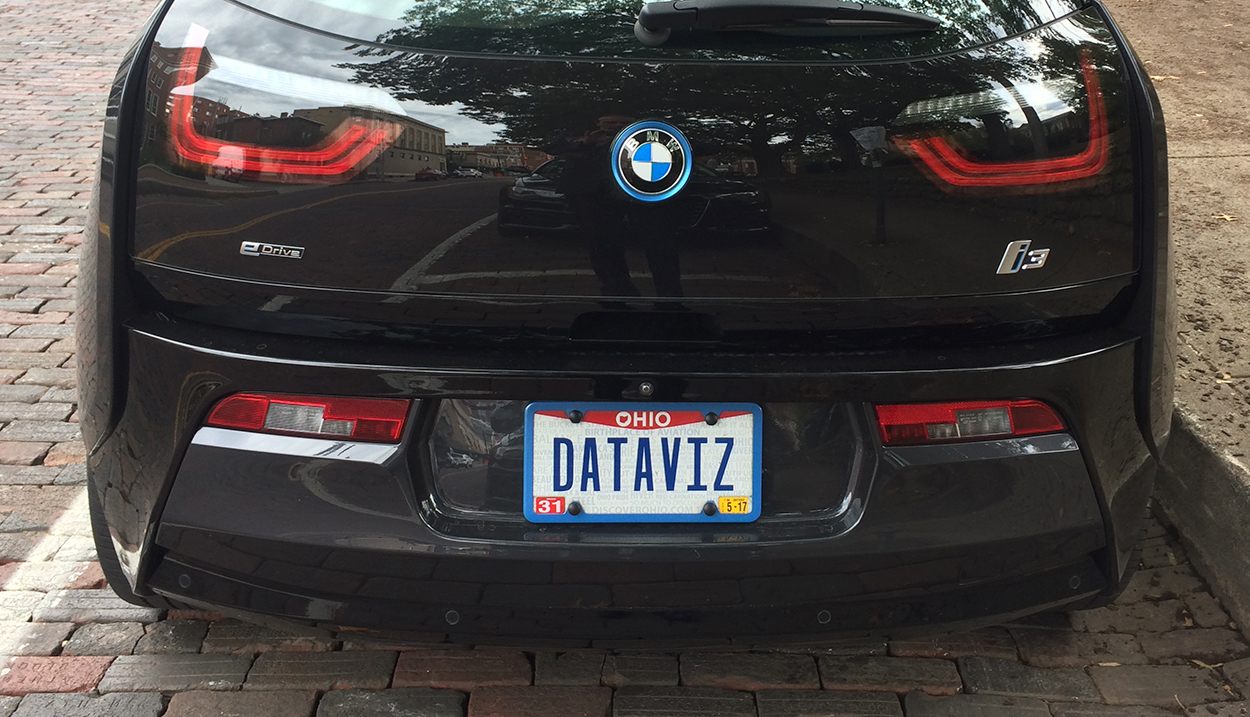
The best license plate This stopped me in my tracks as I approached our building. Who owns that gem? I soon had the answer: Eric Duell, who is Vice President, Analytics and Intelligence at The E.W. Scripps Company. The BMW i3 REX is electric with a gas-powered engine to extend it’s range. (Notice that data viz people are eco-conscious.)

Only one person in Ohio can have this plate, and it’s clearly not going to be me.

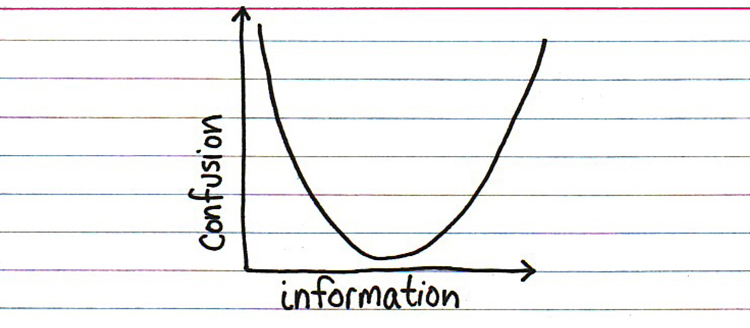
The sweet spot In terms of understanding, it’s halfway along the information axis. Jessica Hagy’s blog: http://thisisindexed.com

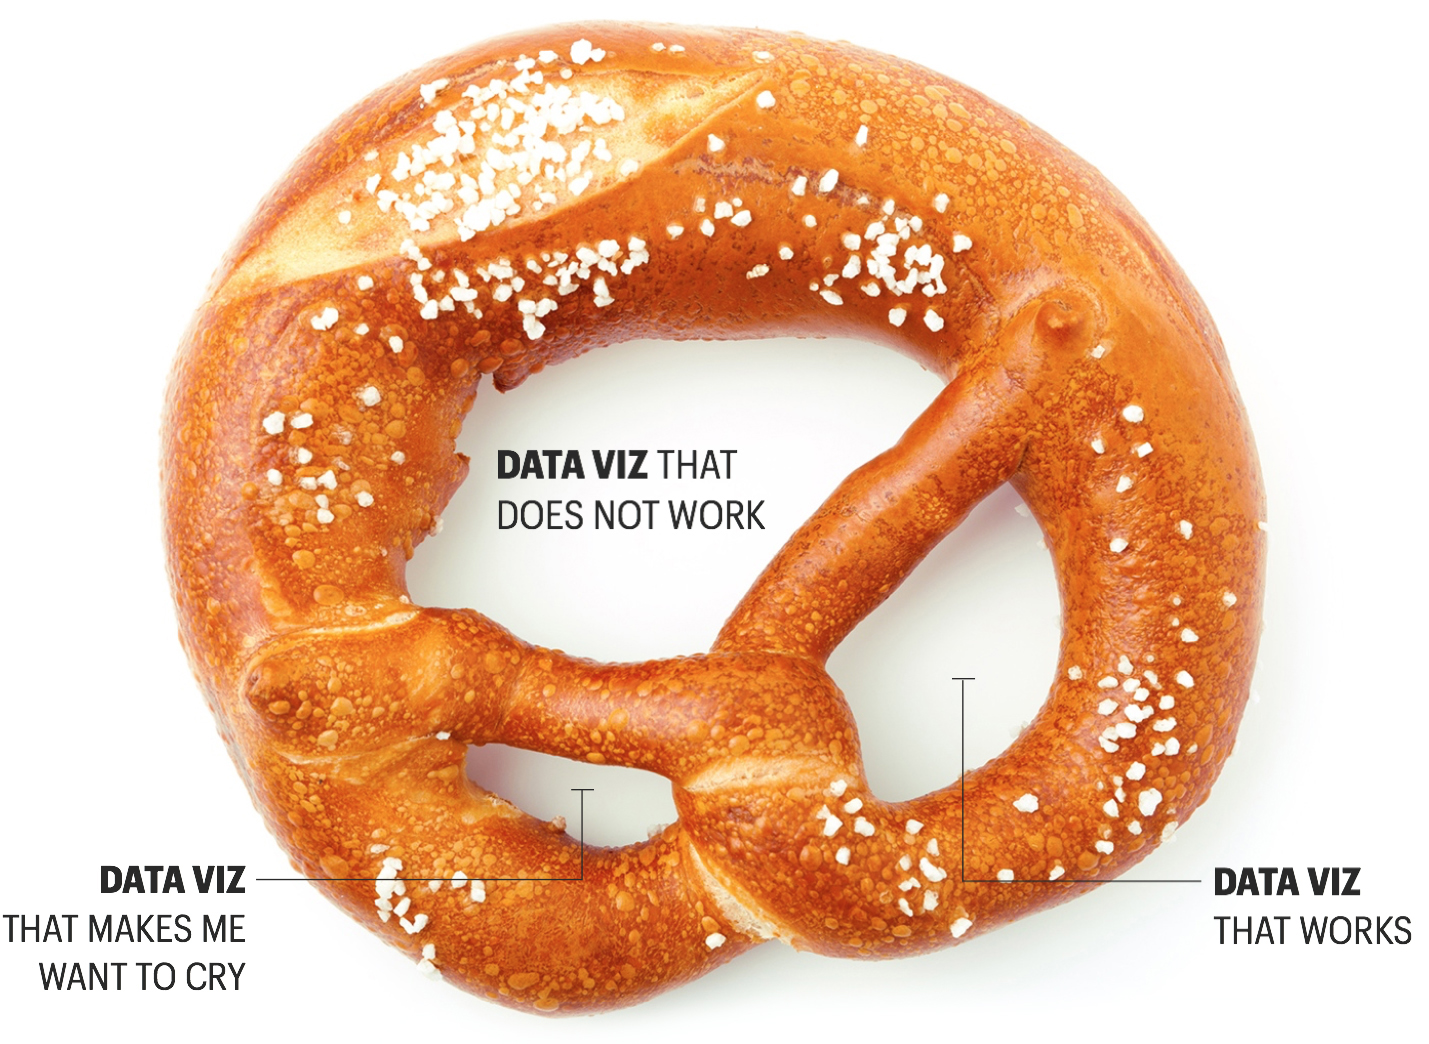
Data pretzel I see a lot of data viz, and (of course) there’s some brilliant examples, but also a lot of scary stuff. However, there’s plenty of room for optimism. Although data visualization has been around for a very long time, a fundamental component has changed: we now have unprecedented amounts of data. And there’s many new ways to edit and display this information, so let’s give the process time to develop. (Photograph © annete/123rf)

