Category: Data visualization

The Isotype revolution

OTTO NEURATH AND THE MODERN PICTOGRAM.

This is the second post in a series about the search for a pictorial language, by Nigel Holmes.

Excuse me where’s the restroom? Moments later, I see the familiar icon of a man and a woman. Ah, relief. Most people don’t know that the grandfather of these welcoming little people is Gerd Arntz. (They probably don’t care much either, when nature calls.) Gerd Arntz’s boss was Otto Neurath.

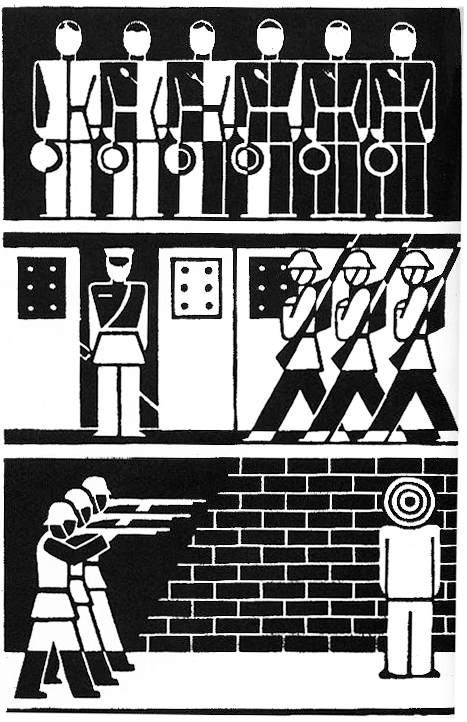
Mention Neurath to anyone who knows the name, and the kind of illustration that will come to mind was probably created by his brilliant collaborator (and toilet-icon grandfather) Arntz—an artist who made mostly black and white wood- and lino-cuts, and whose work still looks modern though he started working 90 years ago. (He died in 1988.)
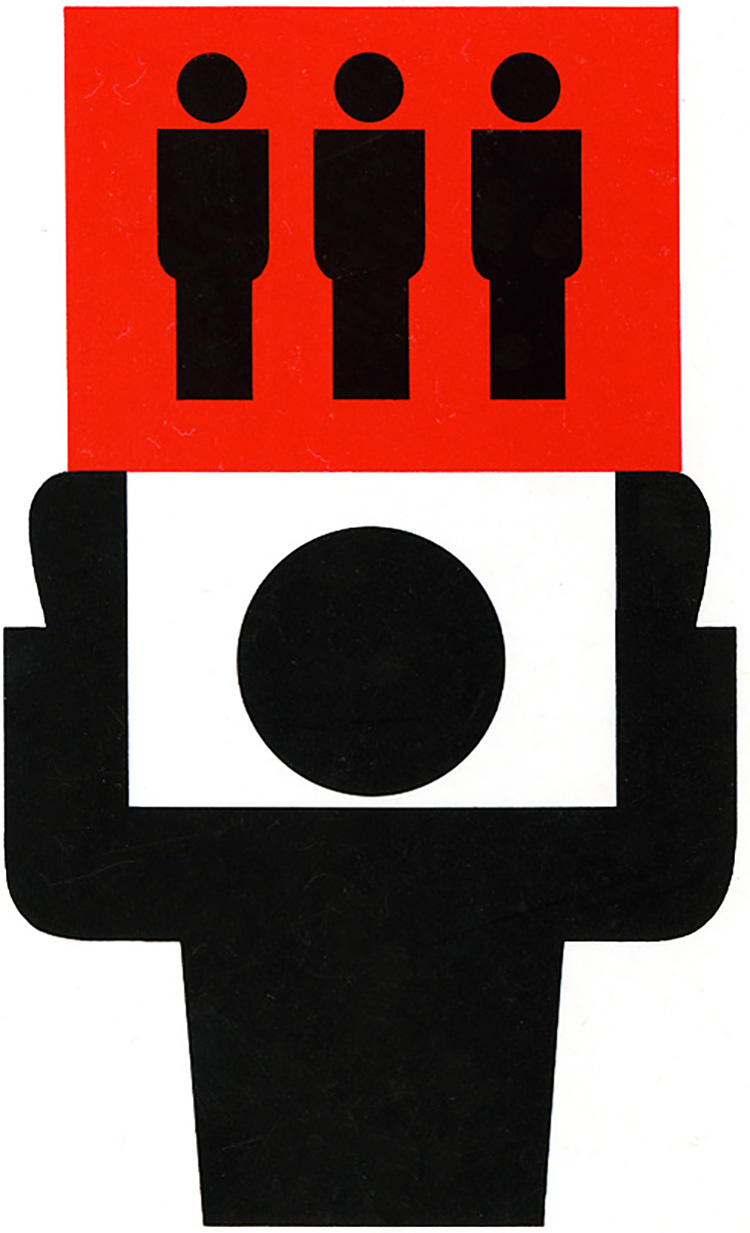
But it’s Otto Neurath (1882–1945) who was the force behind the graphic information movement called ISOTYPE (International System of TYpographic Picture Education). It’s still a huge influence on information graphics and data visualization. Below is the well-known logo.
Neurath was a social scientist, not a graphic designer. True to the idea of this blog, he made “Infographics for the People”—the people of Vienna, in his case. In 1925, he founded the Gesellschaft und Wirtschaftsmuseum (Social and Economics Museum), and his exhibitions about social conditions in Vienna consisted of large hand-made charts and diagrams, and models. He understood that it was tiring for museum visitors to stand around studying dense abstract graphics about housing or industrial production. So he developed a way of announcing what his charts were about by adding pictorial elements, while at the same time presenting the statistics in them. Neurath’s effort to make his charts “statistically accountable” was prescient, and should be remembered today by anyone (including me) who includes recognizable pictorial elements in their information graphics. Neurath didn’t want anyone to think he was just making pretty pictures, although he was deliberately using pictures to attract the public’s interest.

In 1925, Marie Reidemeister joined Isotype as the research link between Neurath’s broad-brush ideas and the artists who actually made the end products, most notably Gerd Arntz, who became part of the team in 1928. Marie was the team’s “transformer”—the person who researched and edited the data to best express the stories that Neurath wanted to show his audience.

The Italian archeologist Emmanuel Anati (b.1930) has proposed that early humans learned to identify animal and human tracks in snow. He argued that they learned to “read” before they could write. Neurath used a similar approach when he said that the best way to draw icons of things was to use silhouettes, or profile—side views—of the things being depicted. In the beginning, he even suggested making images by cutting them out of black paper. This forced the artists to keep their images simple. And silhouettes were like footprints, or shadows—“reflections” of reality—documentary evidence, left by the real thing.

Apart from encouraging simplicity when drawing or cutting icons, there were graphic guidelines for the statistical arrangement of the museum’s charts. Today it’s often the surface look of Arntz’s work that’s copied (relentlessly!), while the original principles behind the work is forgotten. (Personally, I think Arntz’s beautiful and humanistic work is a major reason for Isotype remaining influential today, and I completely respect Neurath’s rules for the pictorial arrangement of statistics.)

The guidelines are detailed in Neurath’s “International Picture Language,” published in 1936. The book is written in Basic English. This is a list of 850 words (an average dictionary has about 25,000) and rules for using them, compiled by C.K. Ogden, published in 1930. Basic was intended to simplify English and teach the language to non-speakers. Both Neurath and Ogden were on the same track: ease of communication across all languages.

The main Isotype guidelines

  • Instead of using the length of abstract bars to denote quantities, Neurath used small pictorial icons of the commodities (or people) being charted. All icons in a chart, whatever they were depicting, were drawn to be the same height and width (and visual weight), so that when lined up in rows, one row of icons does not visually outweigh the others. Neurath’s desire to make his charts “statisically accountable” meant that you can not only see the subject of the charts (by seeing the pictorial icons), but you could count the icons and know the quantity indicated. All the icons had to be visually balanced so that your eye didn’t “favor” one row over the others.
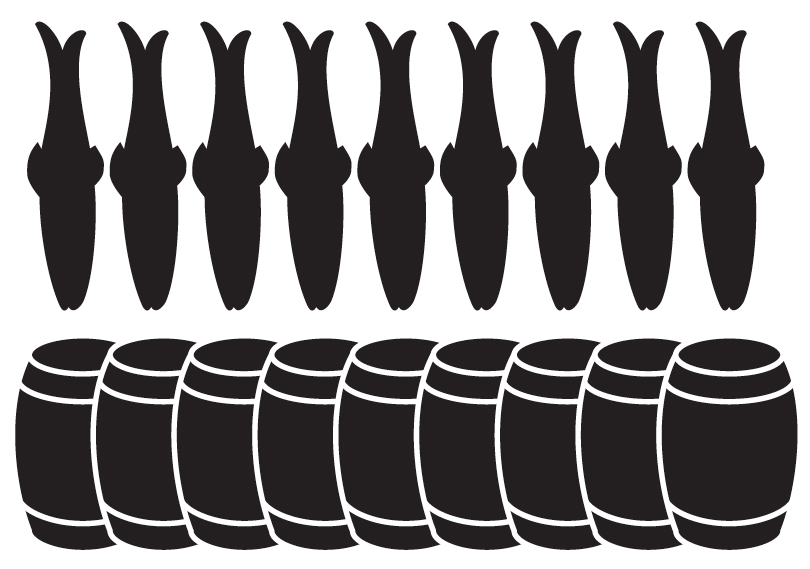
  • Perhaps the most important guideline is that a greater quantity of something (traditionally shown by a longer bar) should be represented by a greater number of icons, not by enlarging them.
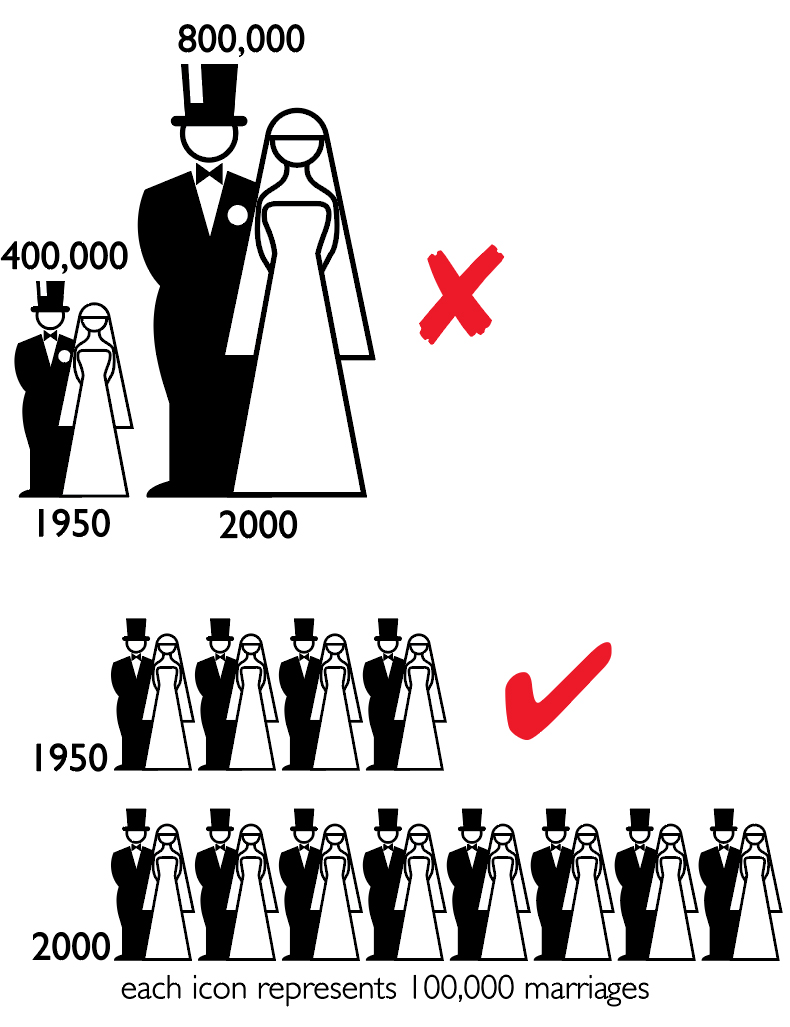
  • For very large numbers, one icon could stand for many. Thus, if the legend on a chart said “one sign stands for 1 million,” then two icons represented 2 million, and so on. (Neurath, limited by Basic English, had to use the word “sign” for “icon.”)
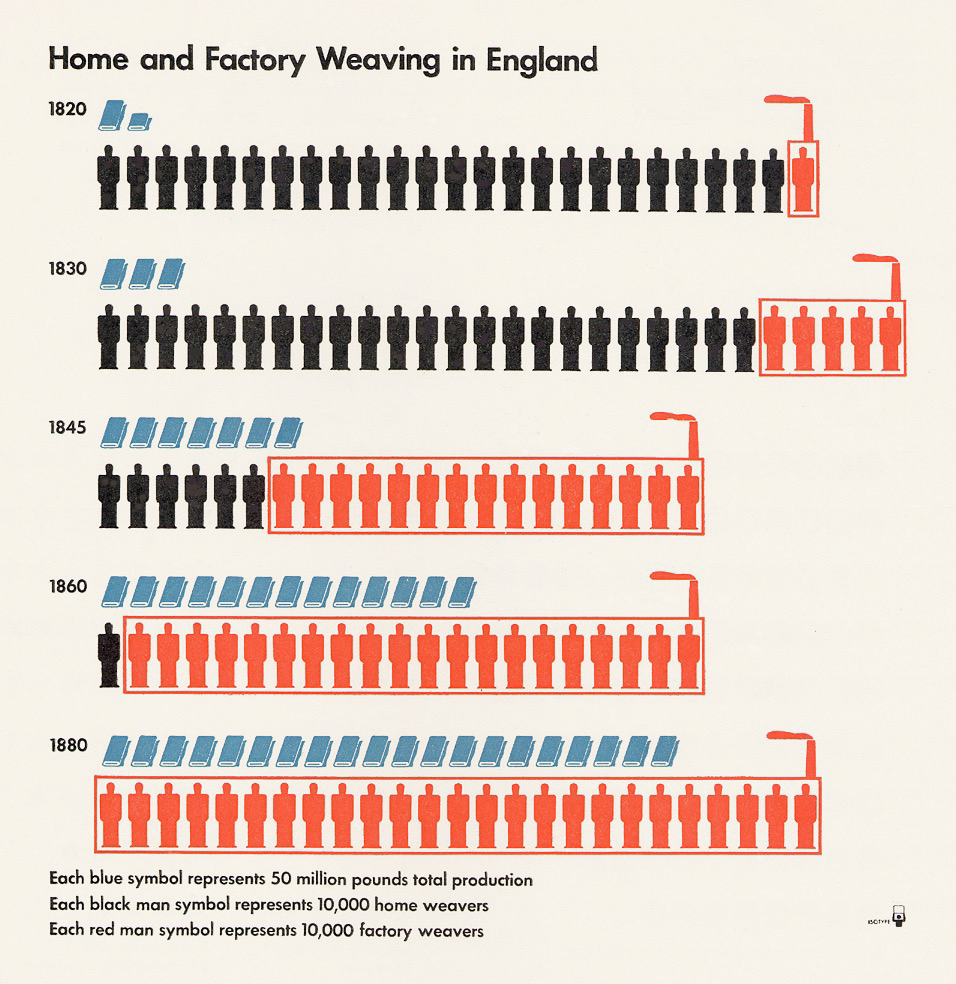
  • Where possible, use a horizontal arrangement of icons rather than a vertical one.
  • Circles of different sizes are not good ways to show different quantities.
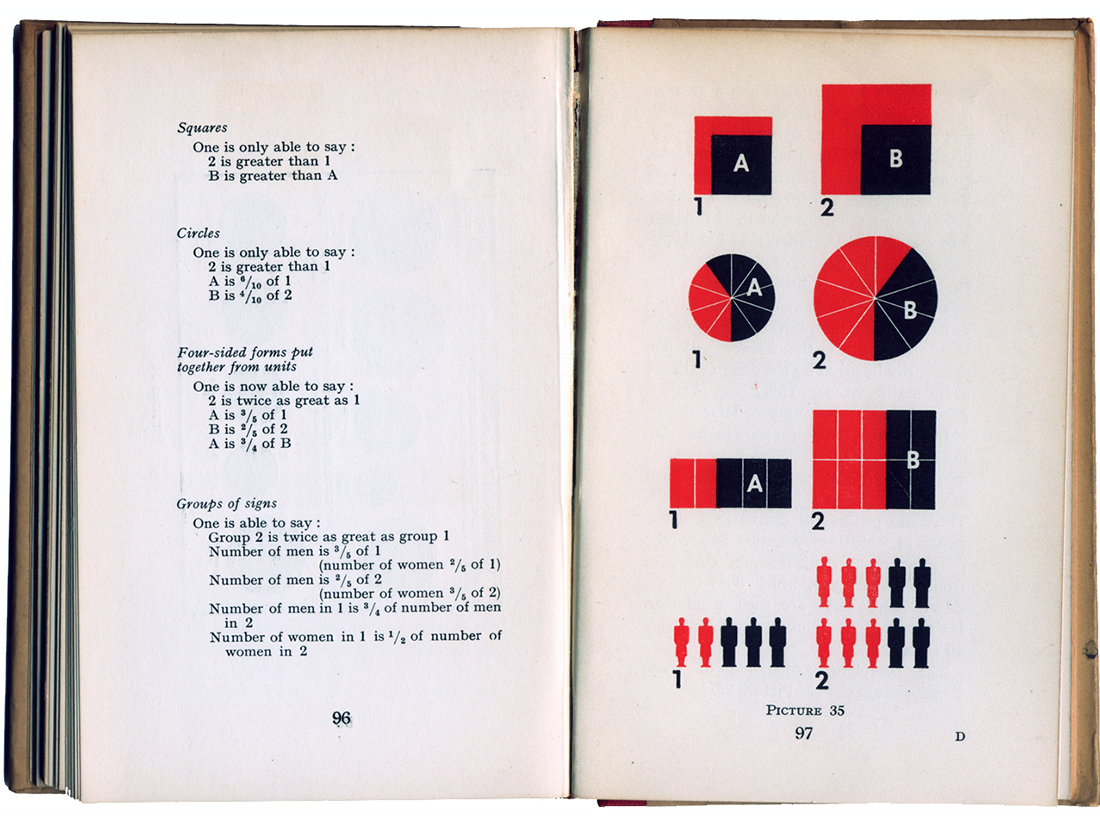
  • Many line, or fever, charts contain information that is useless, or misleading: the slopes between the plot points are just joining up the points, but contain no information. Bar charts are a truer representation of the data.
  • Other guidelines were about the use of color. Neurath advised a severely restricted use. (During his working life, he often had to do this for many projects, because only black and red were available.) It’s still good advice today, at least at the start of a project, even if there’s no limit to the colors ultimately available. For Neurath, color was strictly used for information, not decoration.

Robin Kinross, author (together with Marie Neurath, who died in 1986) of “The transformer: principles of making Isotope charts” (2009), notes that Isotype guidelines really were guidelines more than rules, and that the team approached each job with them in mind, and that “the principles were continually affected by the challenge of new tasks.” Kinross adds that the overall point of Otto Neurath’s Isotype was “to make something intelligible and interesting.” That’s a principle that should drive all information graphics and data visualizations.

Worth reading:

“International Picture Language,” by Otto Neurath. 1936

“Modern Man in the Making. 1939

“From Heiroglyphics to Isotype, a visual autobiography,” 2010 (Left unpublished at Neurath’s death in 1945.)

“The transformer: principles of making Isotype charts,” by Marie Neurath and Robin Kinross. 2009

“Gerd Arntz, graphic designer,” by Ed Annink and Max Bruisma. 2010


Next Monday, the final part of this series: Emojis and beyond.

Animated

INFOGRAPHIC GIFS.

Although gratuitous motion in infographics has come in for a lot of criticism, it’s still true that animation can be very effective in a visual explanation. Here are a few examples that succeed in terms of grabbing our attention, and explaining something.

Engage our audience. Fun, humor, a little showbiz. I’m fine with all that, as long as we are clearly communicating some information.

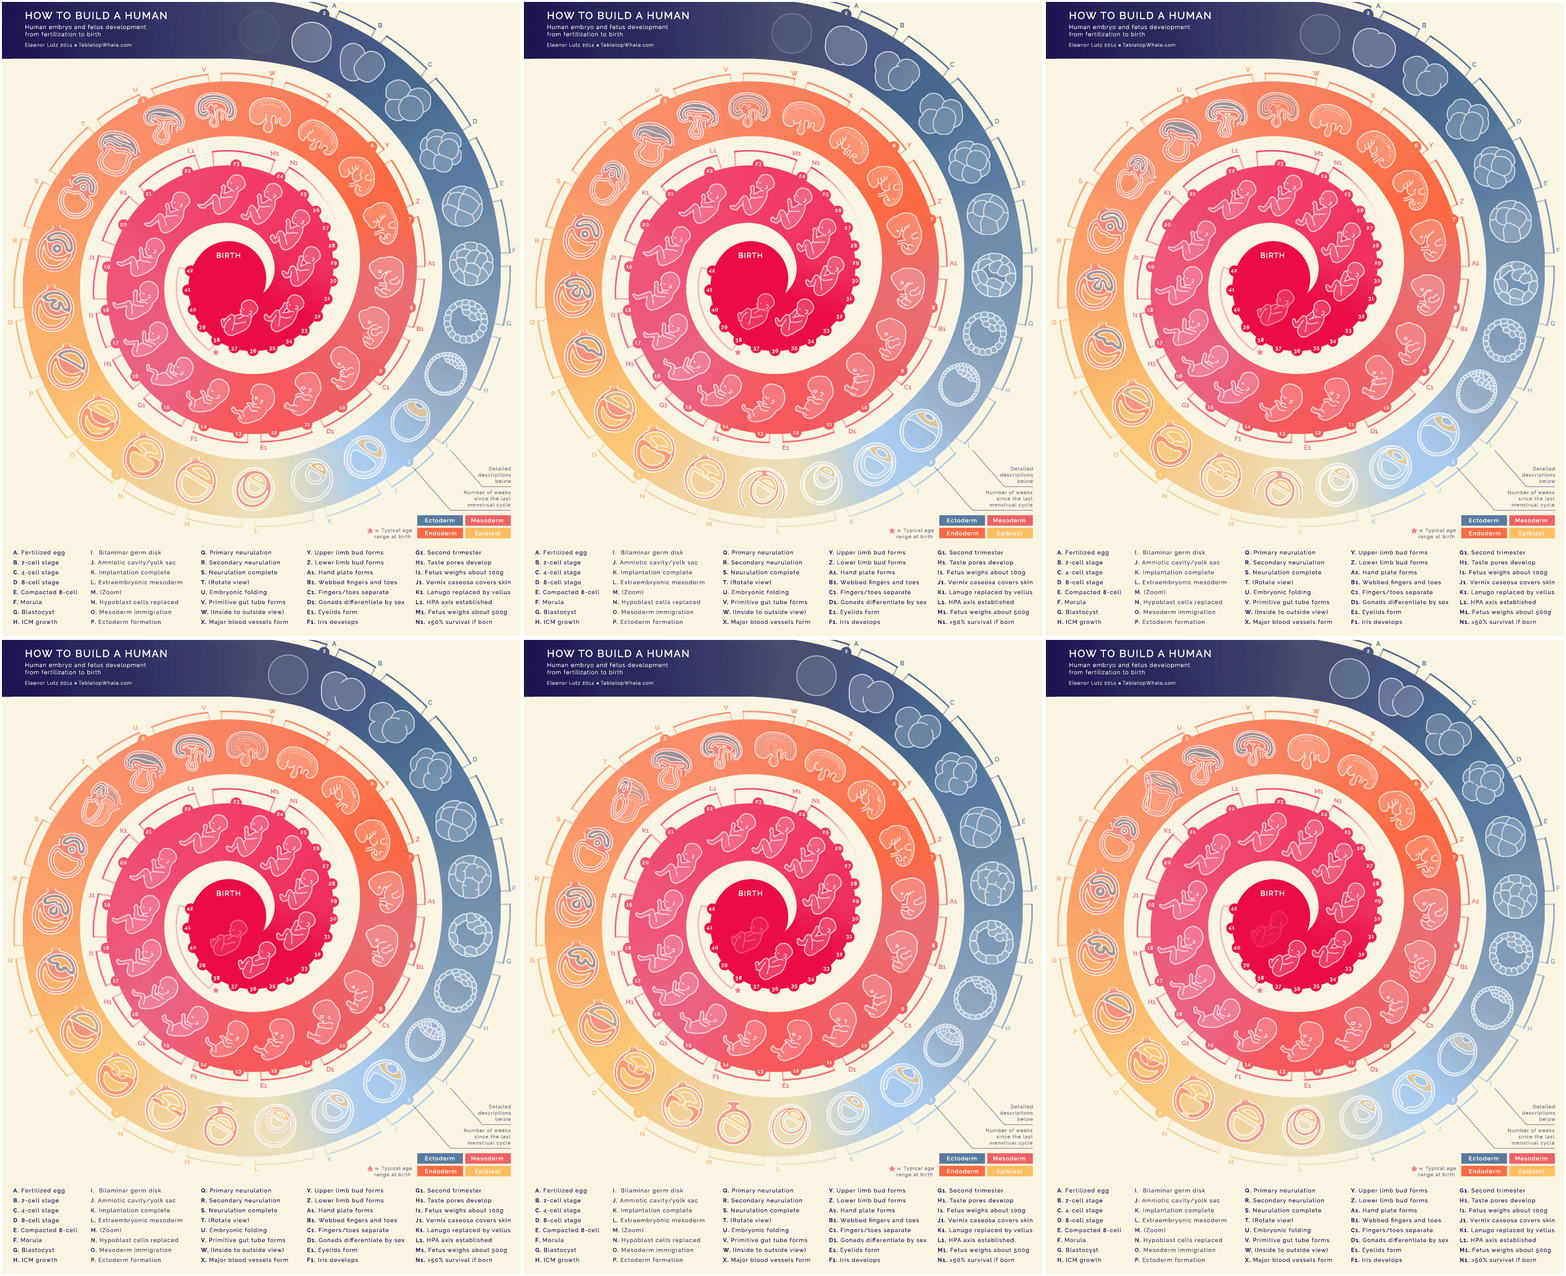
Above: From egg to baby, by Eleanor Lutz. (There are only nine frames in this file.) This was in my very first post, about the history of infographics, as an example of the current era. (https://www.johngrimwade.com/blog/2016/08/22/this-blog-started-35000-years-ago/)

See more of Eleanor’s work here: http://tabletopwhale.com

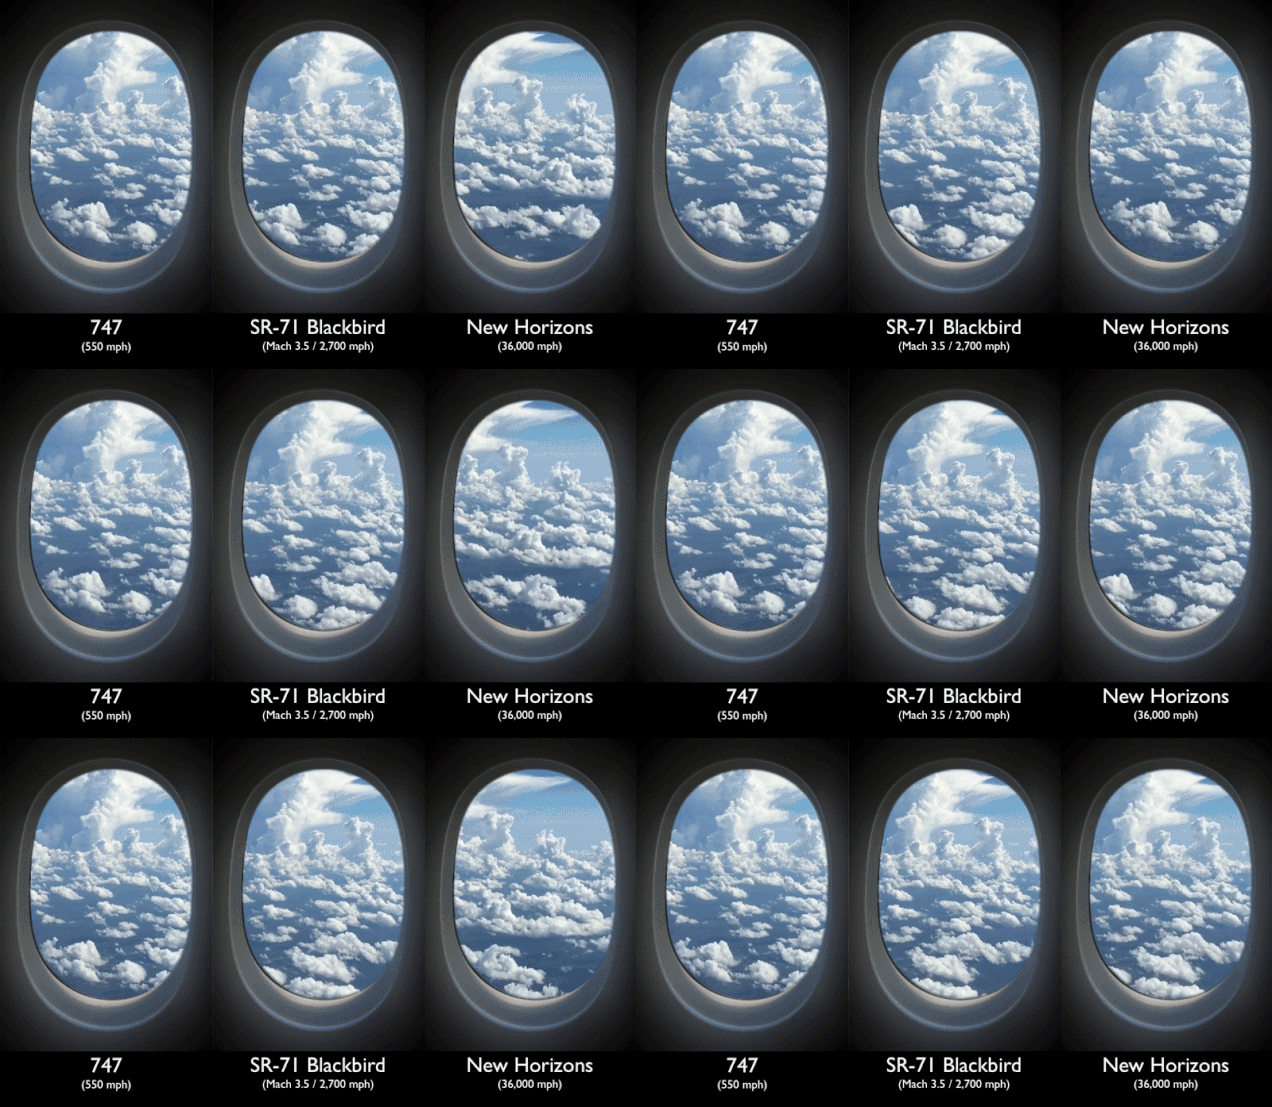
Below: How fast does a spacecraft travel? Clay Bavor puts that incredible speed into a context that works for us all.

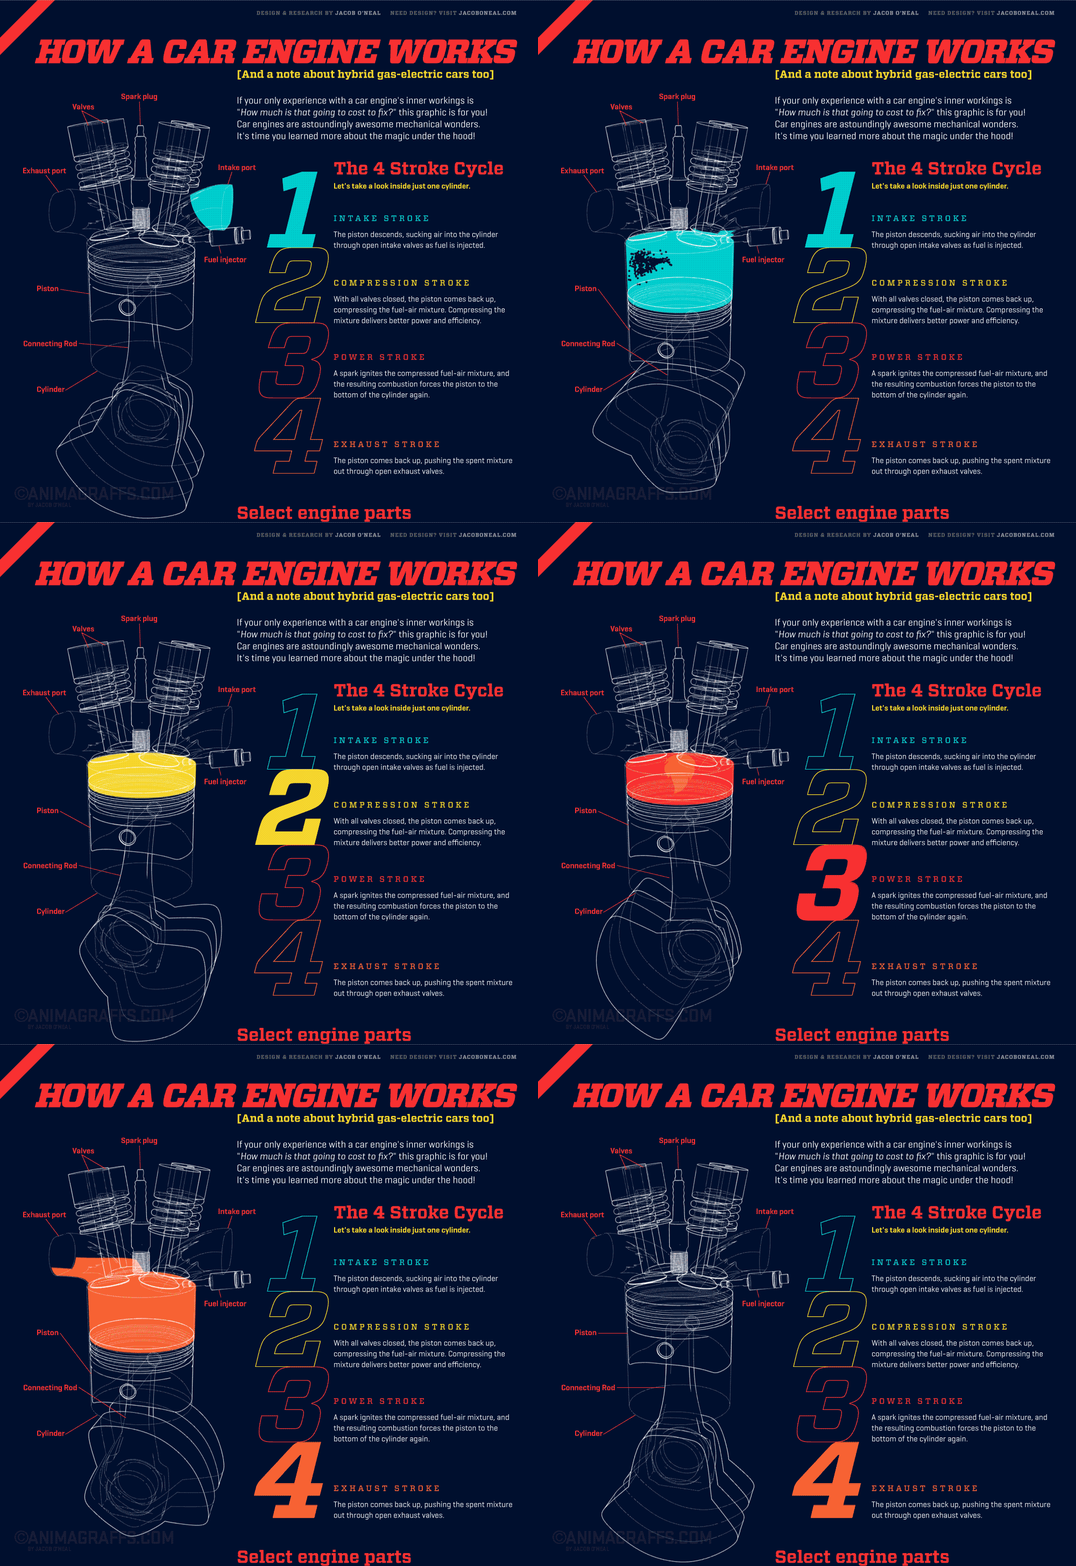
Engine combustion by Jacob O’Neill. See the whole graphic here: http://animagraffs.com/how-a-car-engine-works/

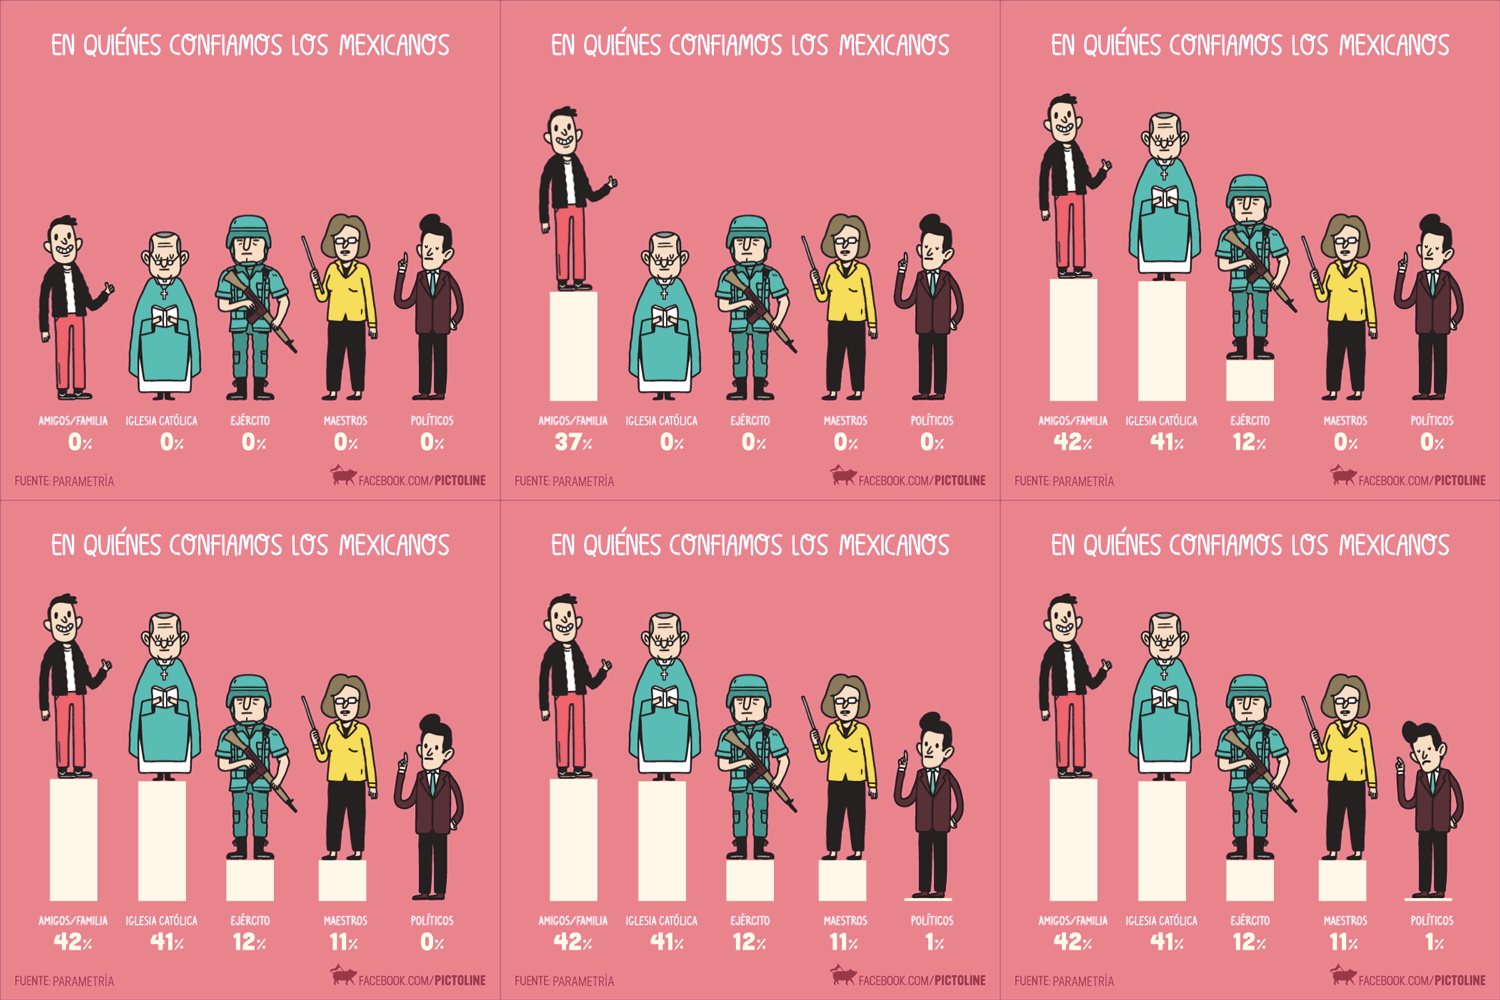
Who do Mexicans trust? By Pictoline: http://pictoline.com

More rubbish

INFOGRAPHICS THAT WENT WRONG.

I am finding far too many of these badly-conceived graphics in my collection. I could delete the files and pretend that I didn’t create them (“What food chart?”), or post the examples here and hope there is something positive that can be taken from them. We all learn from our mistakes, and I encourage my students to be adventurous, even if potential failure lurks in the shadows.

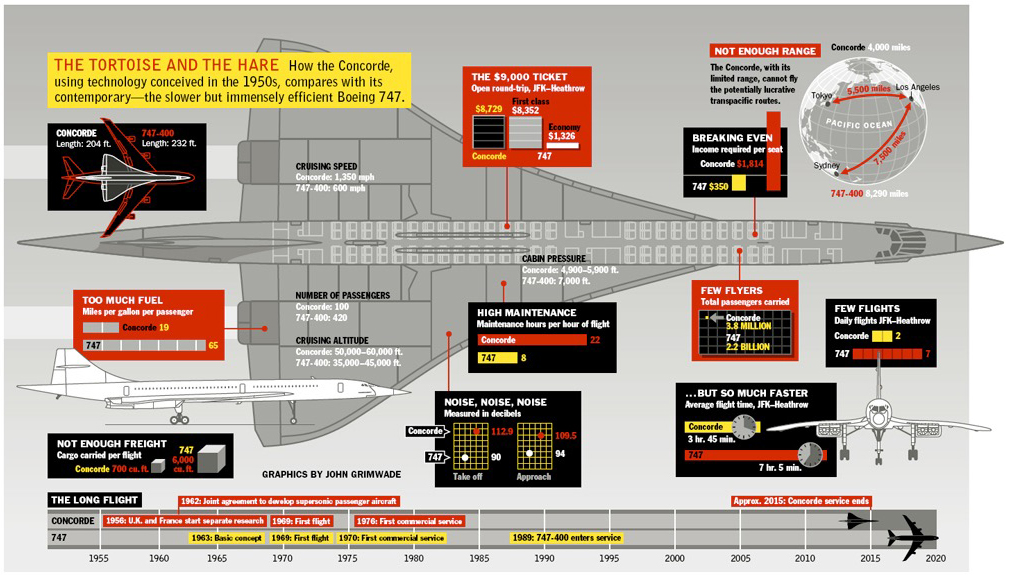
Concorde confusion Questions: Why does the color used for Concorde and the 747 keep switching around? Was my medication wrongly prescribed? There is an interesting use of boxes as well. I have trouble believing that I am responsible for this one. On second thoughts, it must have been done by someone else. Well, that’s a relief.

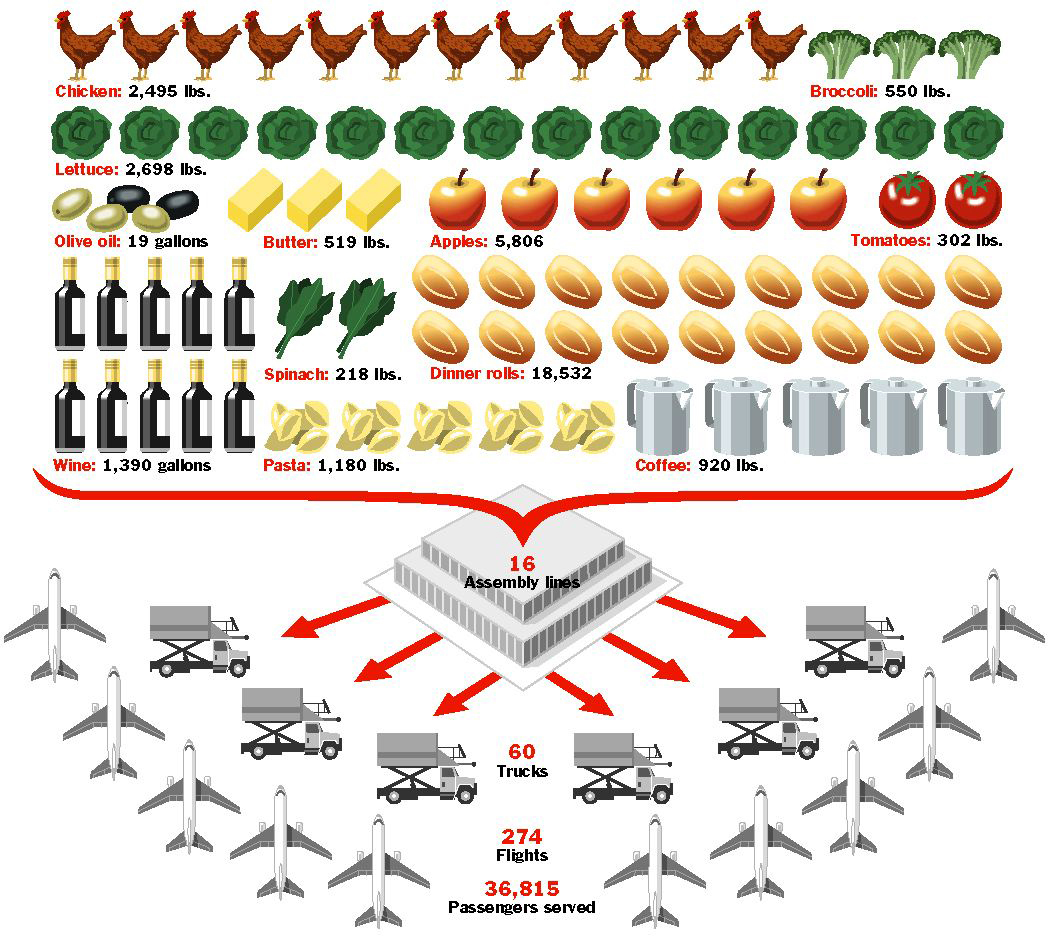
Catering nonsense There is, believe it or not, an underlying logic to the chart below. I wrote it all out on a piece of paper, so there must be. One chicken represents 200 lbs. One apple equals 6,000. (What?) These items cannot be compared, and it doesn’t make any sense as a chart. This is complete crap. Memo to curriculum committee: Do not let this person teach data visualization.

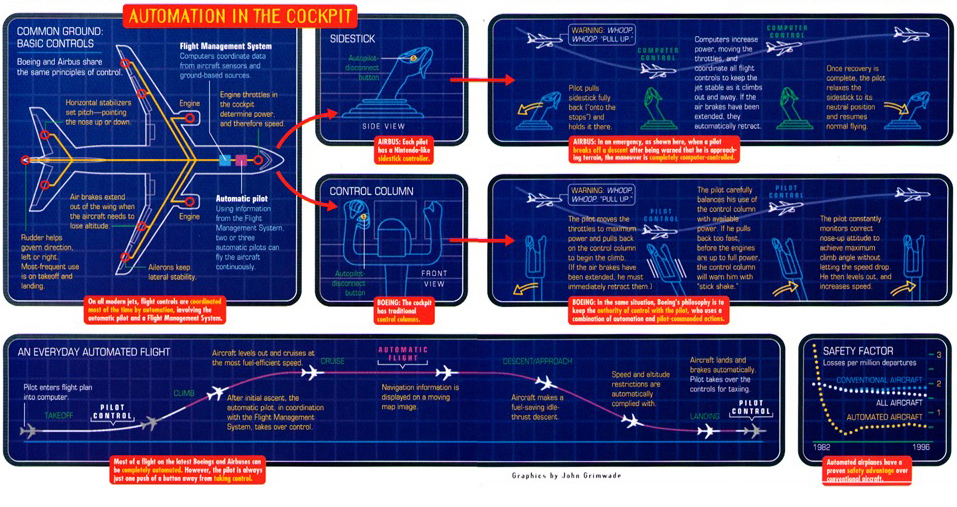
Styling takes over The next infographic (might be the wrong name for it) apparently explains and compares the cockpit systems of Airbus and Boeing. It’s a very poor graphic, but a very fine example of a heavy-handed stylistic idea ruining an explanation.

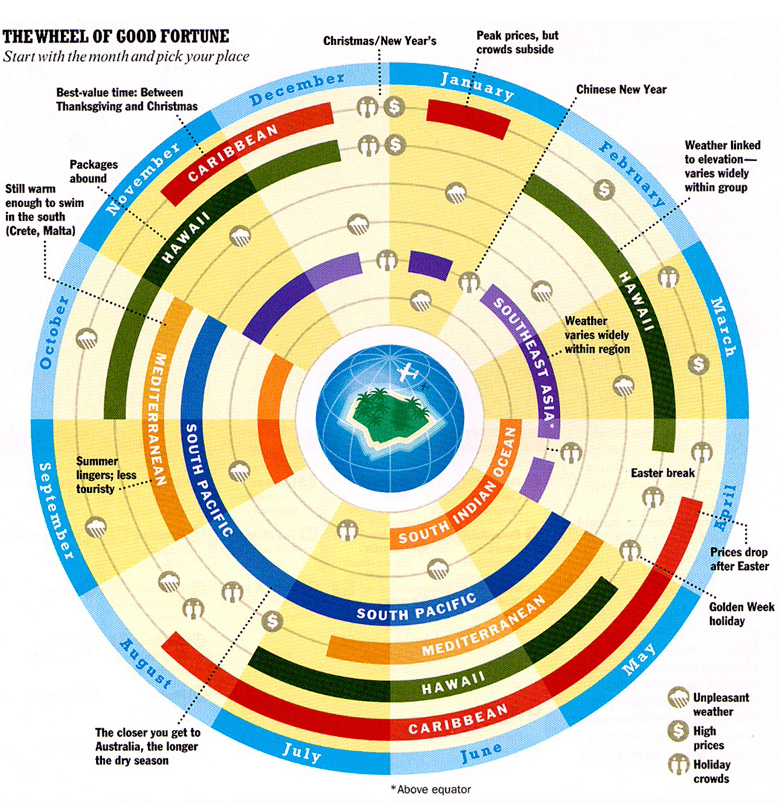
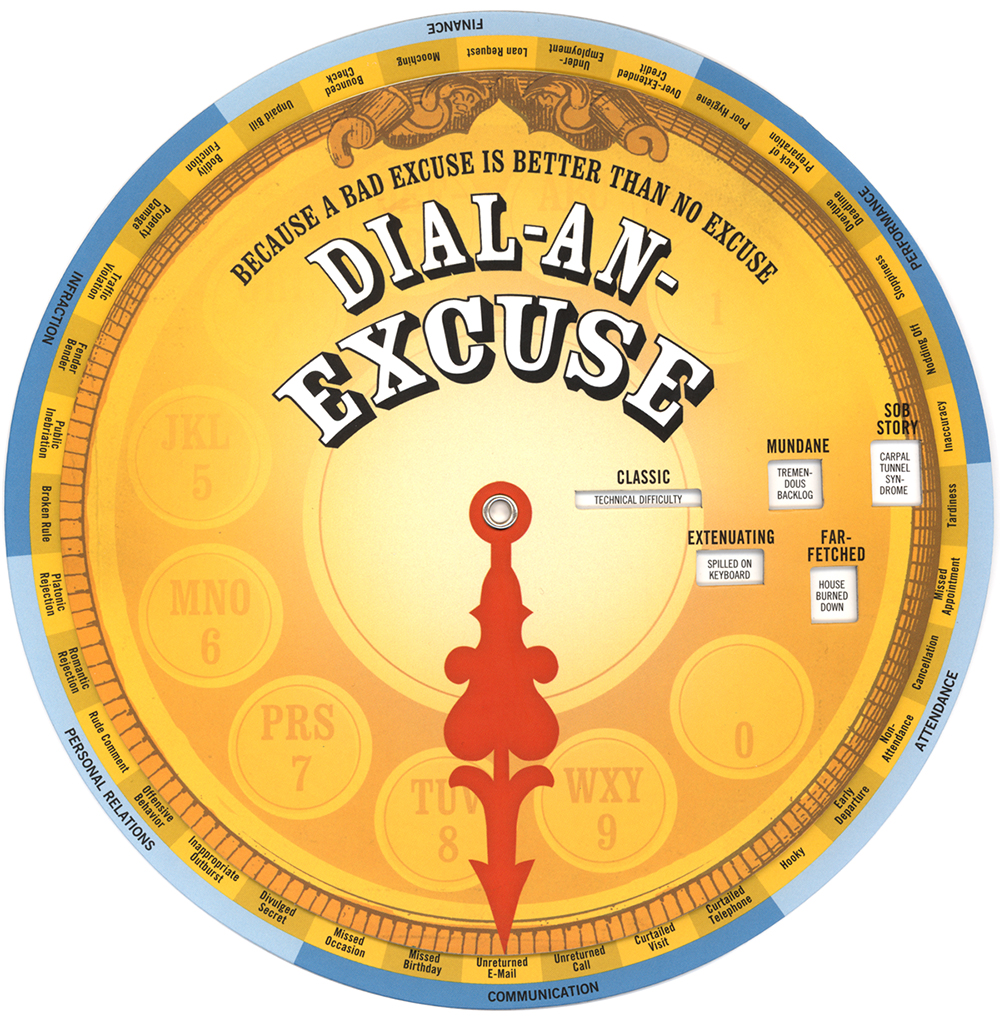
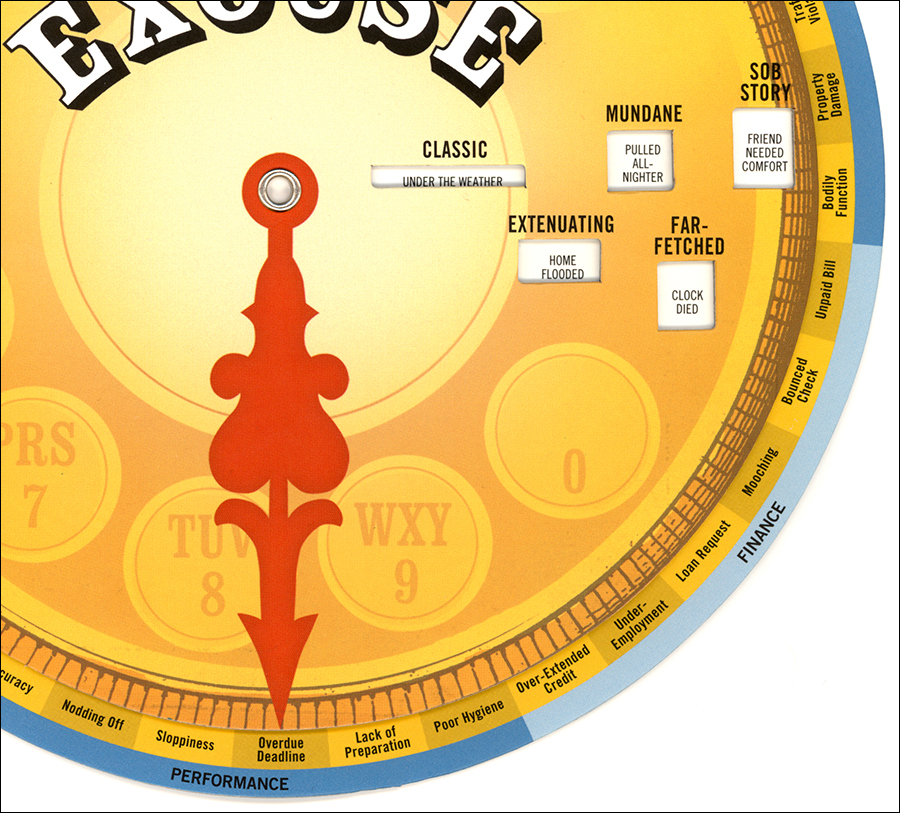
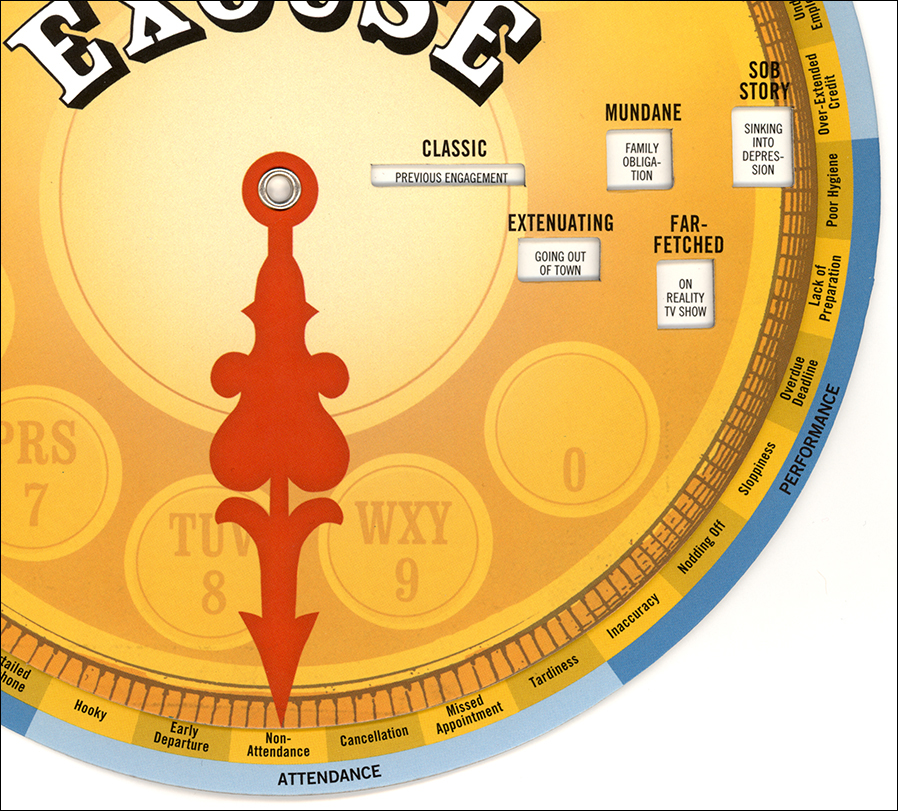
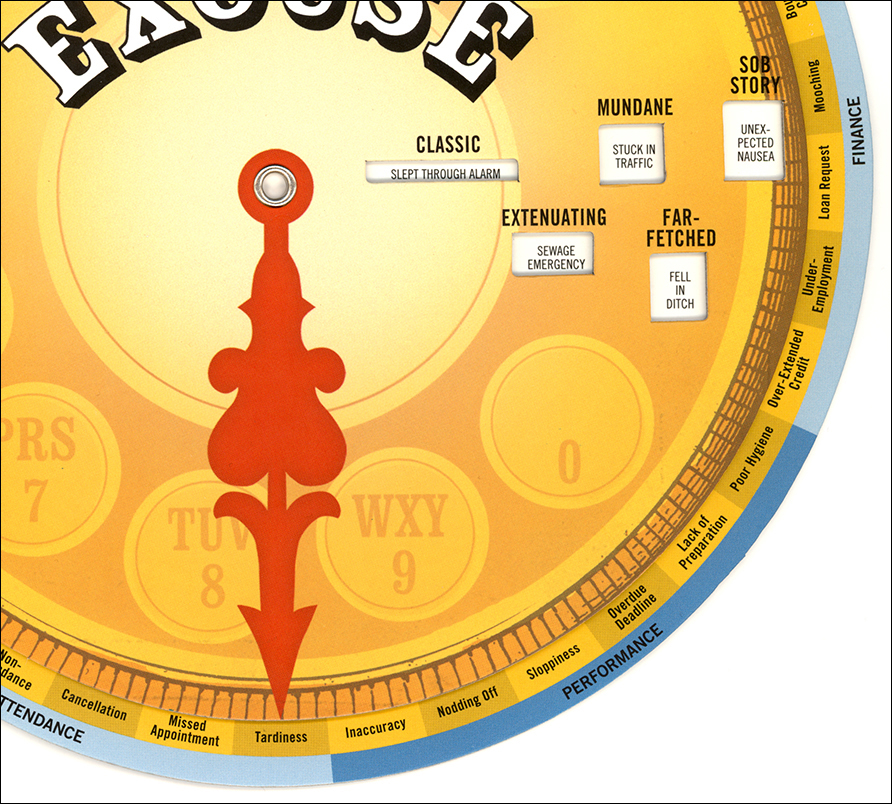
NO That’s my only comment on this wheel thing.


Wheel of excuses

EXPLAINING AWAY VARIOUS PROBLEMS.

In 2017, dialing up some useful excuses could come in handy for freelancers, professors, students, and everyone else. I’ve often needed something creative to calm down an anxious client. Unfortunately, this wheel doesn’t seem to be available right now (except perhaps on eBay), but when it reappears, you might want to get one. No batteries required.
 

CARDBOARD INTERACTIVES (PART 2)

On a more serious note, this is the second part of a wheel charts post that I ran last week. The first part is here: https://www.johngrimwade.com/blog/2016/12/26/cardboard-interactives/
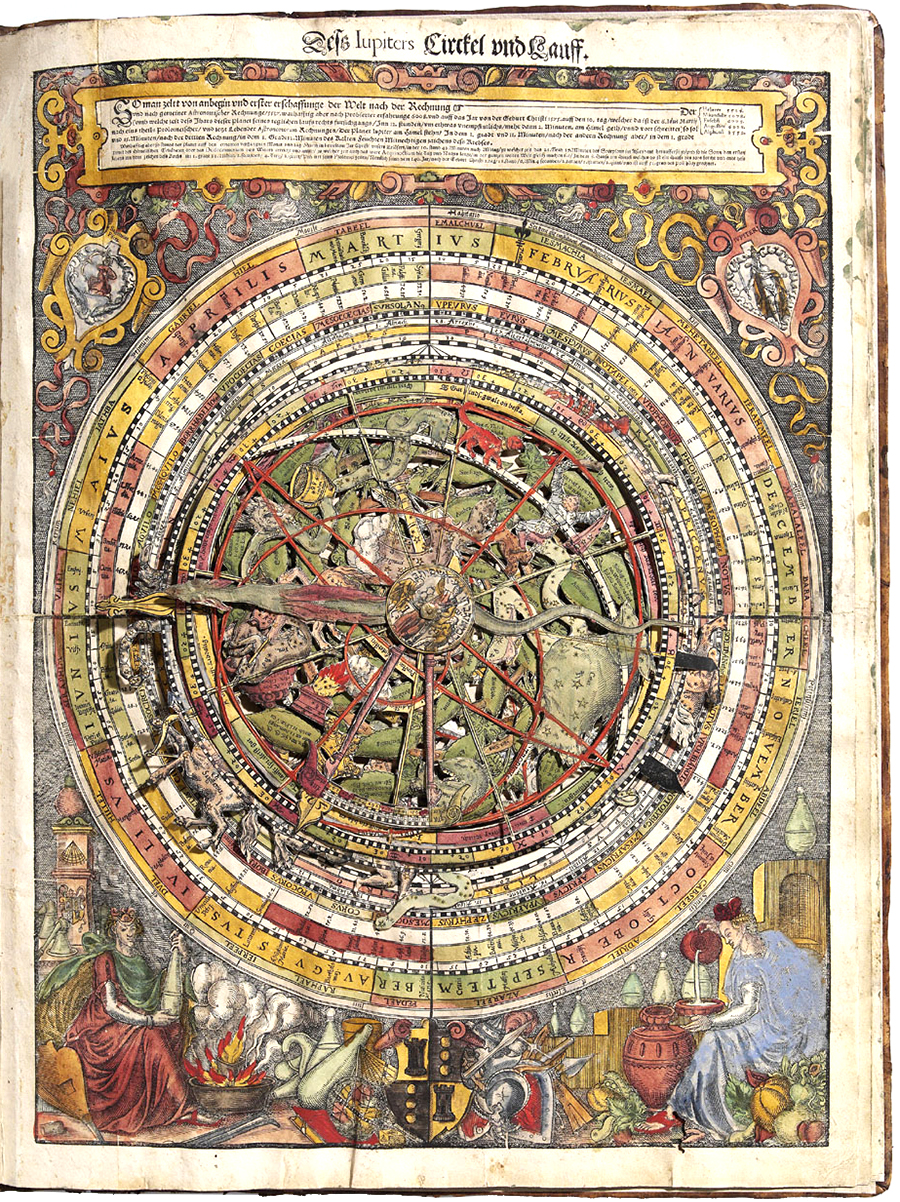
An astrolabe (astronomical calculator) from 1575.

A question of scale

SHOWING INFORMATION LARGE ENOUGH SO THAT WE CAN SEE IT.

I’ve been caught in this dilemma on numerous occasions, so I’m not pretending that I know the answer. It’s an issue as old as infographics itself. Perhaps there is no answer. Anyway, here are some examples that show the effect of using a reasonably-sized symbol to mark something that is really small.

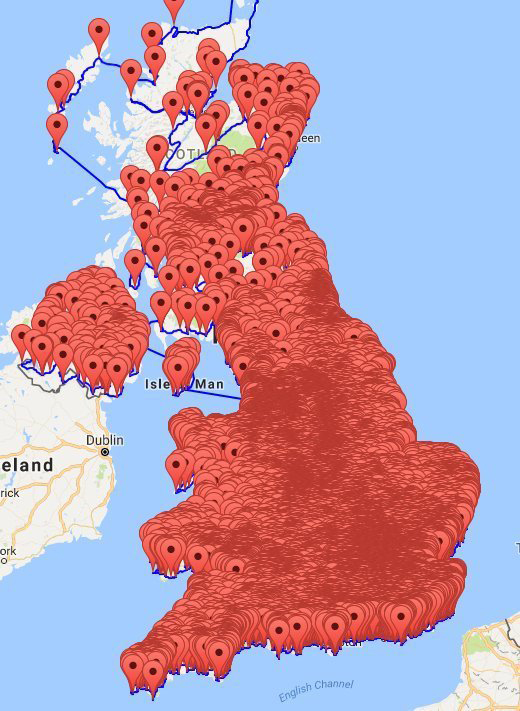
PUB LAND This was going round on social media recently. A group of mathematicians plotted a shortest-distance tour of 25,000 British pubs, as a project. It’s a lot of fun (and that’s the point here), but it demonstrates what happens when you put a pointer at every location. It’s correct in terms of GPS coordinates, but the visual impression is greatly exaggerated. Britain has a lot of pubs, that is true, but it’s not a solid mass of pubs with no space between them. (Image: University of Waterloo, Canada)


AIR TRAFFIC There are thousands of flights in the air over the U.S. at any one moment. However, the visual impression of the density of that traffic depends on the size of the aircraft icon used. The bigger the symbol, the more crowded the airspace becomes. In a satellite photo, they would not be visible, although that’s not much use as an informational graphic. (Image: ATCSCC)


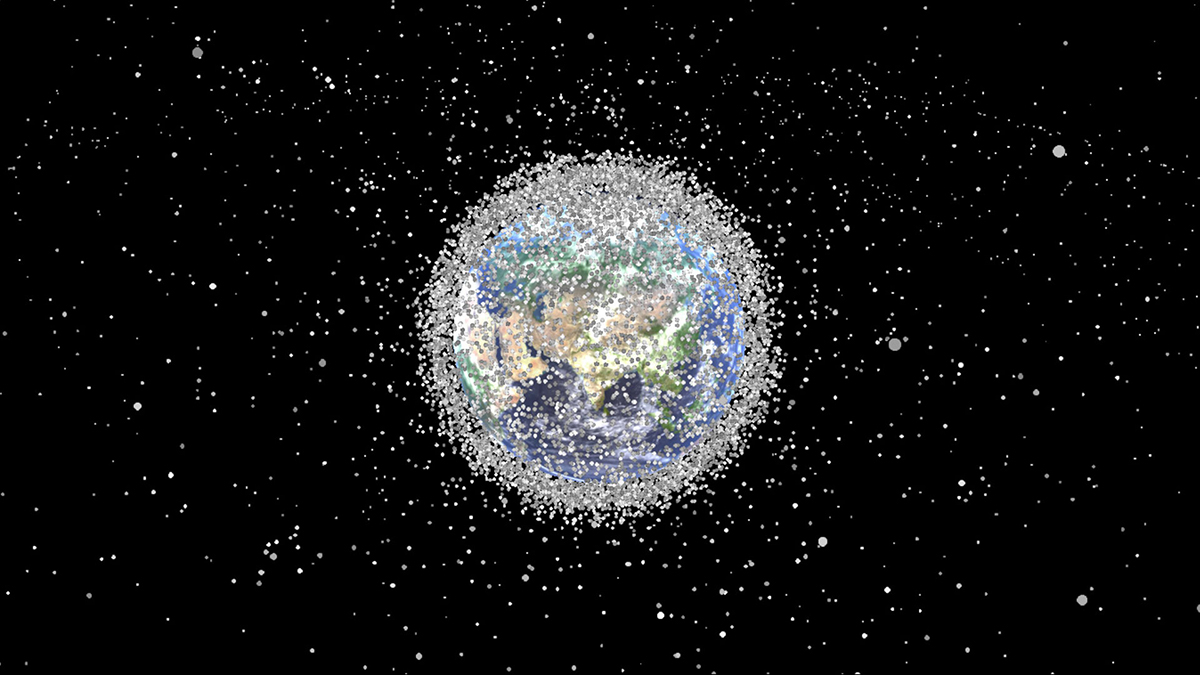
SPACE JUNK There’s a lot of junk orbiting the Earth, but there’s a lot of space between it too. You wouldn’t see any of it at all from this viewpoint. Here it looks like aliens can’t avoid banging into an old satellite as they maneuver their plasma-powered spacecraft in for a first contact landing. (Image: NASA)


GALAXY The ultimate example. It contains billions of stars, but the distances are so great compared to the size of the stars that two galaxies could pass through each other without any of the objects colliding. Of course, here we’re looking at light from stars, dust and gas. We’re not seeing the scale of individual stars at all. They are mostly blurred together into a smooth distribution of light at this resolution. The bluish-white dots that we can see are individual stars that are much more luminous than the Sun. By the way, this is the Andromeda galaxy, and it will collide with our own Milky Way in several billion years time. (Image: NASA)

Thanks to Ryan Chornock, a professor in the Department of Physics & Astronomy at Ohio University, for help with the space examples.


Cardboard interactives

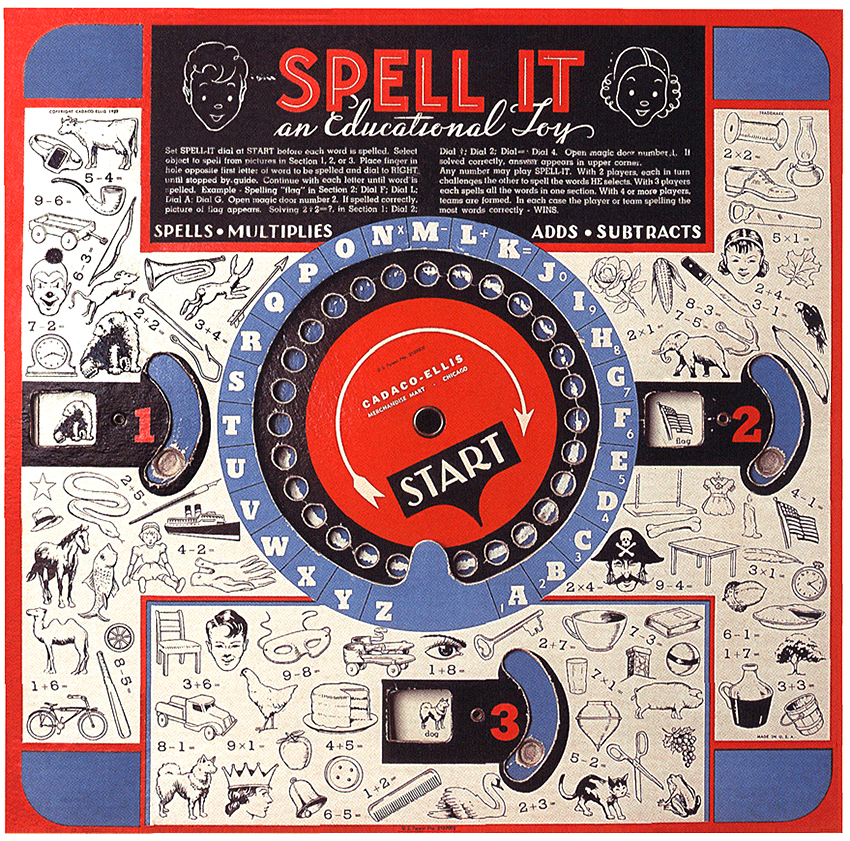
BEFORE THE INTERNET, WE HAD ROTATING INFORMATION INTERFACES.

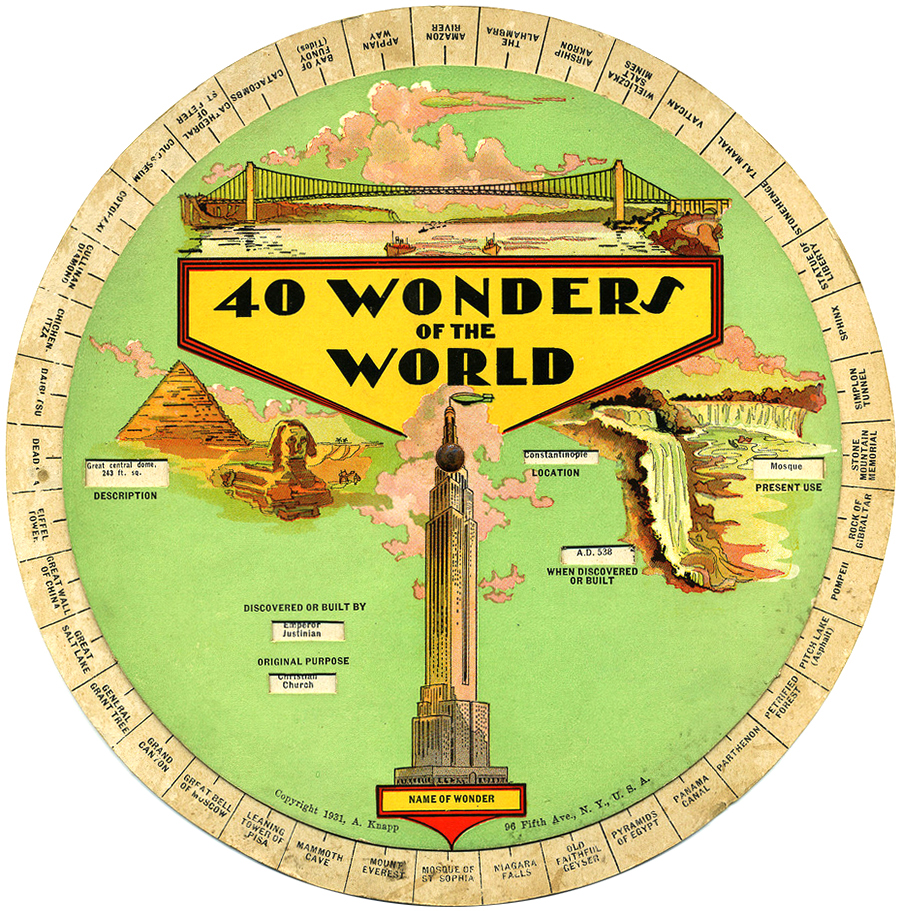
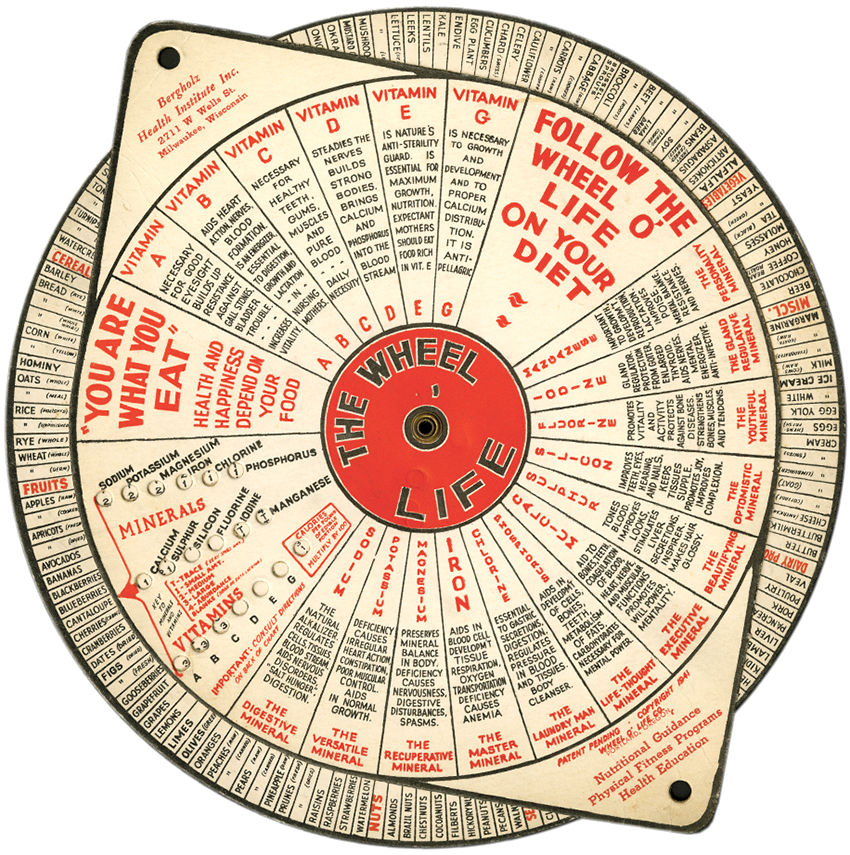
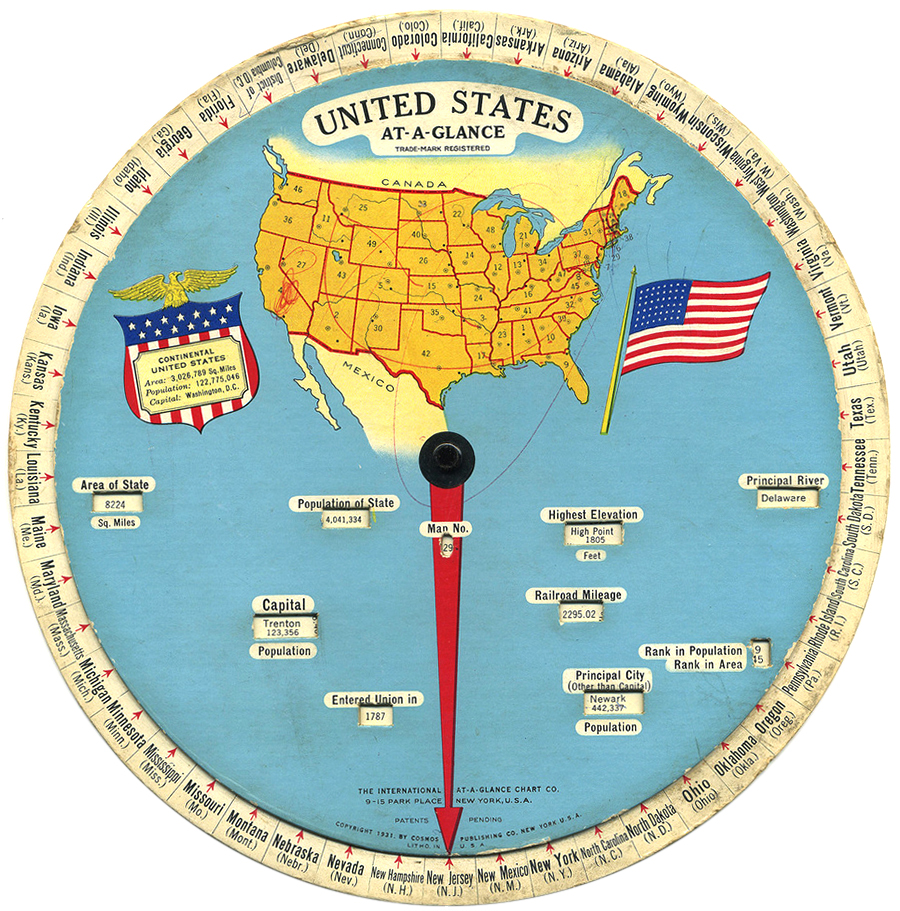
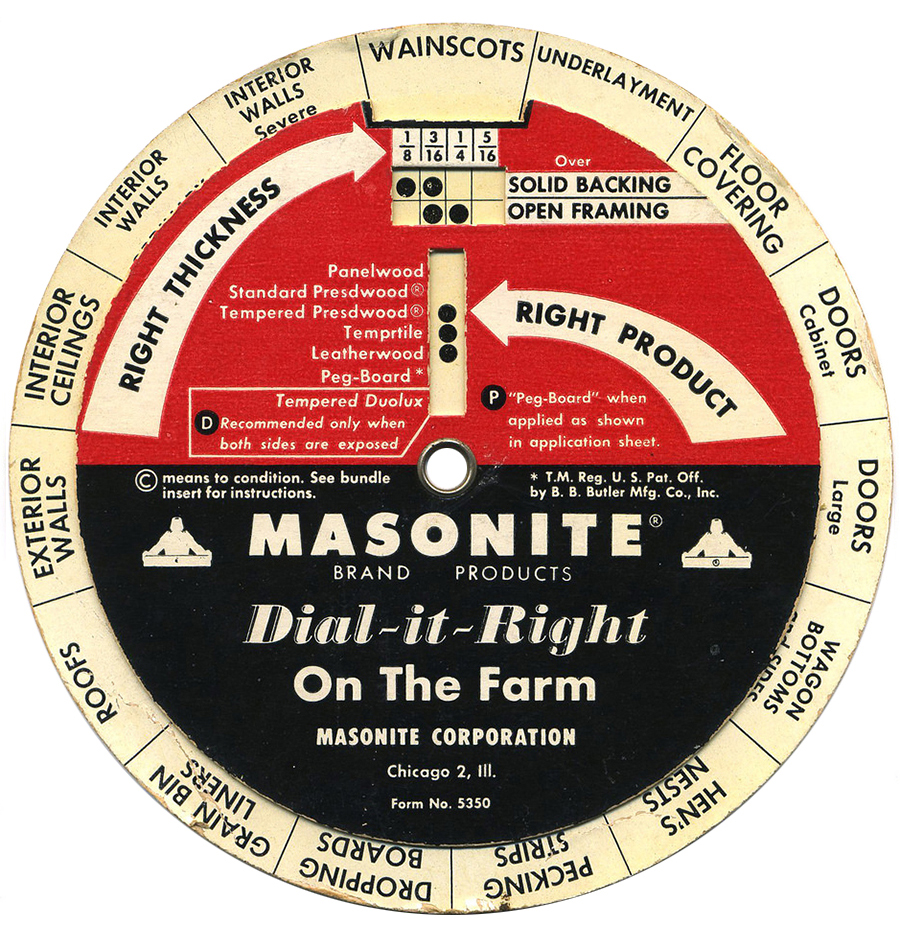
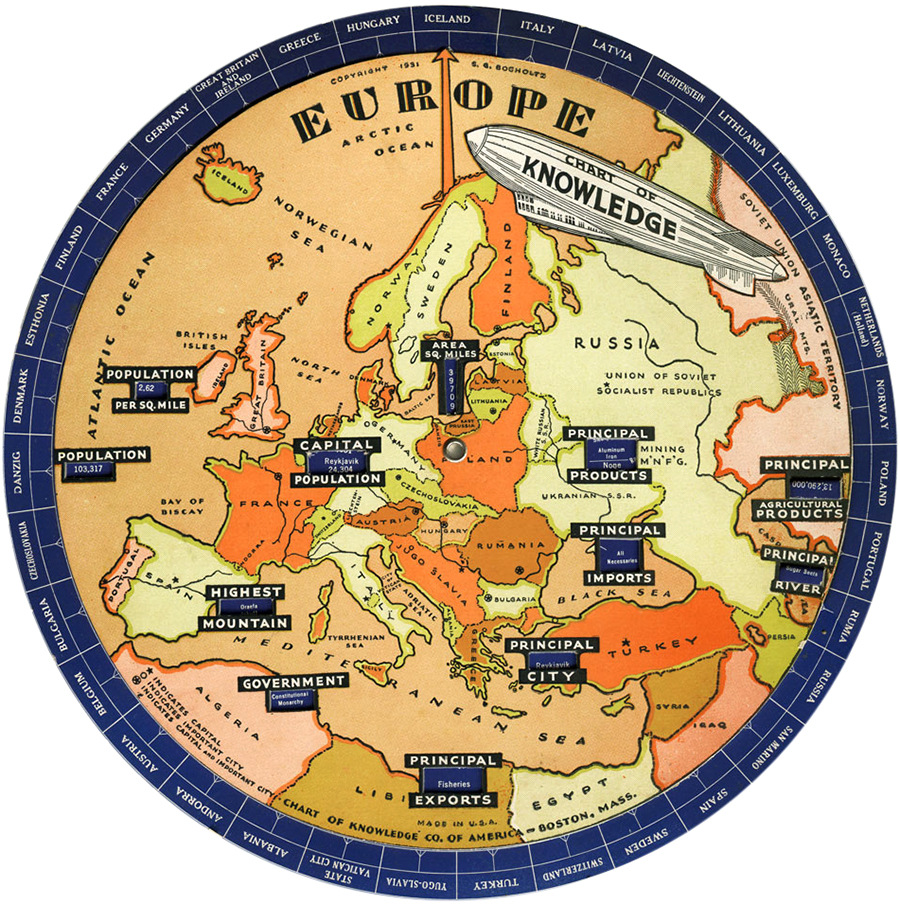
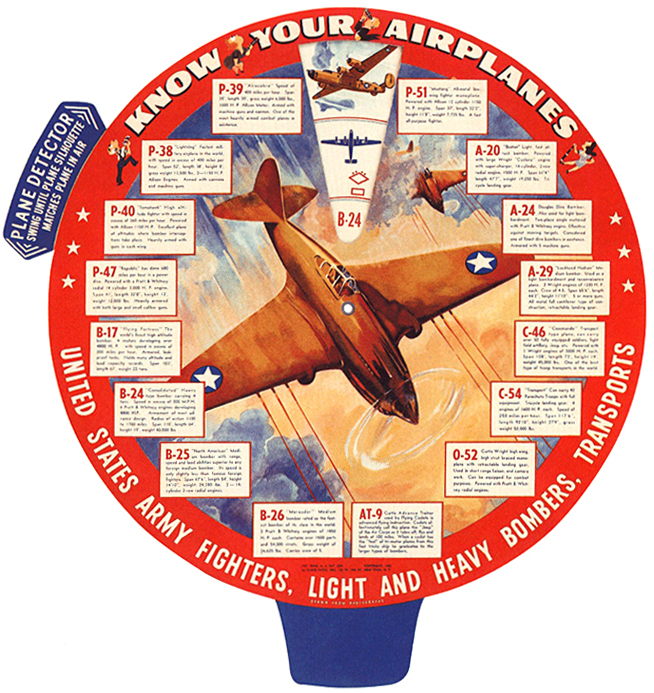
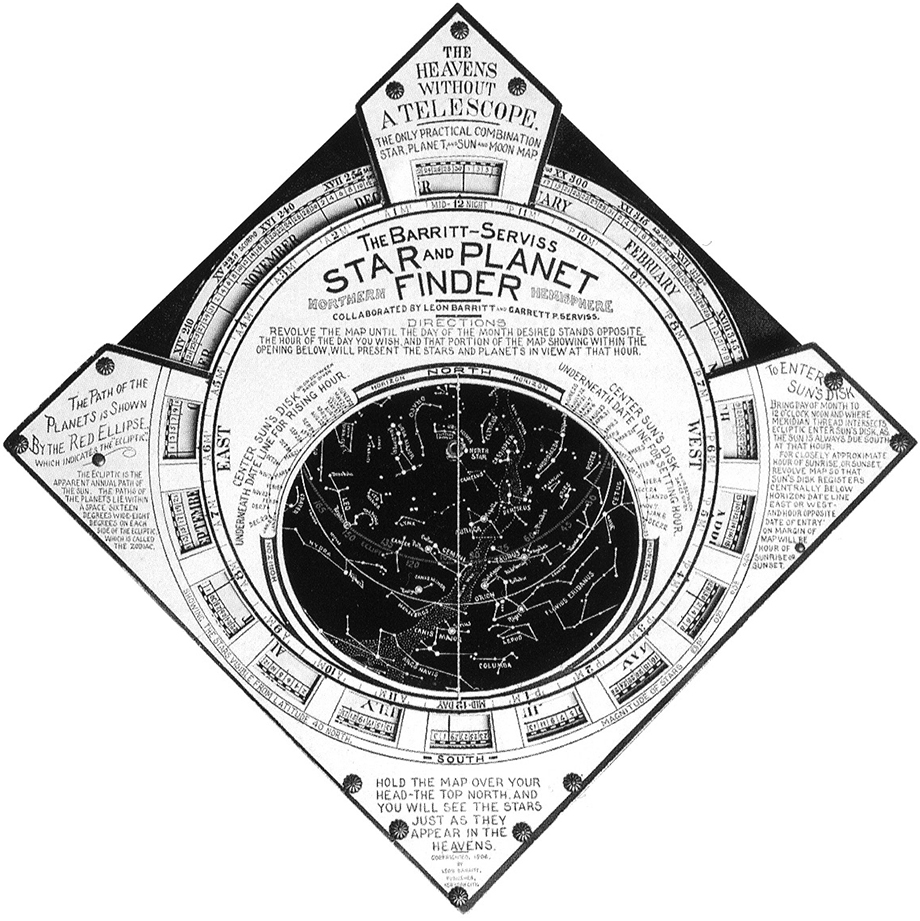
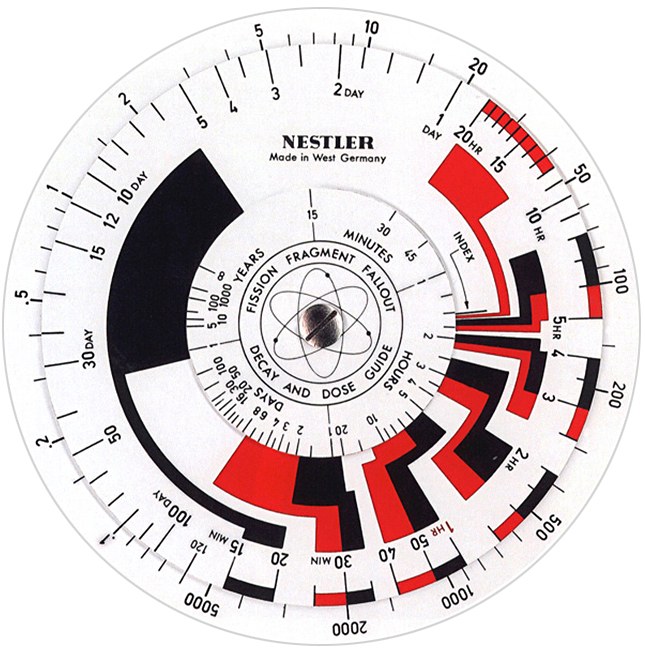
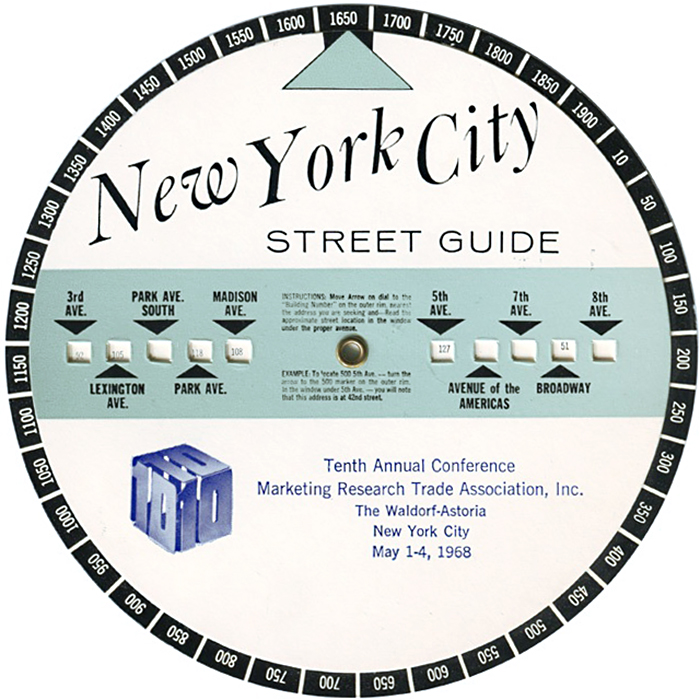
Long before online interactivity, there were rotating wheels (known as wheel charts, or volvelles). They often contained a lot of information and delivered it in small, user-controlled amounts. Isn’t that exactly what we’re trying to do today? There are several examples in Jessica Helfand’s excellent book “Wheels of Invention”: goo.gl/QrLZNx

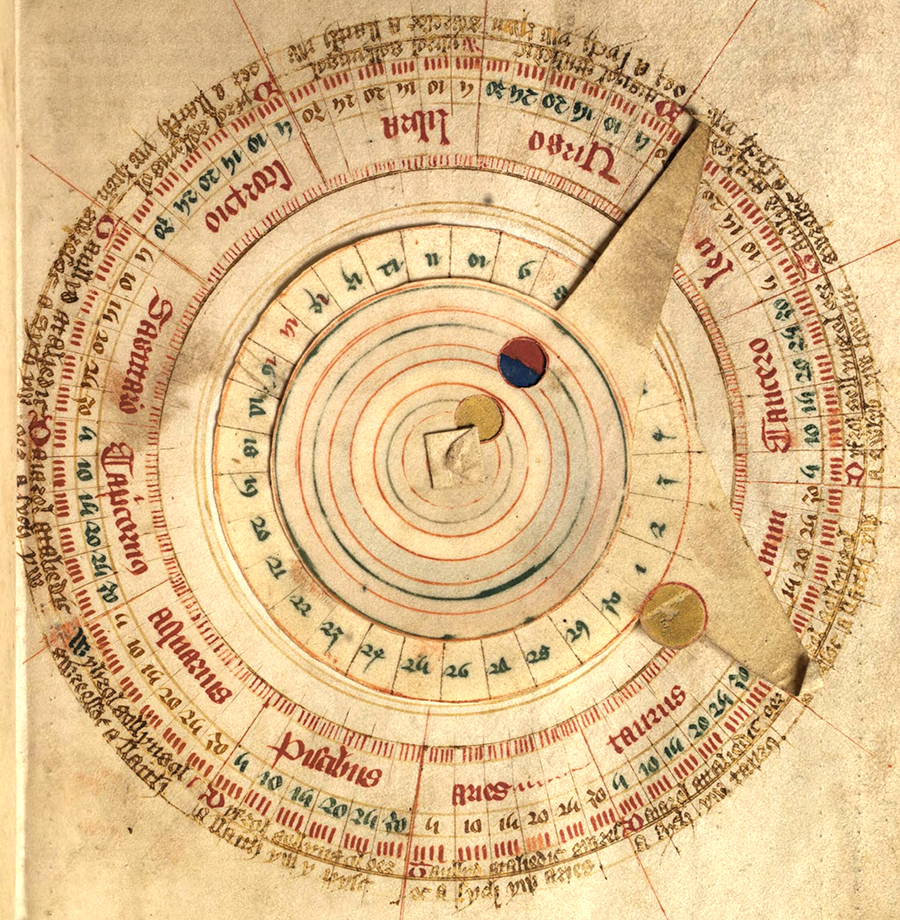
HISTORY

Wheel charts have been around a very long time. This one, from the 15th-century, is for determining the position of the Sun and the Moon in the zodiac.

(National Library of Wales)


Solar modeling

VISUALIZING THE SCALE OF OUR PLANETARY NEIGHBORHOOD.

garden_sun

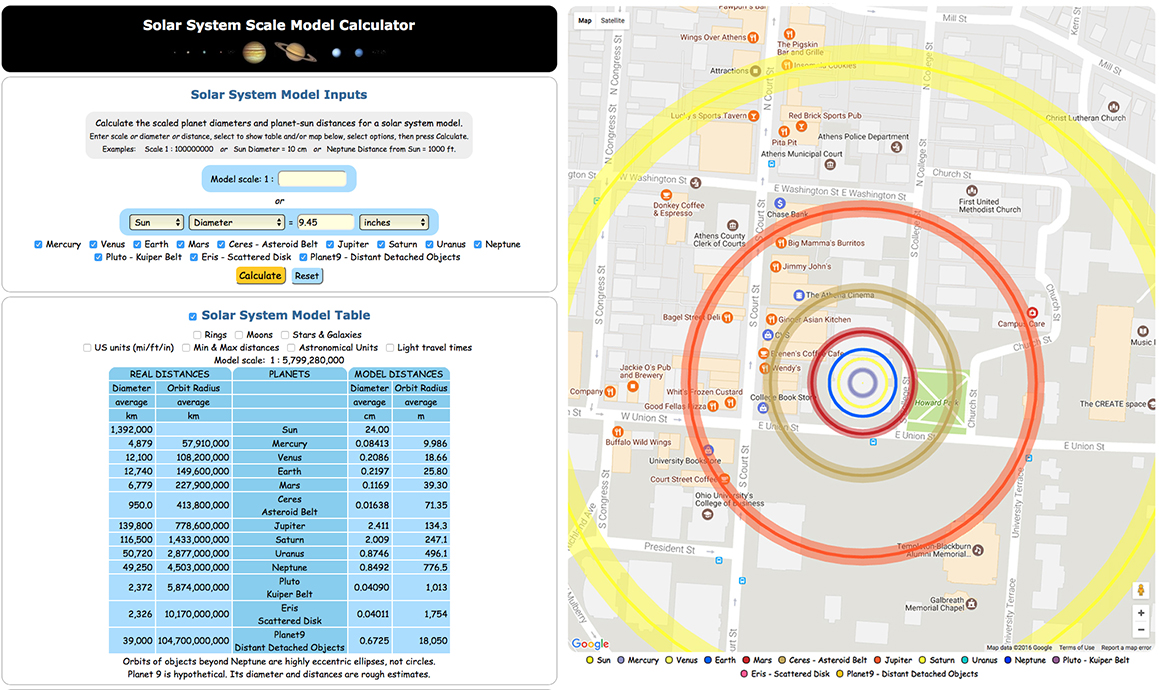
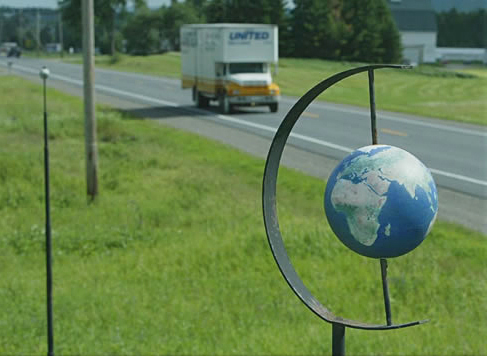
When I glue a basketball to the top of a pole in my garden, and tell people that it’s the sun, they will probably suggest that I seek urgent medical care. They are unlikely to know that it’s the first stage of my local solar model, and that I soon will be gluing a tiny .09 inch (0.22 cm) blue sphere, representing the Earth, to a fence 85 feet (25.8 meters) away. Using an online calculator, it’s easy to input any size of Sun at any location, and get the corresponding scale model metrics. This is the essential first stage in planning the big diagram. http://thinkzone.wlonk.com/SS/SolarSystemModel.php

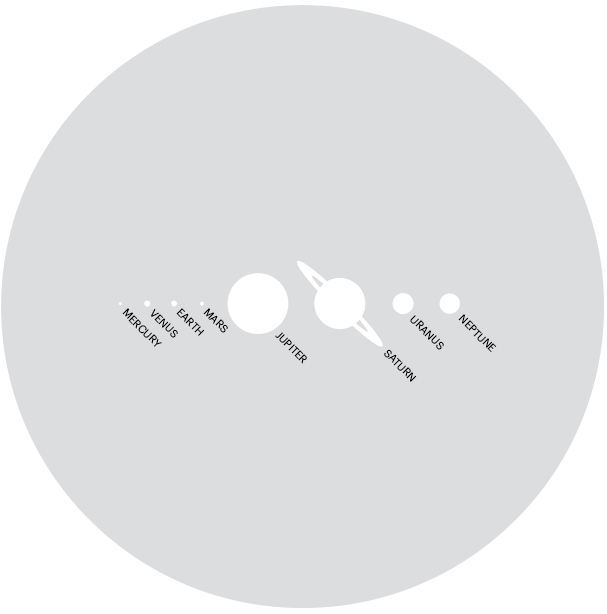
The Sun in proportion to the planets.

There are representations of the solar system, at various sizes, in many locations. Here are a few examples.

SWEDISH MEGA-SIZE

(Photograph: bengt-re)

The world’s largest solar model is in Sweden. The Sun is represented by the huge Ericsson Globe in Stockholm. The indoor arena has a diameter of 361 feet (110 meters). Sedna, a large minor planet, is 4 inches (10 cm) in diameter, and 567 miles (912 km) from the globe, way up in the north of the country. This would be out in the farthest reaches of the solar system. http://www.swedensolarsystem.se/en/

(Photograph: Dag Lindgren)

MAINE MID-SIZE

(Photograph: Michael York/The Maine Solar Model)

The Maine Solar System Model covers 95 miles (153 km). http://pages.umpi.edu/nmms/solar/

The Sun is sometimes a painted ring, sometimes a painted shape, on multiple floors inside the University of Maine, and is 49.5 feet (15 meters) in diameter. The 5.5 inch (14 cm) fiberglass Earth is outside a car sales location just 1 mile (1.6 km) away. It’s another 39 miles (63 km) down the road past models of all the planets to 1 inch (2.54 cm) Pluto (still a planet in those days, and despite being since downgraded, is after all, still orbiting the Sun). They’ve added a dwarf planet, Eris, discovered in 2005, which is a stunning 54.5 miles south of Pluto at this scale. It’s one of the farthest known objects in the Solar System.

SAGAN COMPACT

(Photographs: Teresacurl)

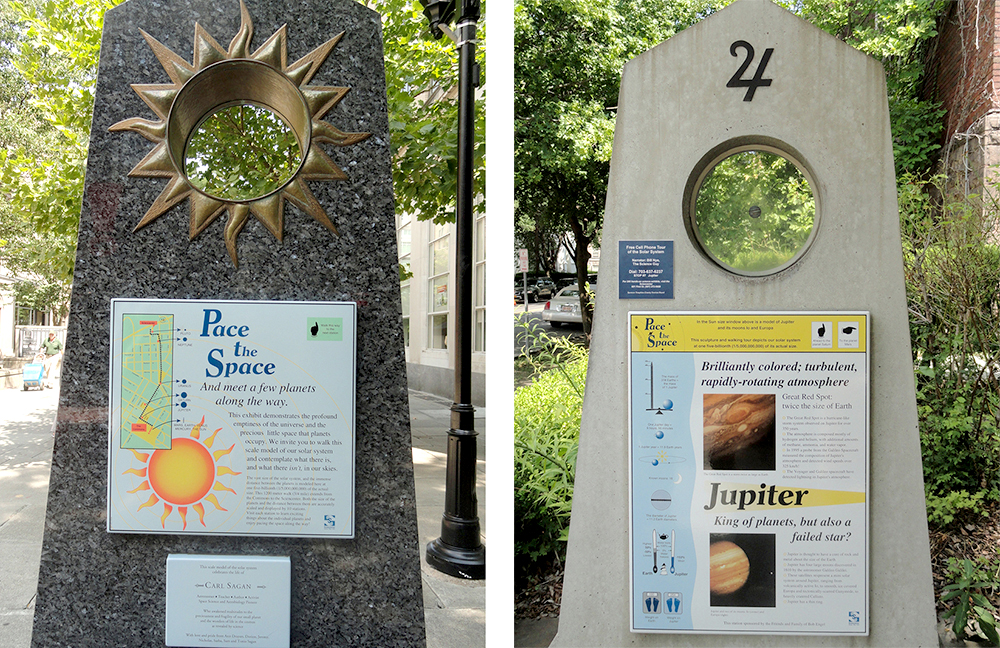
The much smaller Carl Sagan Planet walk was built in 1997 in Ithaca, New York, in memory of it’s very influential resident. It’s 0.7 miles (1.18 km) from the 10.9 in. (27.8 cm) diameter Sun to tiny Pluto, which is 0.2 inches in diameter (0.05 cm). The Sun-sized opening is a constant to compare the planets against.

http://www.sciencenter.org/sagan-walk.html

DESERT ORBITS

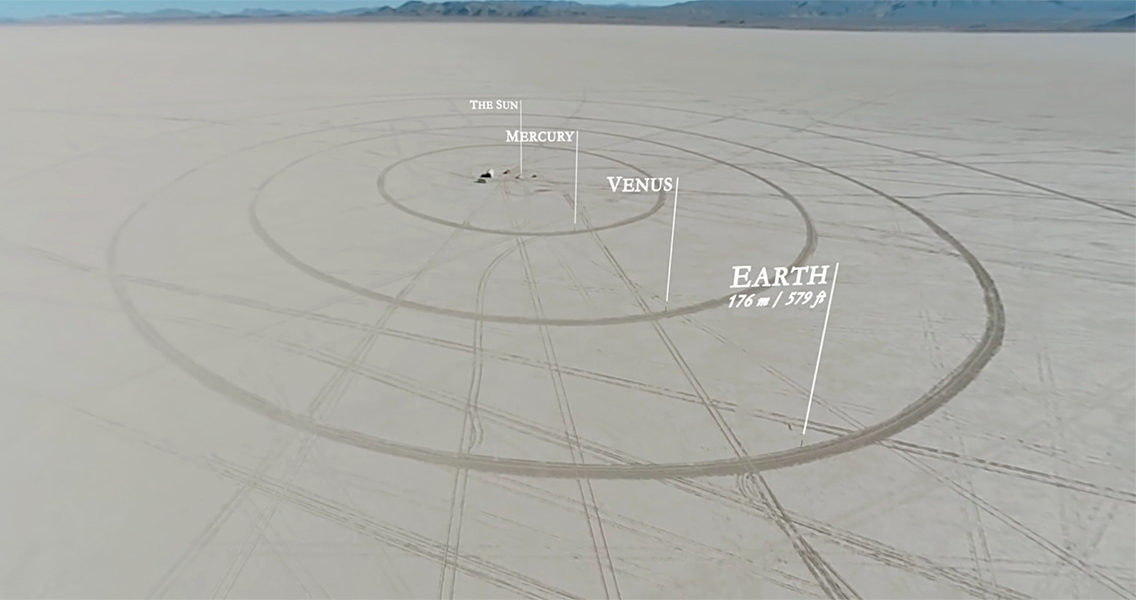
A creative solar model constructed in a Nevada lakebed. https://www.youtube.com/watch?v=zR3Igc3Rhfg

GOING MOBILE

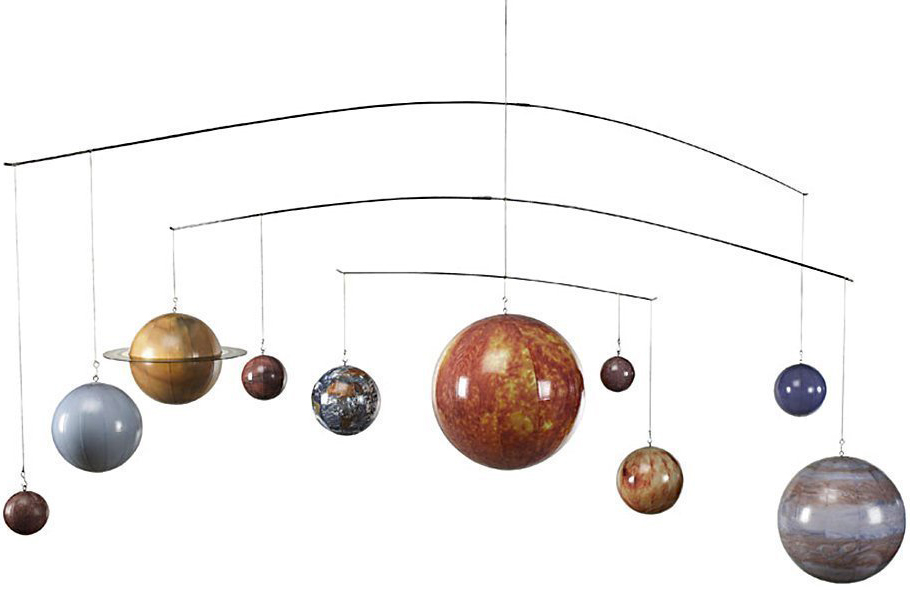
Rotating planets by Authentic Models. (Available from numerous online retailers.) Clearly not to scale. So if you give this a gift, make sure the recipient knows not to use it for calculating space probe trajectories.


Pie chart anxiety

THE CIRCULAR DATA VISUALIZATION CRISIS.


piechart_tombstone

(Photograph © vician/123rf)

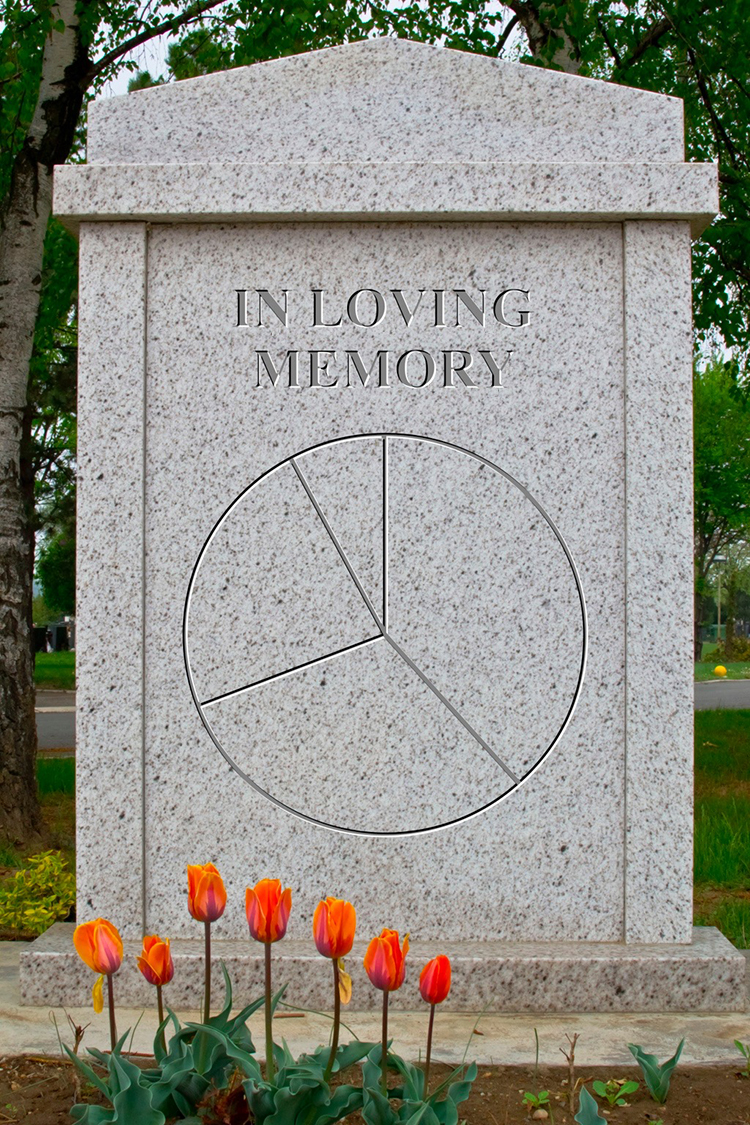
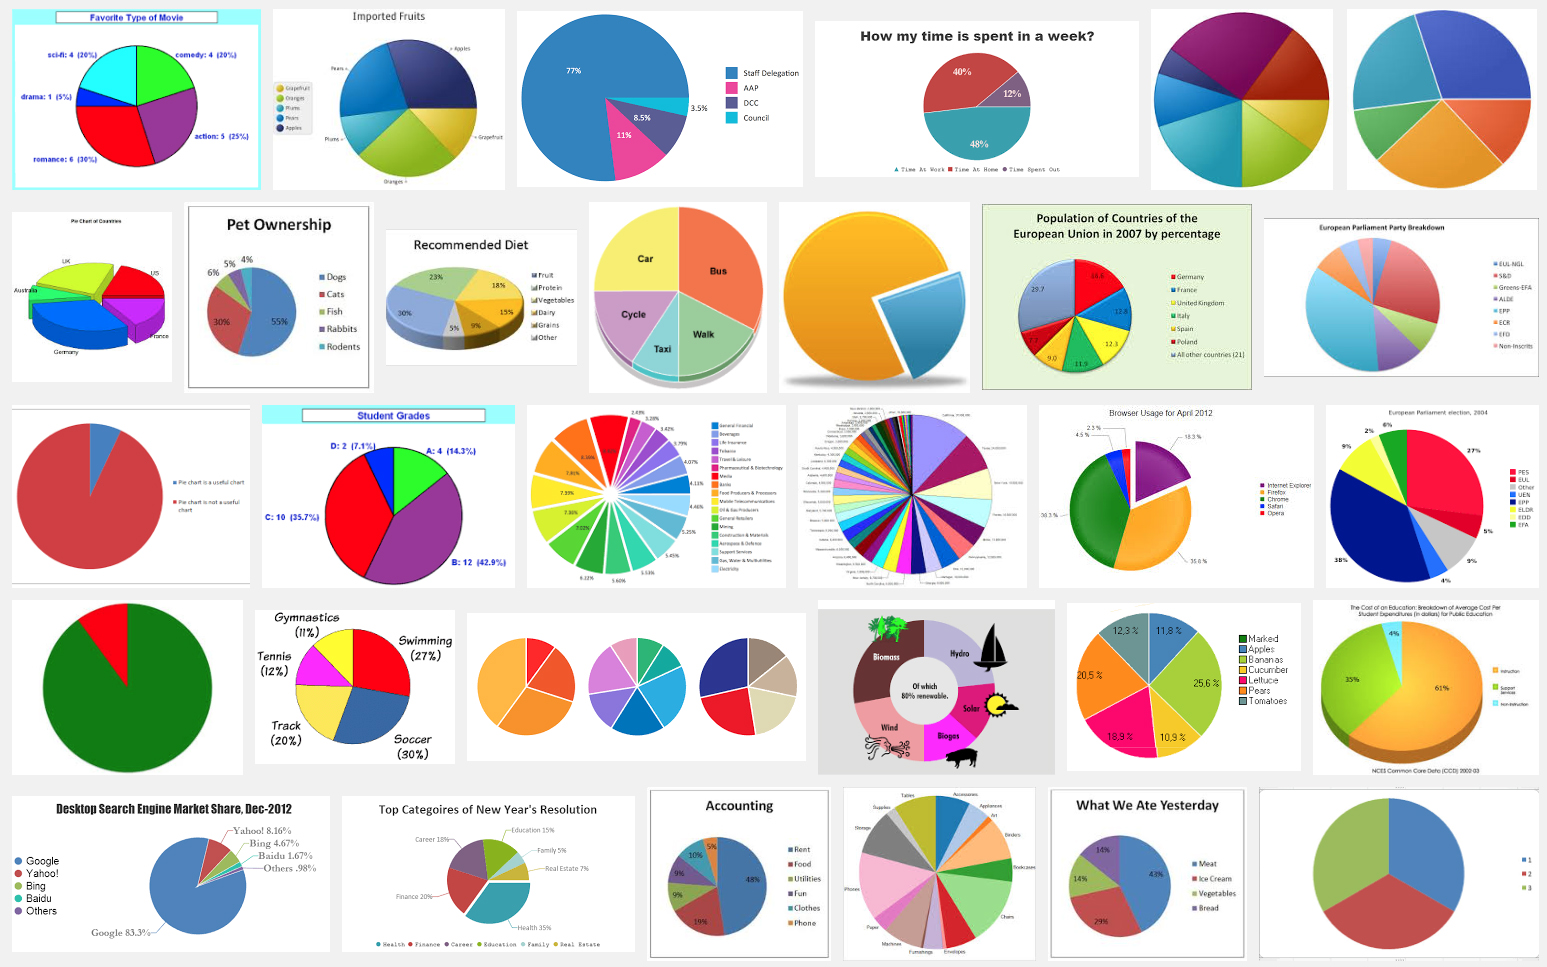
This classic charting method has  taken a lot of criticism in recent years (especially from academics), perhaps because of the endless use of badly-conceived pie charts in painfully-awful business presentations. Extreme perspective, garish colors, drop shadows, multiple slices. There are millions of examples online. Below is a Google search for “pie chart”.

googleimagesearch

But when William Playfair invented the form in 1801, it was a great idea. “Honey, I’ve just invented the pie chart,” he shouted from his wood-paneled office. “That’s nice dear,” she replied, unaware of the trend that he had just started. Company reports would never be the same again. Seriously, dividing up a number into it’s component parts might be represented extremely well by the idea of cutting up a pie. And like most things, it’s not the form itself, but the misuse of that form that brings problems.

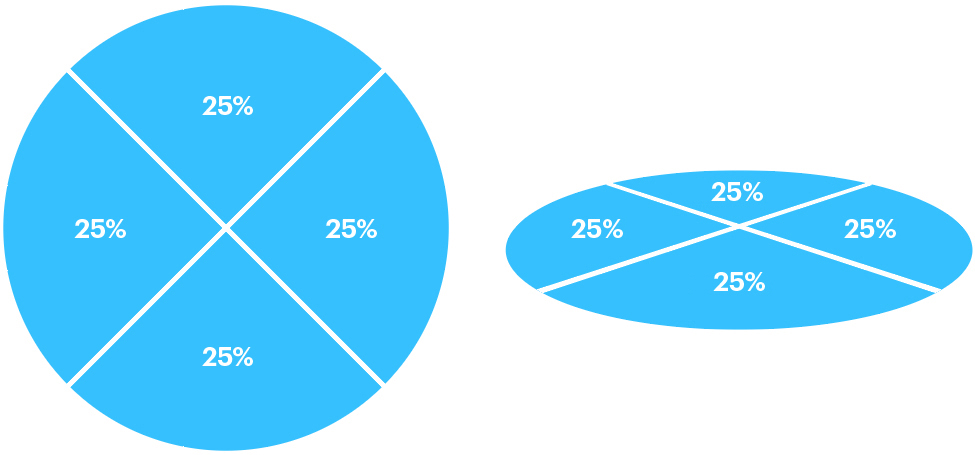
Pie charts in perspective are often very misleading as this simple graphic demonstrates.

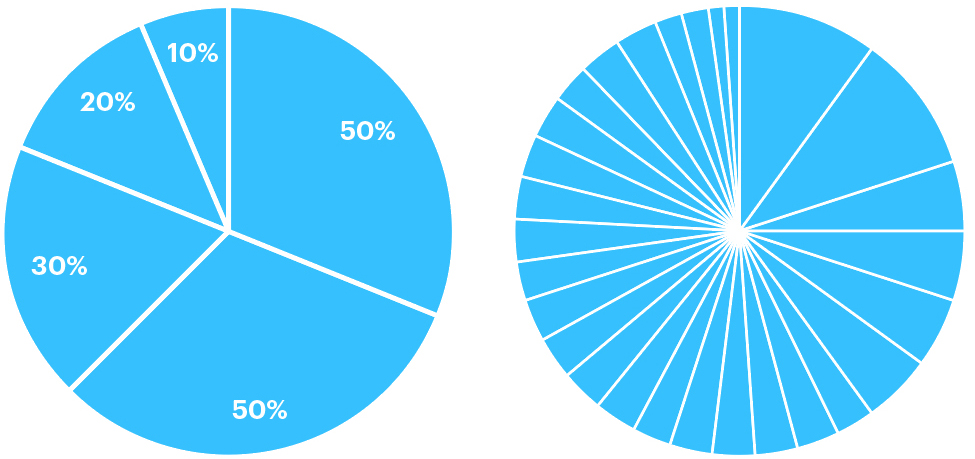
Sometimes you will see charts were the segments add up to more than 100%. This is wrong. It’s not a good idea to have large number of slices, because meaningful comparison (and clarity) starts to disappear. Some people say that five or six should be the maximum.

piechart160

As a general piece of advice, consider carefully if the data might be better shown as bars. Fine differences are much easier to see in that form. We’re not that good at comparing different areas that start at different points. Which brings me to the proportional circle. Not a good way to compare small differences either. It is widely used in infographics, and sometimes there are even multiple proportional pie charts in a project, but it can be really hard to get a grasp on the data.

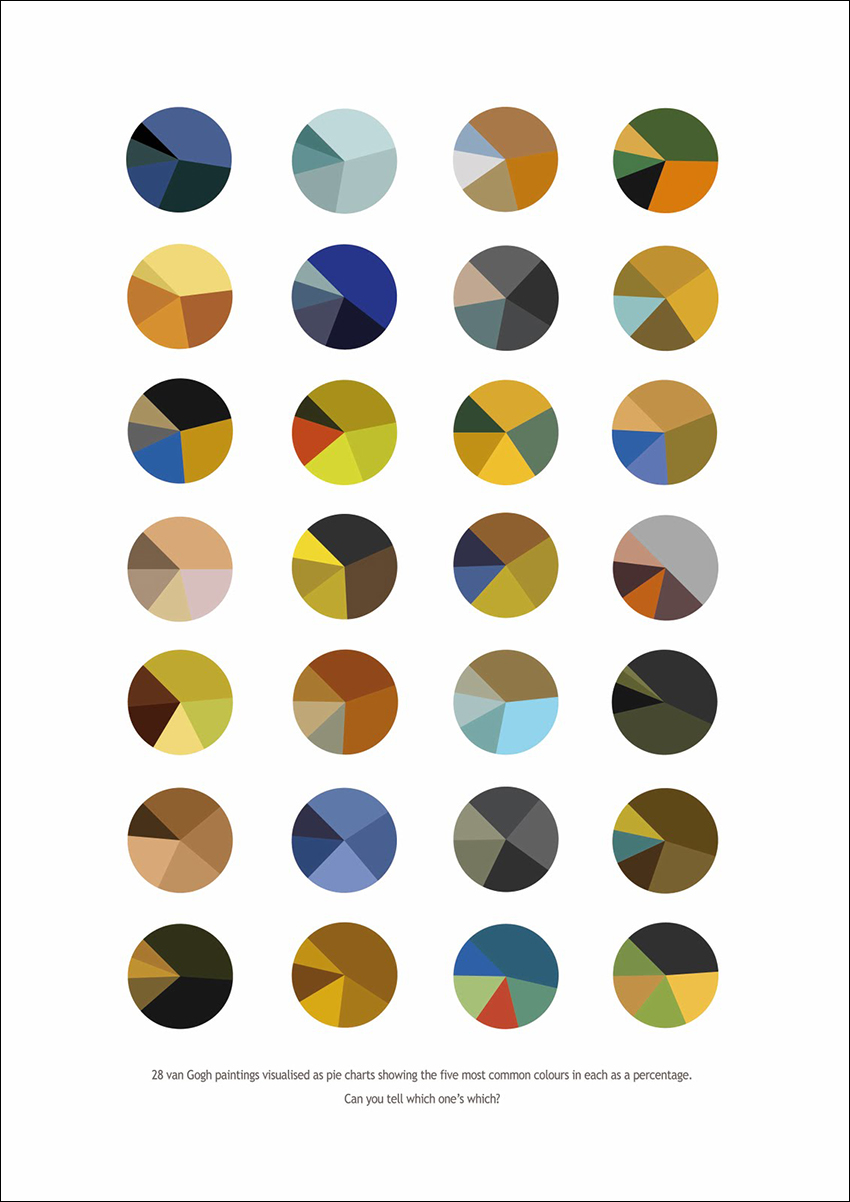
Below is a clever project by Arthur Buxton. The paintings of Van Gogh. The five most prominent colors in each painting are shown as percentages. See more of his work here: http://www.arthurbuxton.com

ab_vangogh

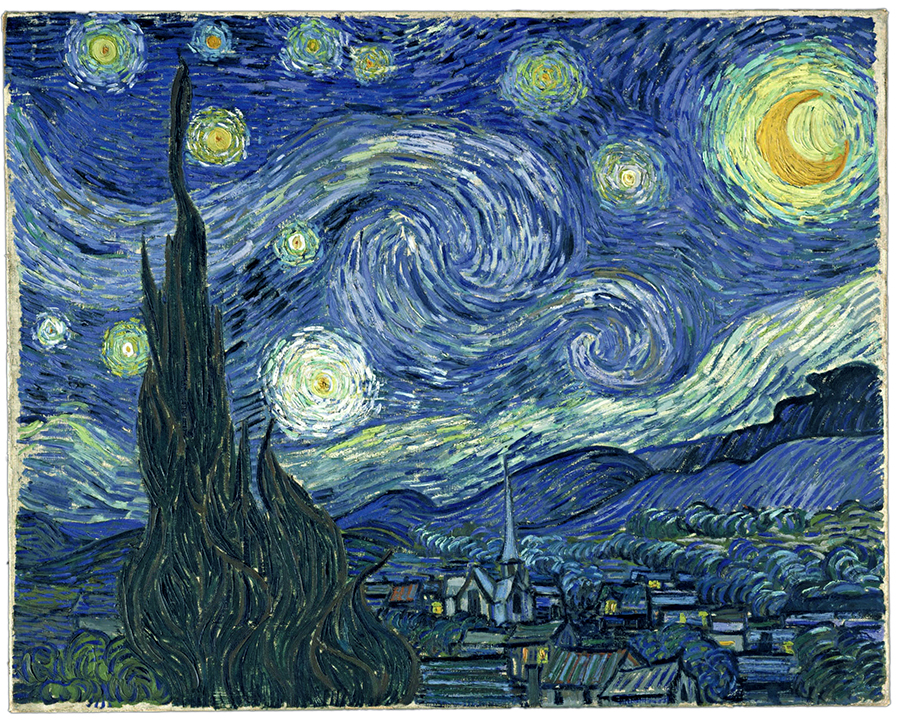
I don’t want to spoil the quiz, but the top left one is Starry Night.

vg_starry_night

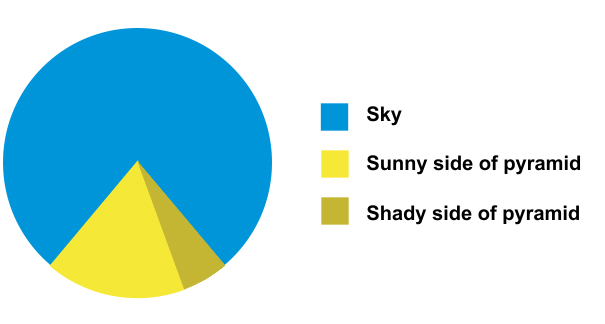
There are many pie chart jokes bouncing around on social media, but this is the best one, in my opinion.

sunnyside


Informational visions

VISUAL DEFINITIONS OF THE INFOGRAPHIC CRAFT.

jg_manhattan

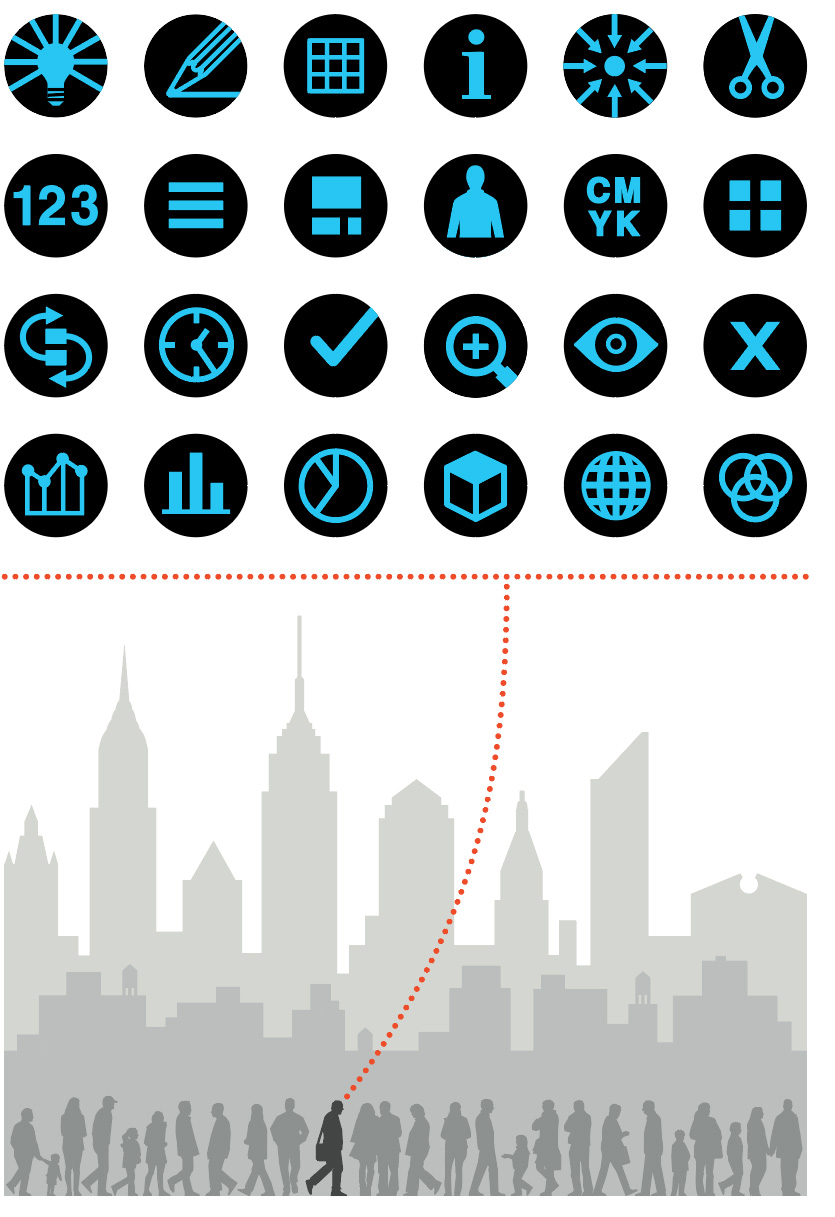
I’m walking in Manhattan (where I used to live), my head full of thoughts about making infographics. Expressed (of course) in pictograms. If you click on the image, you’ll see that I’ve decoded it. (Note: Keep your expectations reasonably low before clicking. It’s not rocket science.) This illustration originally appeared in the book “Infographics. A Visual Definition”. Eighty-one infographic designers submitted a page. It was produced to mark the twentieth-anniversary of the Malofiej conference. This year will be the twenty-fifth. More about that in later posts. The book can be purchased here: http://www.snd-e.com/es/libros/infographics-visual-definition

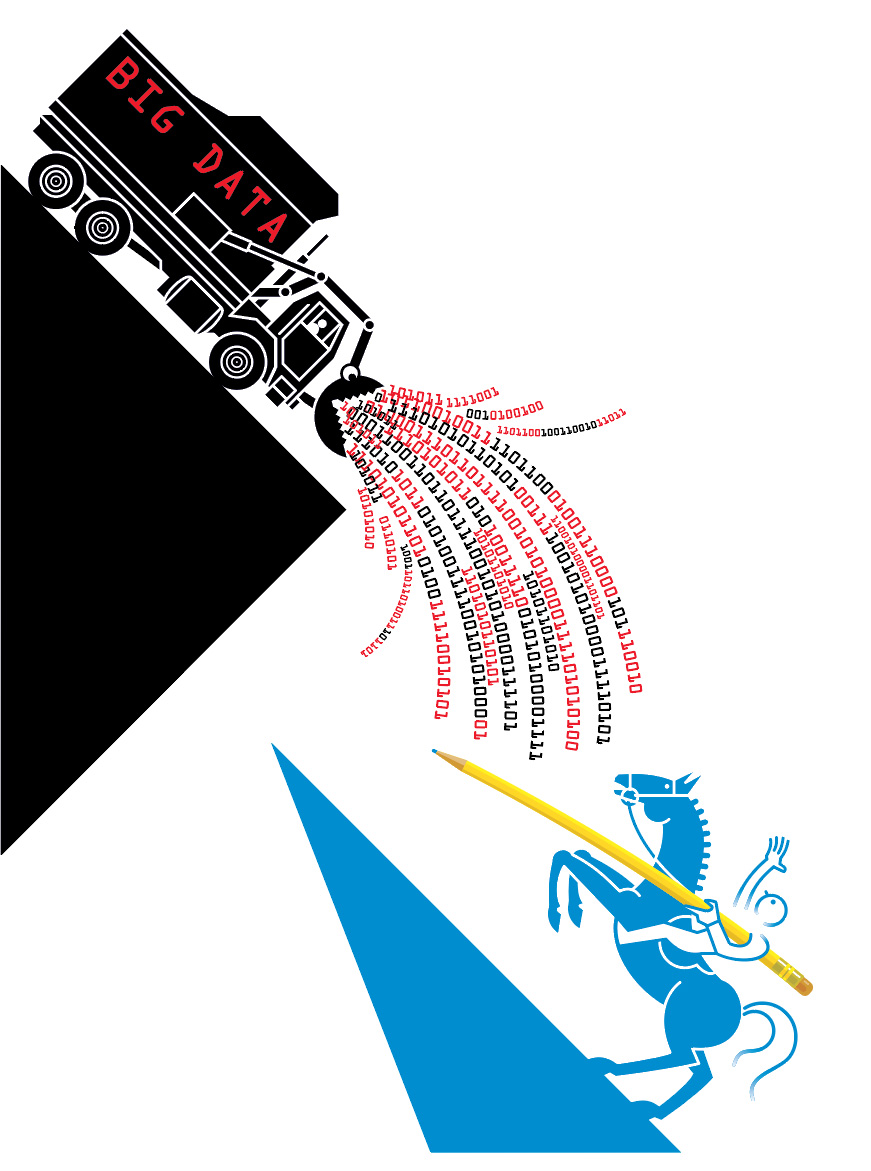
The example below is my favorite from the book. Nigel Holmes is protecting us from the onslaught of Big Data with a pencil. For some of us, it’s a mouse or a stylus, but the role of the designer in a world of ever-increasing information has never been more valuable. In a best-case scenario, that data is analyzed, and the truths within it are explained with clear, concise visuals. That’s my dream.

nh_bigdata

Bayer’s masterpiece

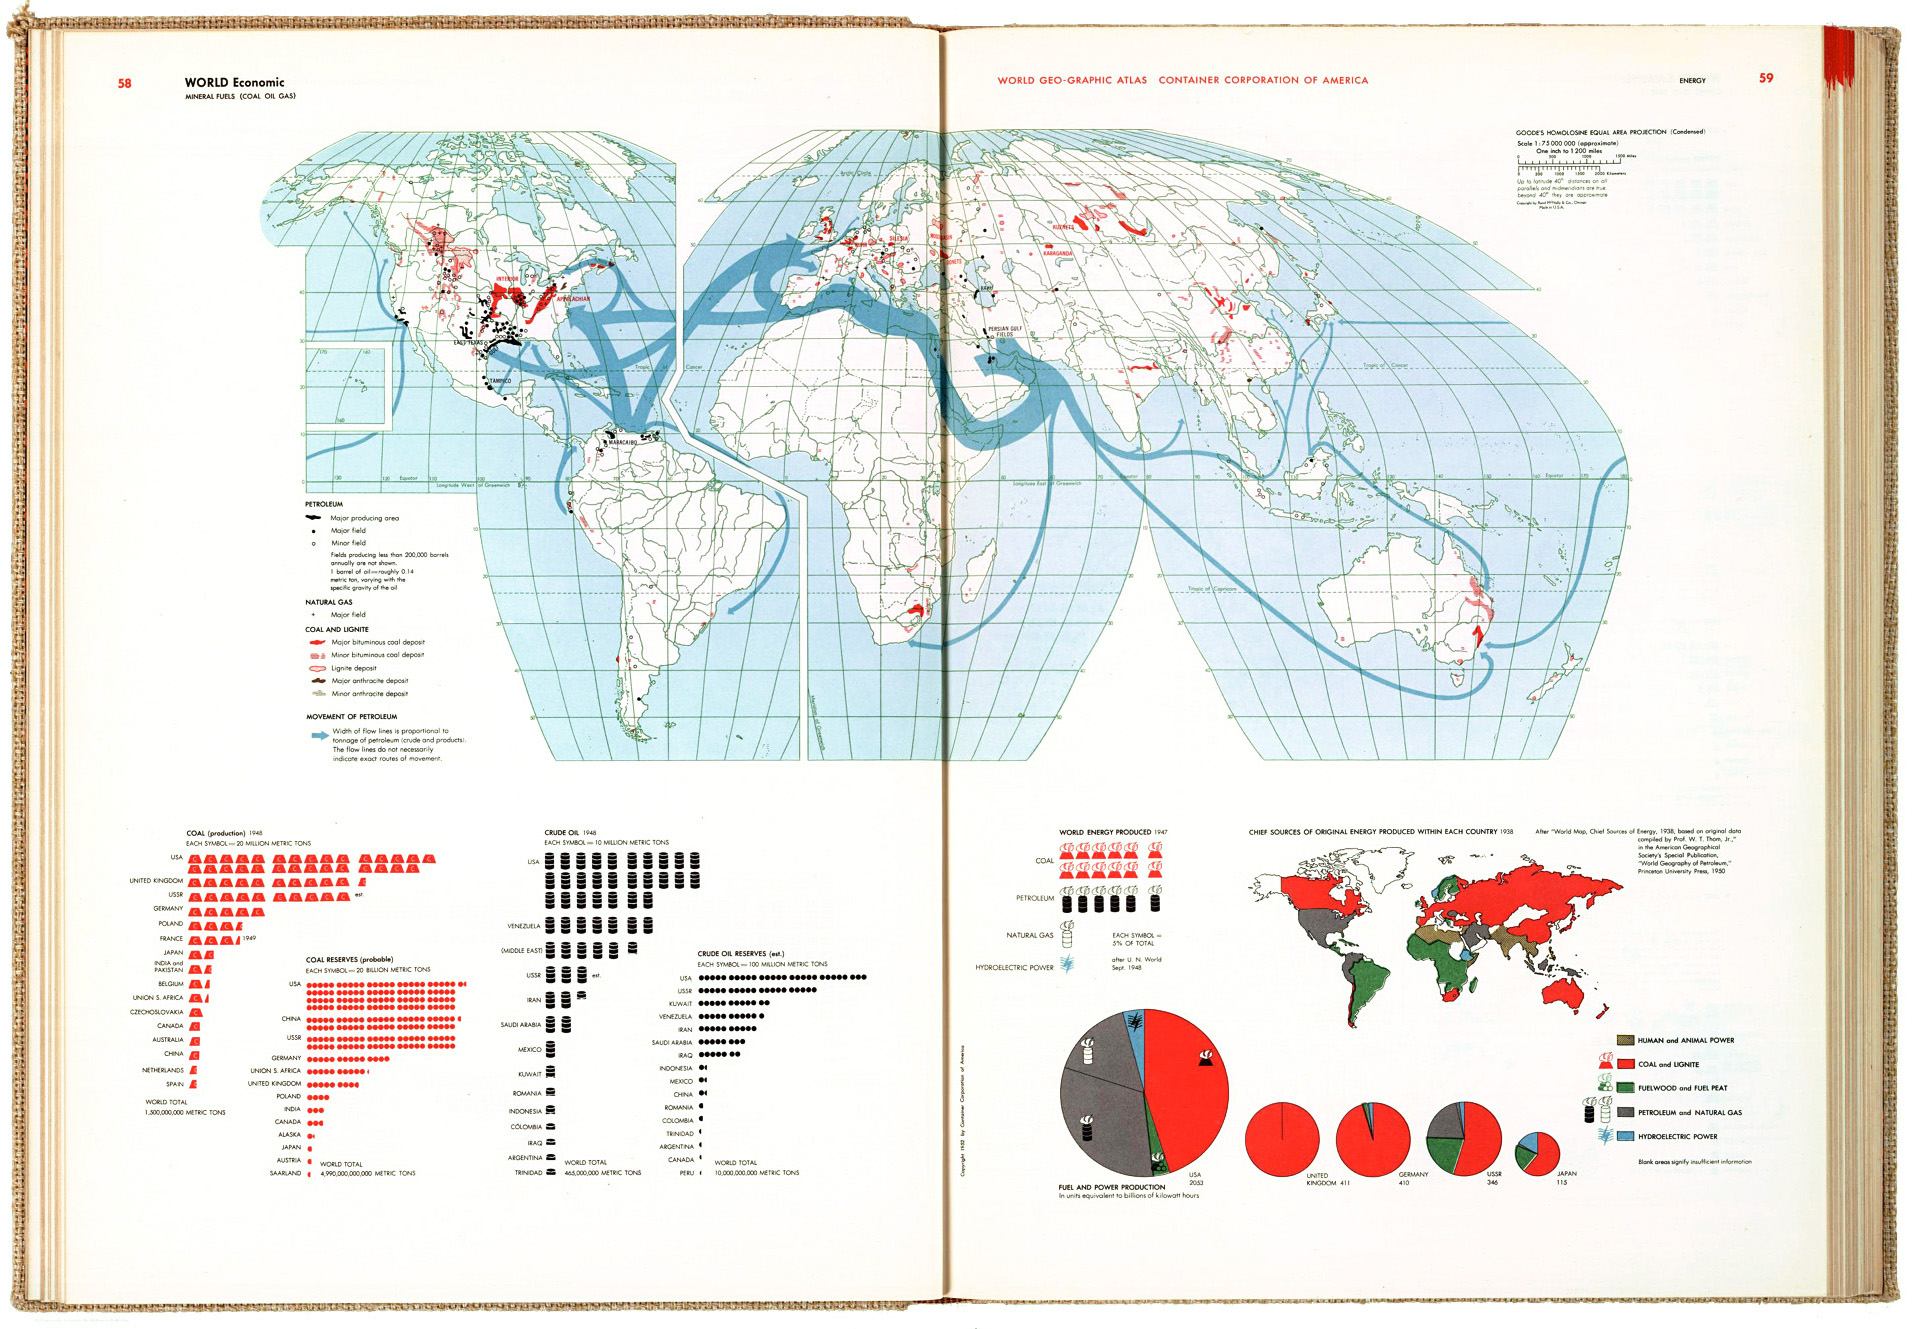
THE 1953 WORLD GEO-GRAPHIC ATLAS.

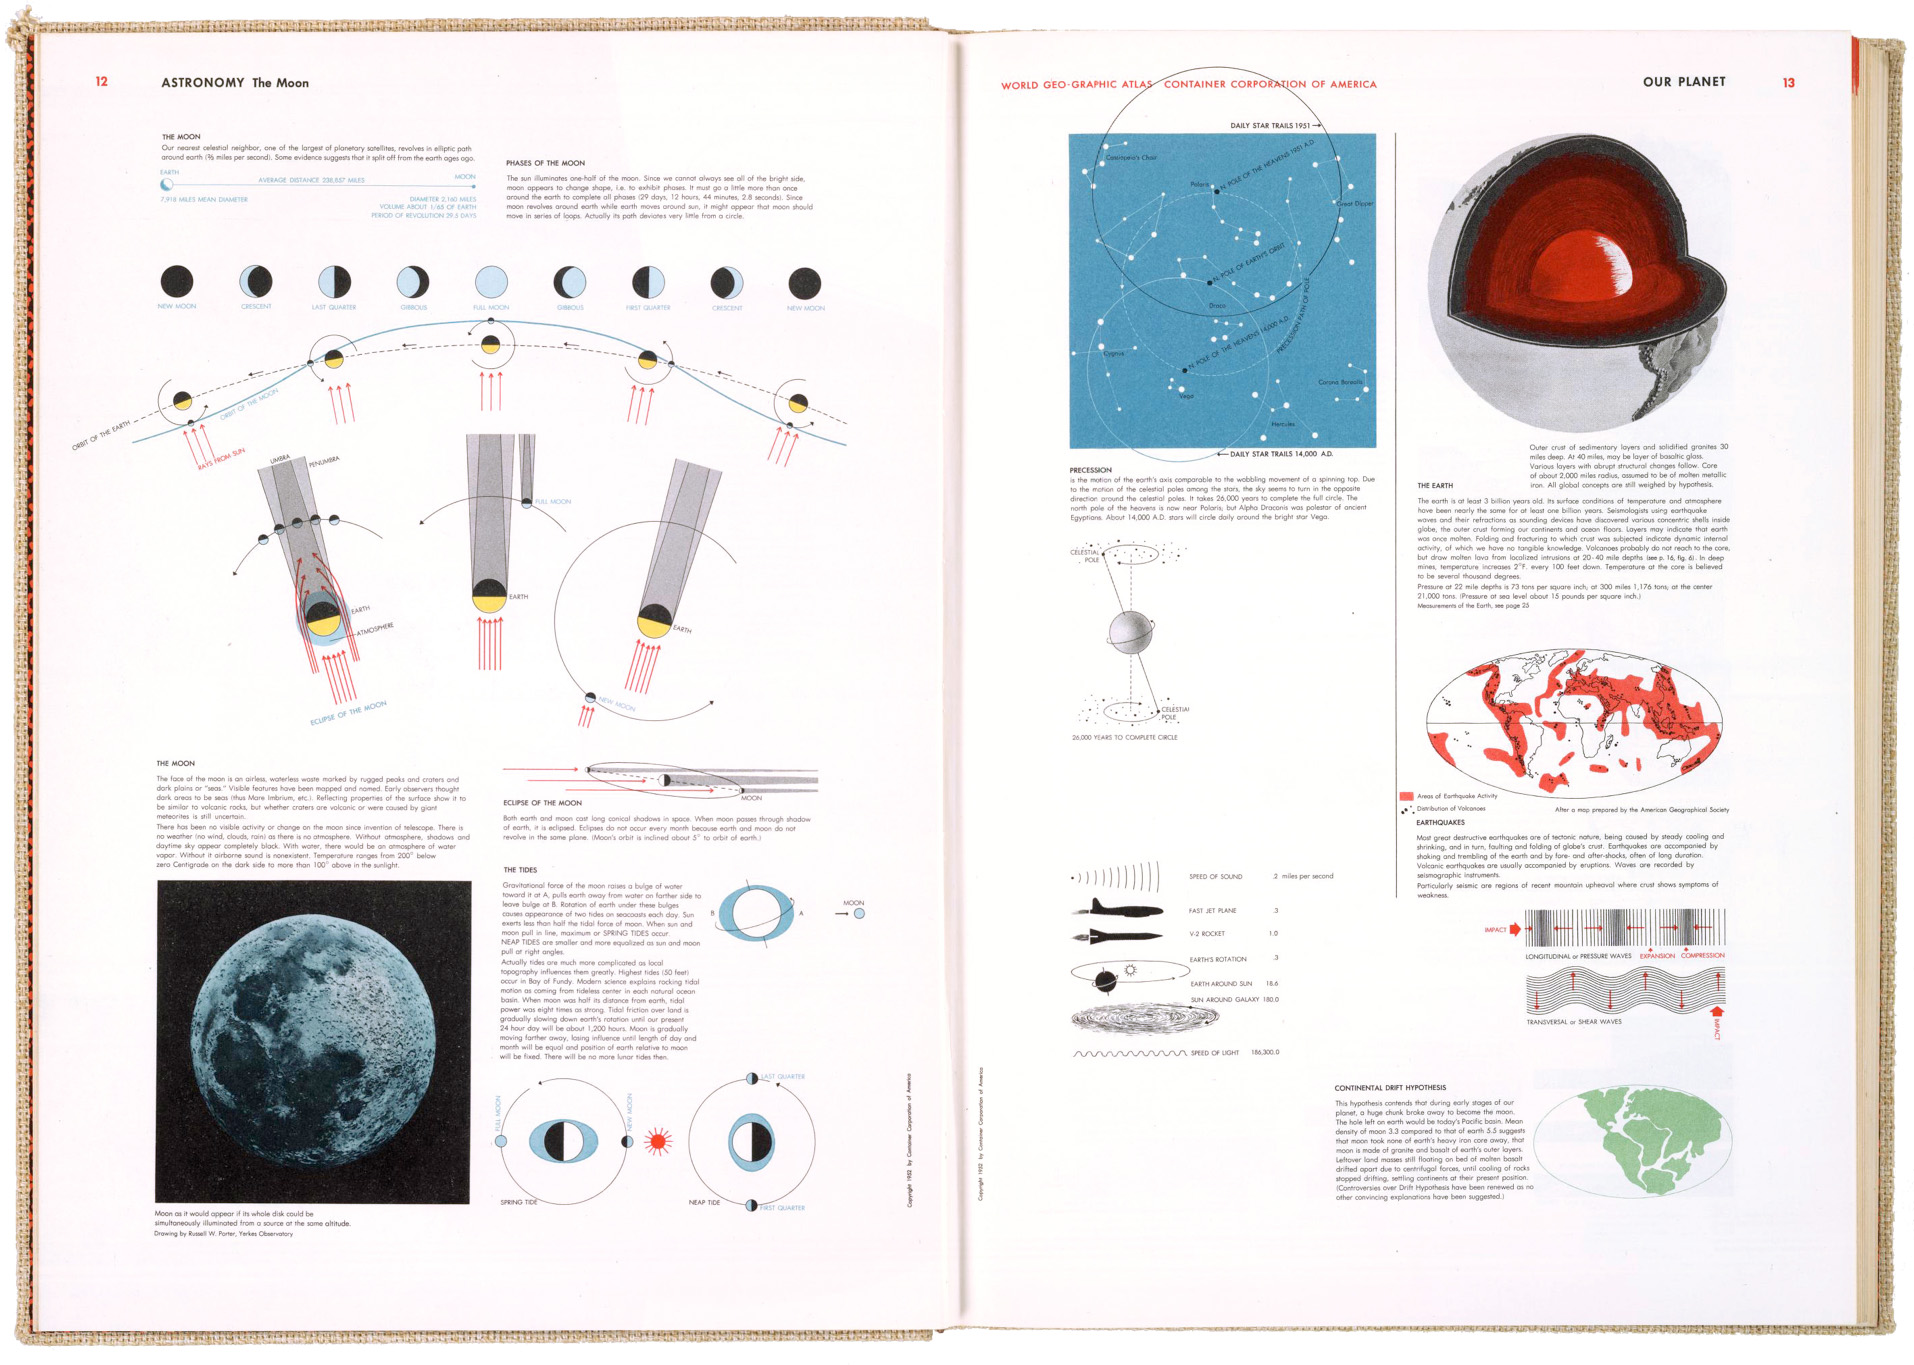
astronomy_hb1

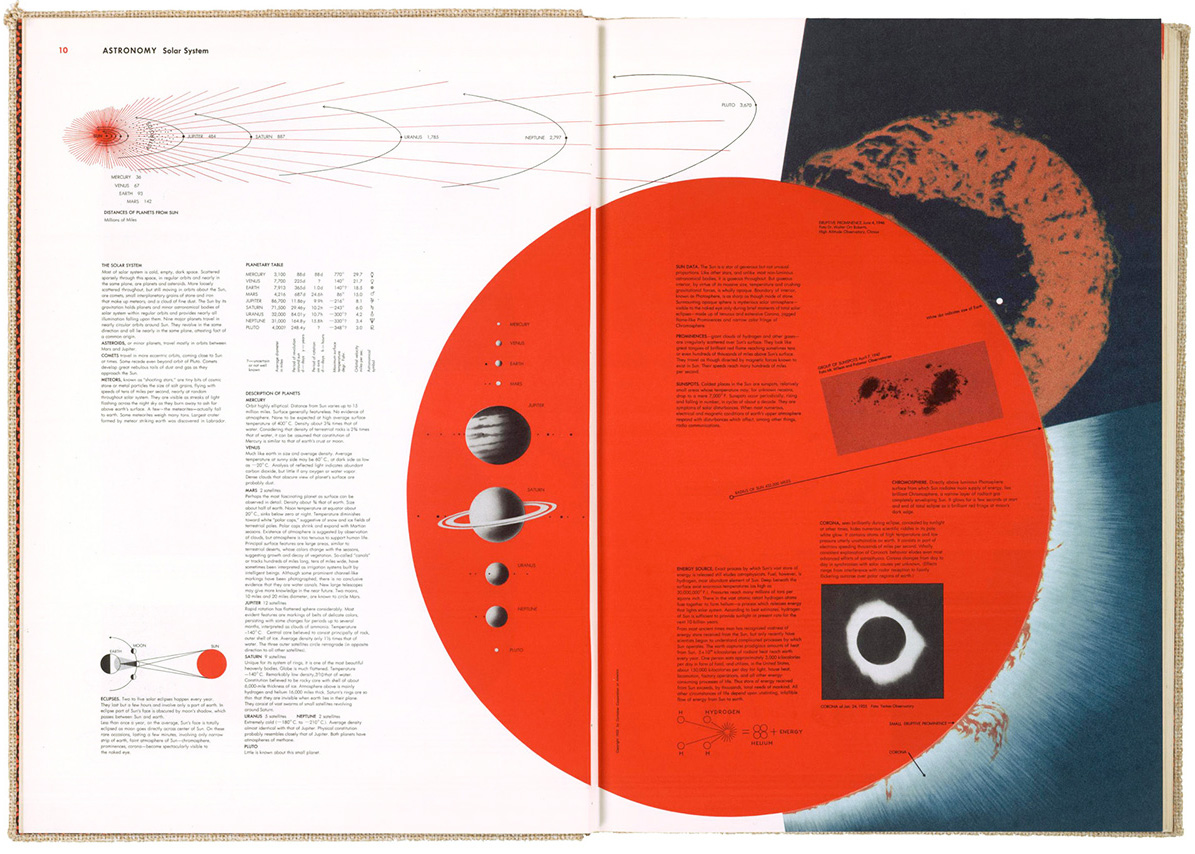
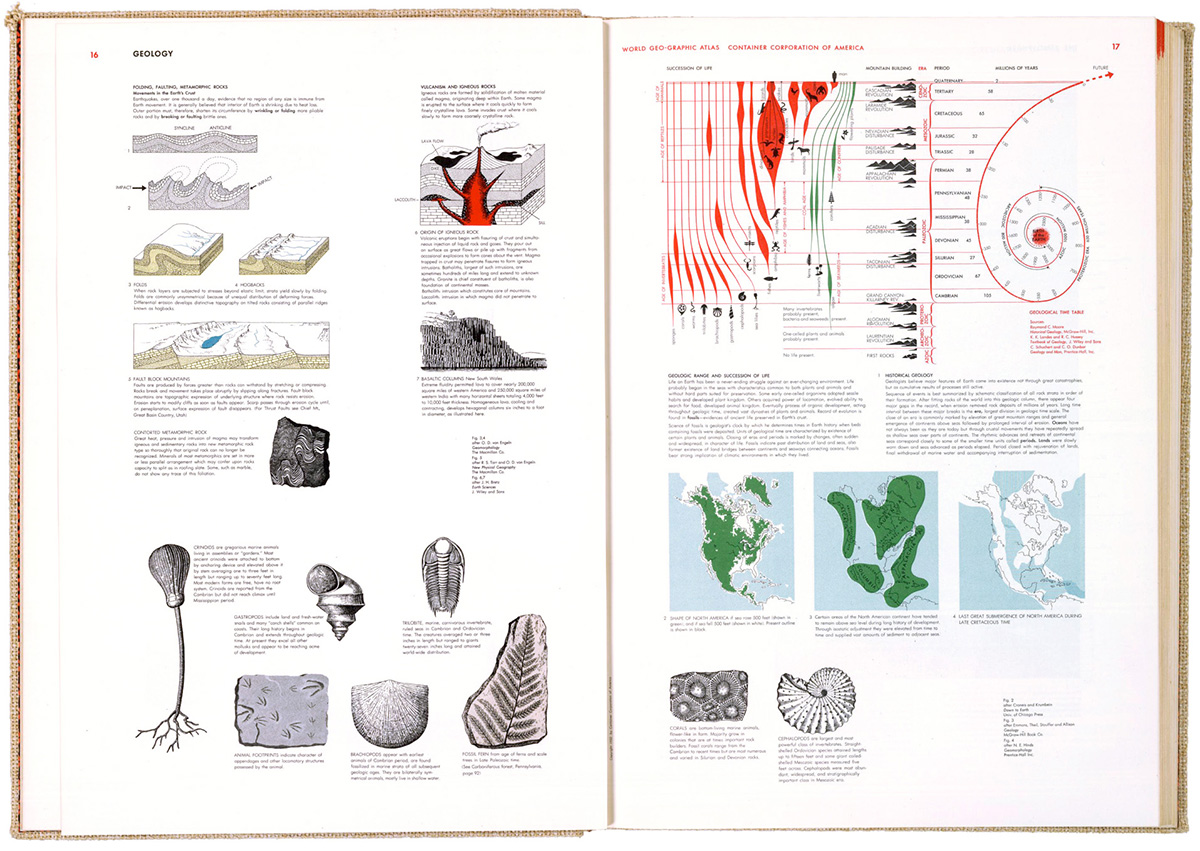
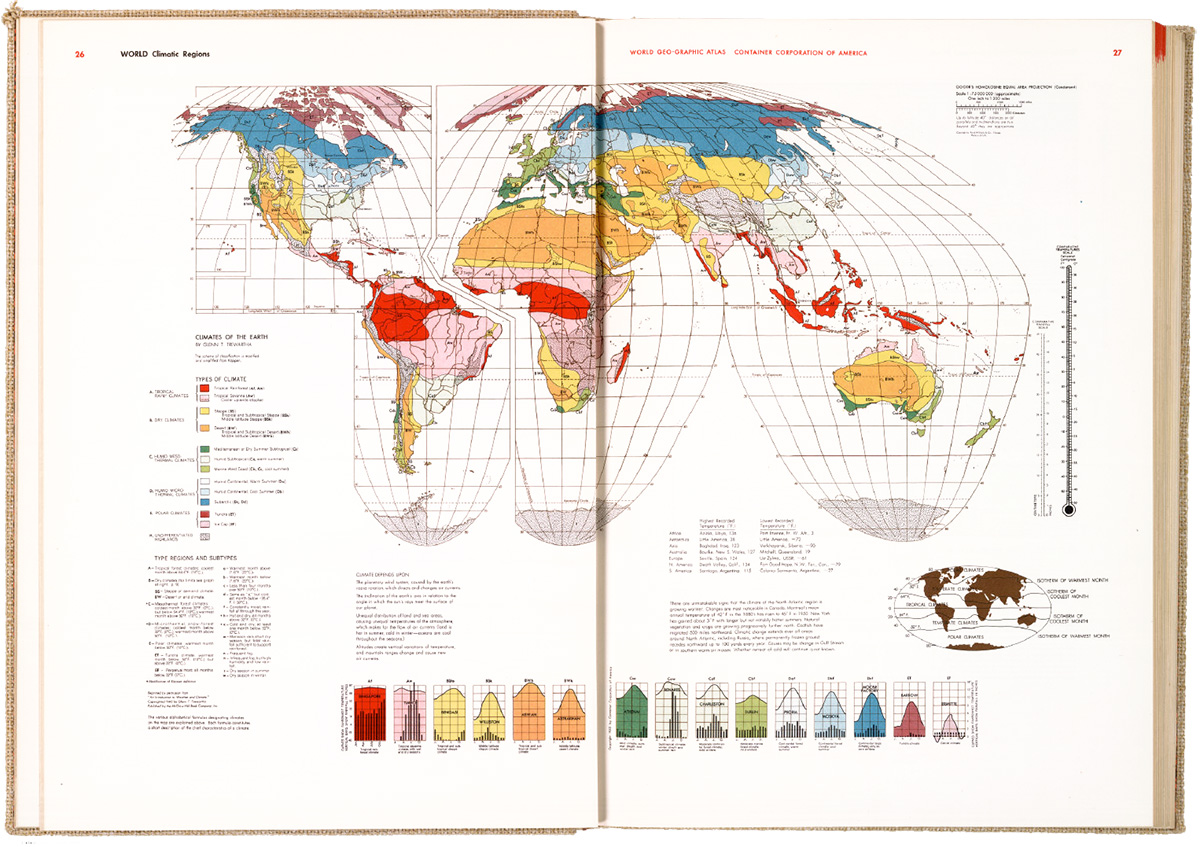
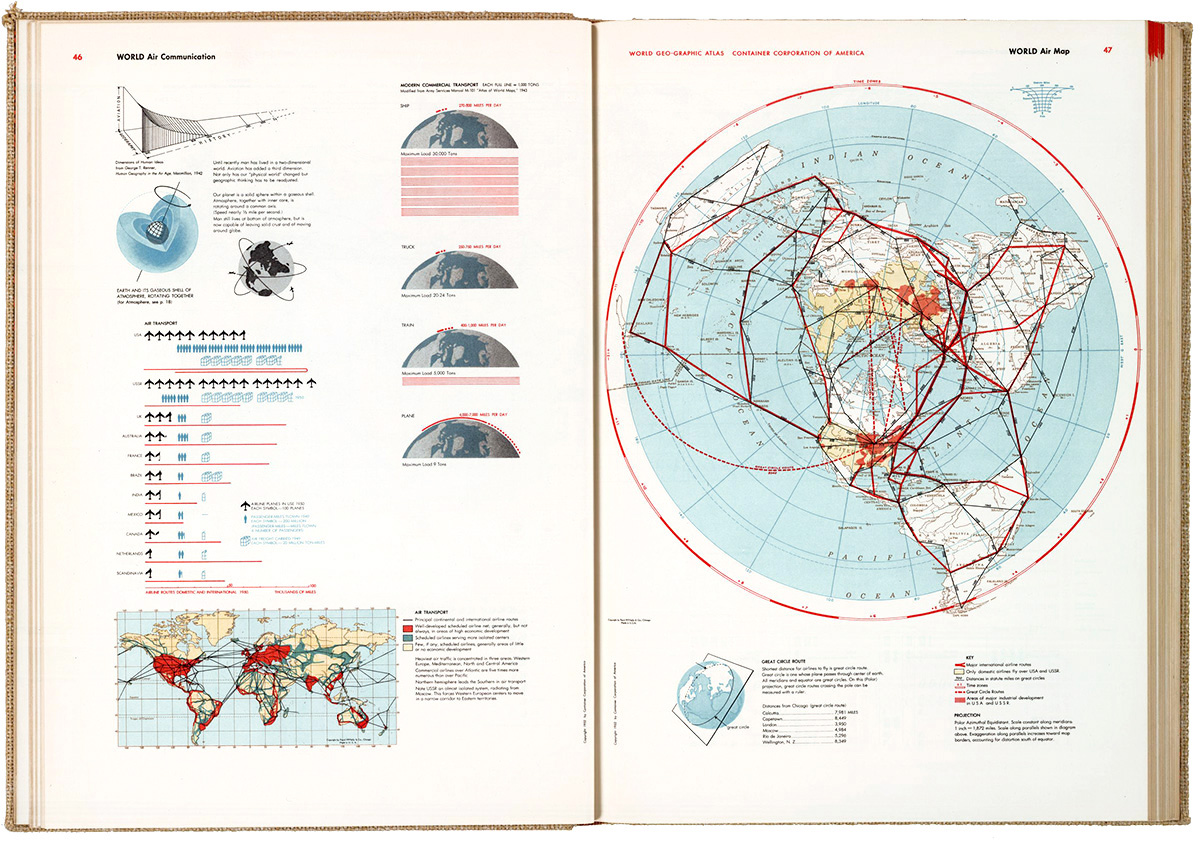
This informational gem took five years to produce and contains a few thousand infographic items. I don’t own a copy, but Michael Stoll, who I mentioned in an earlier post (https://www.johngrimwade.com/blog/2016/10/06/atlas-heaven/ ), has one (naturally) in his superb collection of historical information design. I was in Augsburg two weeks ago, and was able to examine the real thing, instead of looking at digital images. Seeing design in it’s original format, as opposed to looking at different sizes and variable image quality online (or in this blog, for that matter) is a vastly different experience. Often difficult to achieve, but worth the effort.

themoon_hb

The atlas was produced for the Container Corporation of America to commemorate their twenty-fifth anniversary. 30,000 copies were printed. They were distributed to customers as a gift, and given to numerous colleges and universities. It was never produced commercially, or reprinted, so original atlases in good condition are quite rare, and thus expensive to acquire.

A team of three designers worked under Bayer to develop a graphic language for the book, using the color system that had been developed for CCA by Egbert Jacobsen. Bayer did his own research, traveling widely to assemble the information. There are many design influences to be seen in the pages, like the Isotype system of pictograms. I’m struck by how it looks so modern, sixty-three years after publication. It shows the staying power of precise, clear information design.

geology_hb

Herbert Bayer was a Renaissance Man. A graphic designer, typographer, photographer, artist, interior designer and architect who studied and taught at the legendary Bauhaus school. He emigrated to the U.S. before the Second World War, and produced all kinds of impressive design across many fields.

climate_hb

airconnections_hb4

economic_hb3

These images are from the David Rumsey Map Collection. See the full atlas in high-res there: goo.gl/gpd8nV