Category: History

Picture language (Part 1)

COMMUNICATING WITH SYMBOLS.

This is a guest post (in three parts) by a master of pictograms, the great Nigel Holmes. Parts 2 and 3 will appear on the next two Mondays.

Linguists, designers, social scientists, teachers, and a 12th-century nun, among hundreds (yes, hundreds!) of others, have invented what they hoped would be internationally-understood languages. None have lasted. Esperanto (by Ludwik Zamenhof, 1887) came closest; Klingon (by Marc Okrand, 1984) survives as a pop curiosity for devoted Star Trek followers.

Very few of the invented languages were pictorial, and those that were have not fared any better than their purely alphabetic cousins.

These posts are not about a history of writing that starts with 30,000 year-old cave paintings then runs through Sumerian sign-writing, Egyptian hieroglyphs, Mayan calendar icons and so on, but are about how we might return to using pictographs, pictograms, pictorial symbols, icons —to mention a few of the many names for these tiny pictures—to communicate with people from countries who don’t know what you are saying when you speak or write in your native Dutch or Swahili or English (or Esperanto).

For a picture language to be universal, thousands of pictures are needed. An argument against inventing such a language (a two-way communication) is that while it might be fine for someone equipped with those thousands of pictures to “write” in that language, the average person cannot “write” it. It’s a one-way, read-only communication.

There are tons of pictures to be drawn (or somehow produced) by the “writer” of a visual language, but can we be sure that those pictures mean the same thing all over the world? A house is easy to draw. Or the sun. Or a woman with her child.

How do you picture hope, or sin, or longing, or fertility treatments, or financial backing, so that anyone, anywhere can see the precise meaning?

I’ve drawn lots of pictorial symbols, and I relish the quirks of regular spoken and written language. Against what look like difficult odds, I have often thought of trying to create my own version of a way to communicate visually. My inspirations are three picture languages that have come closest to any success in the past: Charles Bliss’s Semantography (1949; Bliss later changed the name to Blissymbolics); Yukio Ota’s LoCoS (Lovers’ Communication System, 1964); and Otto Neurath’s Isotype (developed in the 1920s). Actually, Neurath never claimed that he was inventing a total language. When he spoke about Isotype, the graphic system that he created with Marie Reidemeister (later she was his wife), and Gerd Arntz, his leading graphic designer, Neurath called it a “helping language” rather than a complete substitute for the written word. Neurath and Isotype will be the subject of the second post.
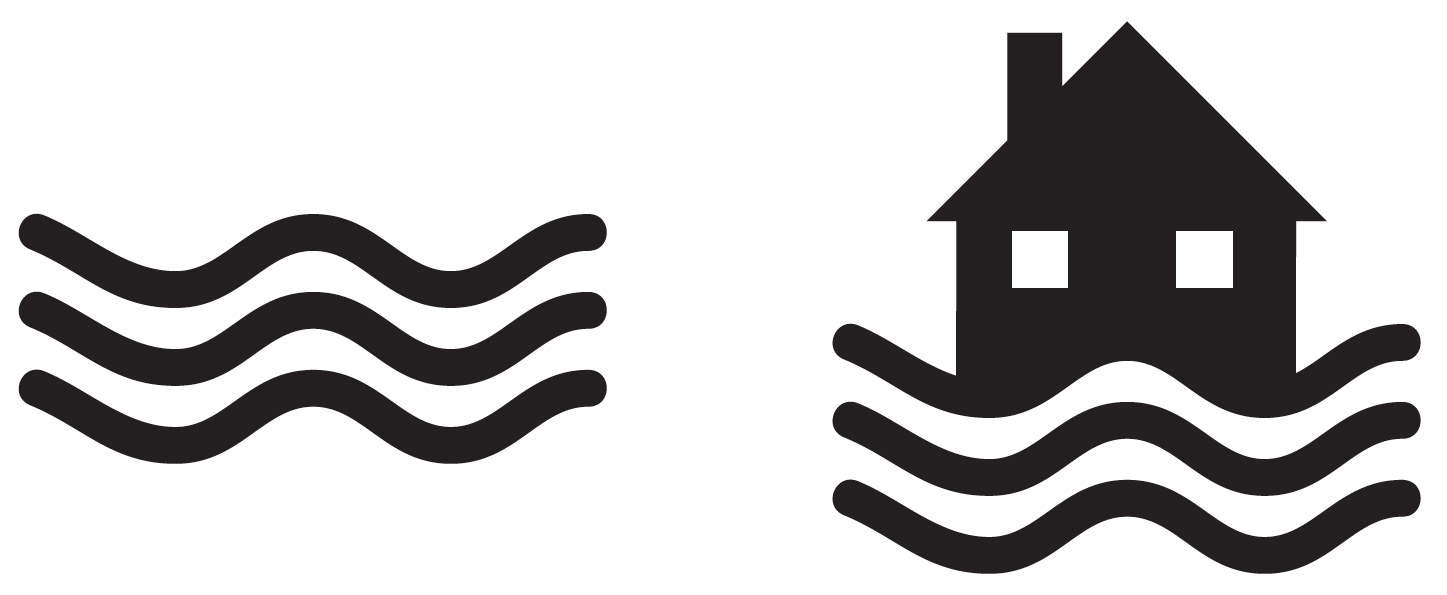
Some of the Blissymbolics and LoCoS images are understandable pictures (house, fish, car, man, woman) but many others are a vocabulary of abstract marks that the inventors have assigned meaning to, such as a wavy line (horizontal = water; vertical = smoke), that can be combined with pictorial symbols to make “words” (house + horizontal wavy lines = flooded house; although it could also be houseboat).

But what if a pictogram of a wavy line is positioned horizontally next to a factory chimney, indicating smoke? Now a horizontal wavy line means smoke, not water. Another inventor might use a teardrop shape to mean “water.” Besides, in certain contexts, Bliss used a vertical wavy line to mean fire. Weather maps today use three wavy horizontal lines to mean fog.

When it comes to completely abstract marks—those which don’t look like anything we know—there’s a bigger river of meaning to cross. We have to learn what the inventor intends these marks to mean, in the context they are used. Many of them act like accents common to written languages. They also address the question of grammar in language. (For instance, a mark might let readers know whether a pictorial icon is a noun or a verb.) But the use of such modifying marks means that pictorial languages that include them aren’t truly visual. If you can’t read a text until you have learned how to read the marks, it’s just another language to learn, not one you can “read” by looking at the pictures. And that’s the point of an international picture language. It’s easy to read. By anyone.

In fact, are there any marks that are truly universal? You’d have thought that some, such as up- and down-arrows are. They mean up and down, right? But do we all agree on what that means? For Bliss, a picture of a heart with an up-arrow meant happy. A heart with a down-arrow meant sad. So he was using “up” and “down” as figures of speech. But in American Indian picture-writing the arrow looked like an archer’s arrow with feathers at one end and a sharp point at the other, and it meant “protection.” We can’t even assume that a simple thing like an arrow means the same thing to everyone.

So before finishing the design of any pictogram, designers should ask themselves and others—non-designers, if possible—this question: what else could this pictogram mean that I haven’t thought of? And if the image is part of a proposed universal language, designers must ask that question all over the world before claiming it has universal meaning.

In 1961, IBM introduced The Selectric typewriter with its revolutionary, interchangeable “golf ball” printing element, that replaced a normal typewriter’s basket of spidery arms with characters on the end of them that sprang up to hit the page. If you typed too quickly, the arms got tangled up. Initially there were 64 characters on the golf ball; later, the ball had 96 characters. Before the age of the computer, Bliss saw the possibility of a typewriter golf ball with his symbols on it.
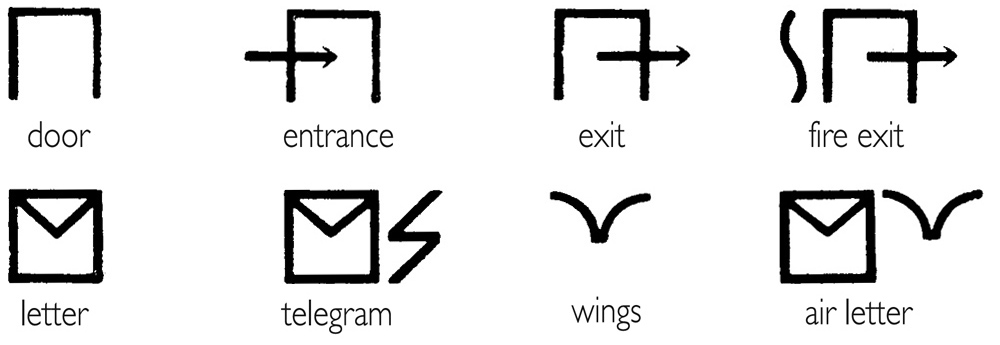
Now his language could be typed —“written”— by anyone. Typewriter companies were already making machines with letters and numbers and also with a range of symbols for scientific communication. Mathematical, chemical, biological, astronomical and other symbols were available. Bliss’s golf balls were never made, but his idea that anyone could simply type his pictograms on paper was way ahead of its time. Of course, to come up with a set of pictograms that would fit on the ball was difficult. Bliss had to simplify everything pictorially, and the result looked somewhat like written words—a string of marks—except that they weren’t actual letters of the alphabet. He wrote long tracts about how to combine his pictogrammic marks to extend the range of possible “words.”

The icons in Yukio Ota’s elegant visual language, LoCoS, are designed in a way that could be written, with practice. But like Blissymbolics, LoCos combines simplified pictures with abstract marks that have to be learned.

Any picture language excludes the blind—you can’t speak it or hear it—but perhaps we could consider a kind of braille version. Deaf people do have their own visual sign system, and there’s plenty of signage in airports, hospitals, zoos, at the Olympics, on the road—but that’s wayfinding, not a language. I hope we don’t give up on trying to design a whole universal pictorial language.

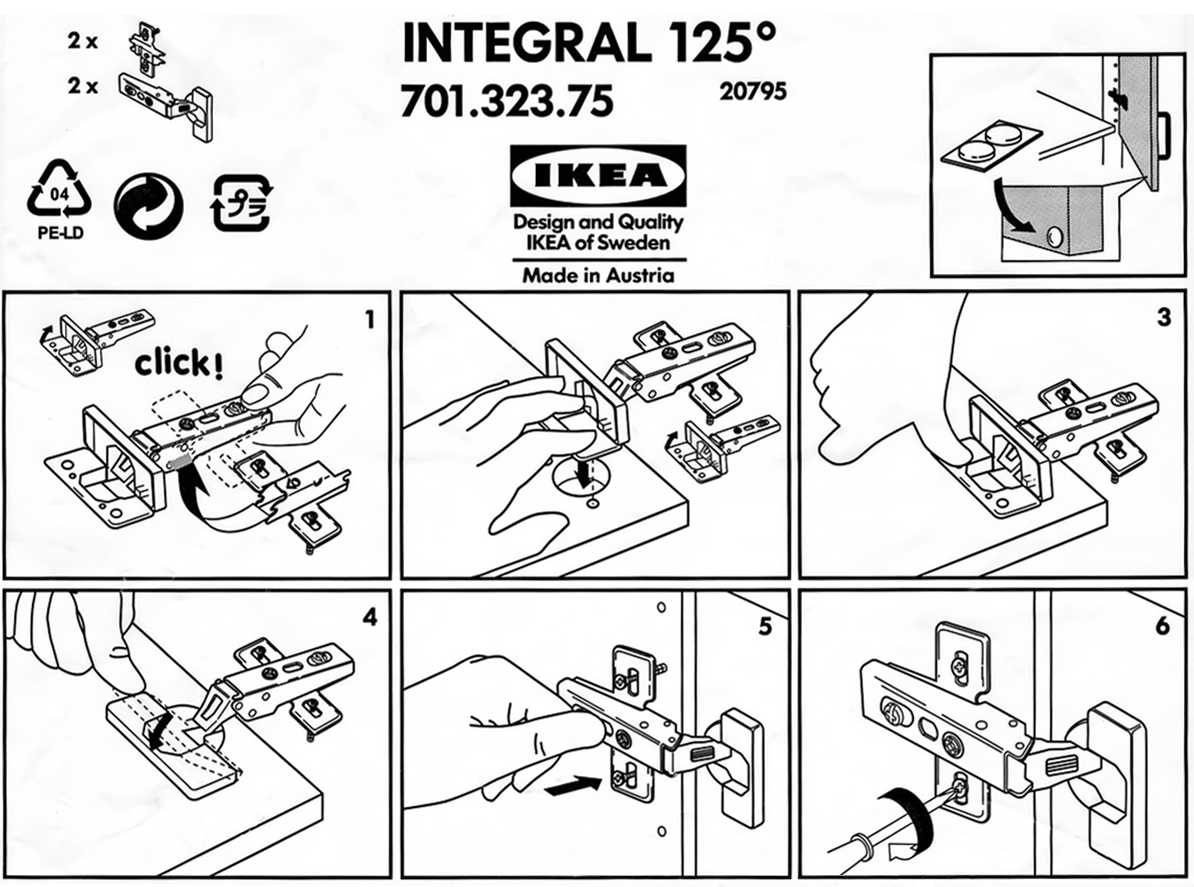
Ikea, the Swedish furniture store, hasn’t given up. They’ve attempted to make the instructions for their build-it-yourself items internationally understandable, eliminating multiple translations. However, it is good to know that for a modest sum, they will deliver the bits and pieces to your home and assemble them for you, thus preserving your sanity and fingers, and limiting the screaming of obscenities at the visual instructions. One day I may have the guts to show you my language. Then you can scream at me.
Worth reading: “In the Land of Invented Languages,” by Arika Okrent, 2009.

Next Monday: The Isotope revolution.


Dot pattern

THE LETRATONE ERA.

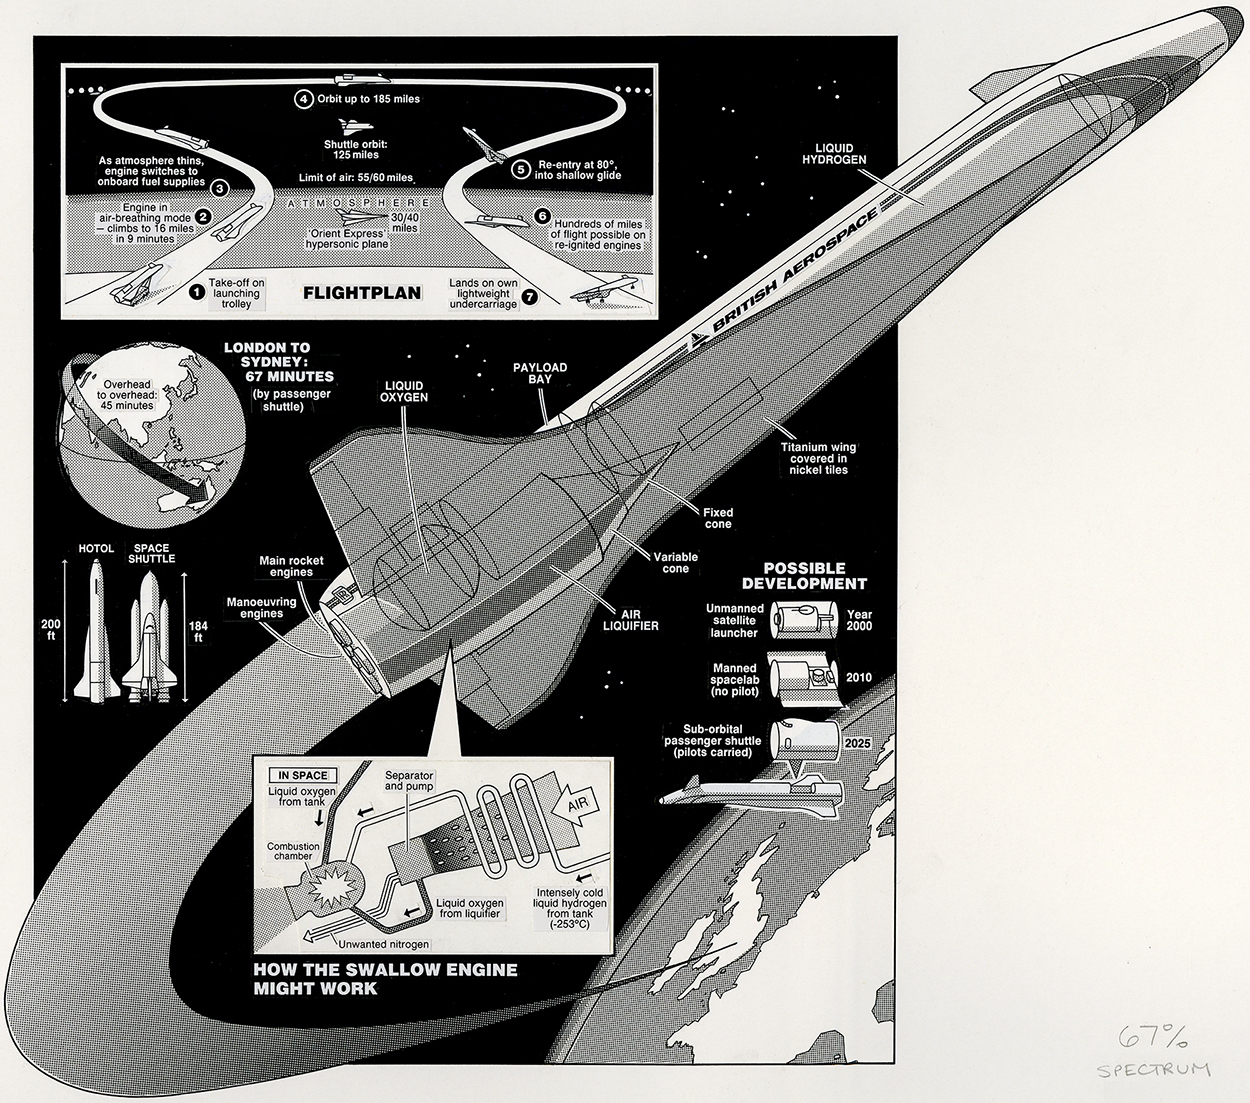
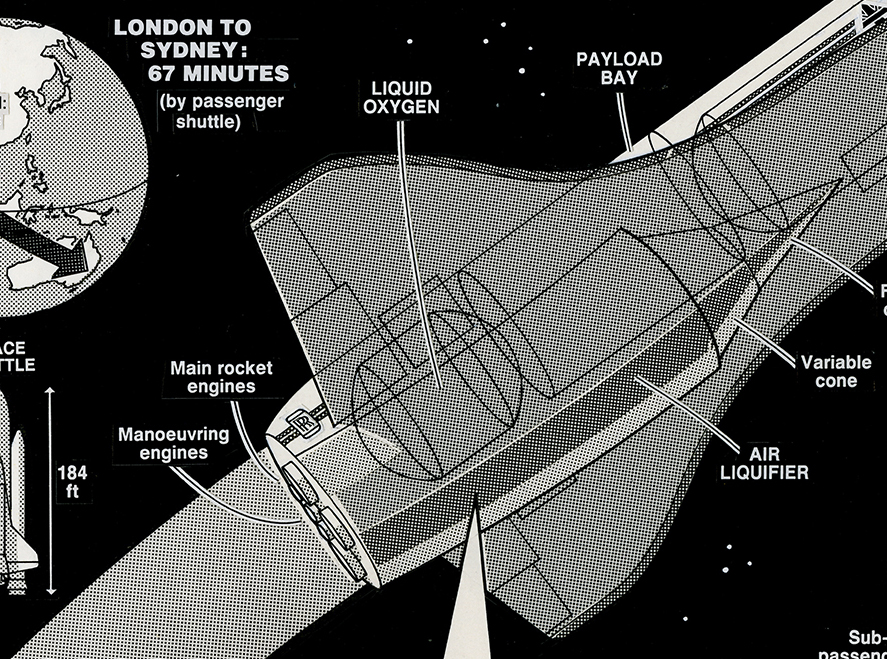
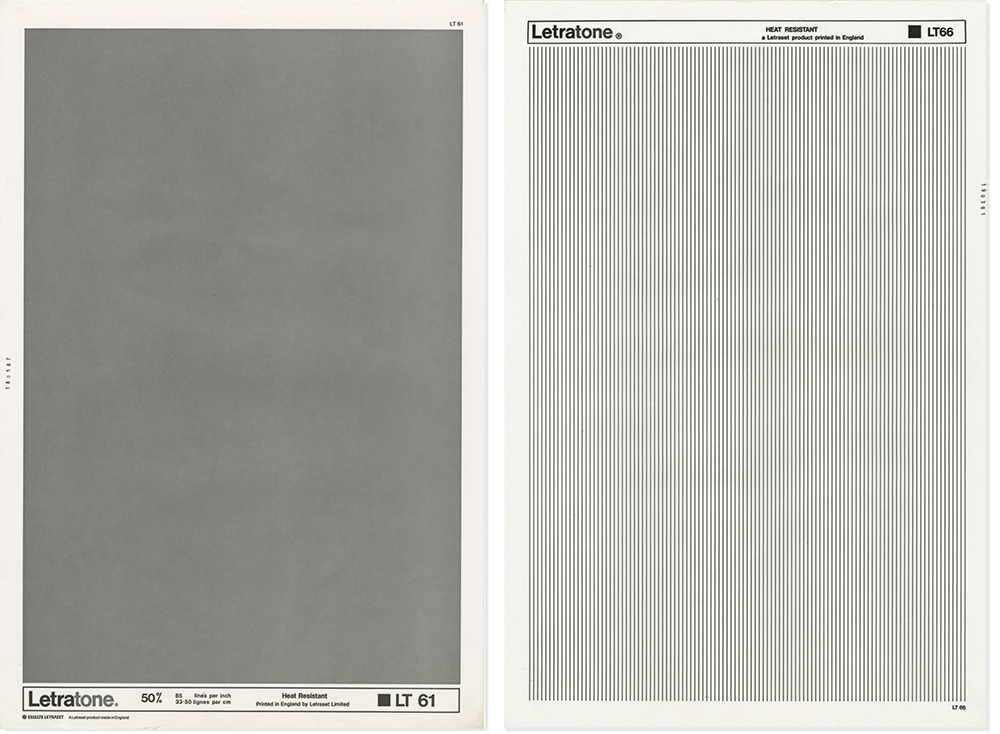
Back in the 1970s and 80s, Letratone ruled. (It was Zip-A-Tone and Chart-Pak in the U.S.) These sheets of adhesive-backed dot patterns and lines were vital to create the gray tones in line art, which was the staple of many print publications. With a variety of sheets, and a sharp knife, you could go crazy adding various grays, gradations, and all manner of line effects. Of course, you had to make sure that you were using the correct line screen for the reduction, otherwise the whole thing could fill in. This example is borrowed from the Grimwade National Archive (which is basically a drawer in someone else’s office). In the detail especially, you can see that the shrinkage of the adhesive tone over the years has left some white gaps. This would not be easy to fix without damaging the line art, so it will probably stay like this.

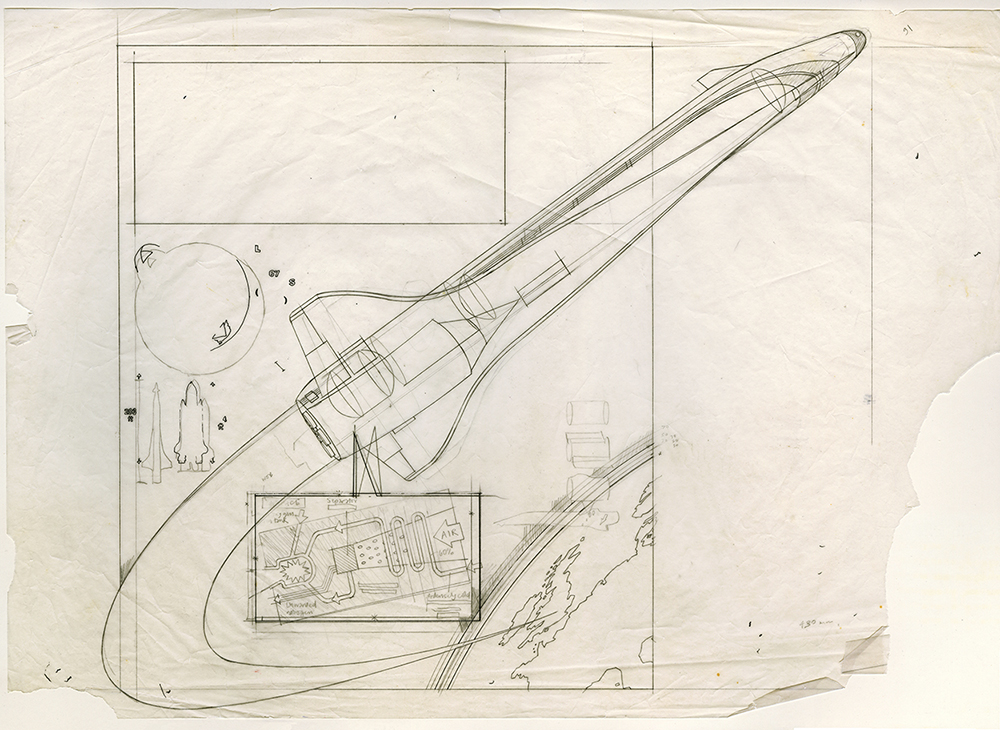
Below is the rough drawing that I started from. More roughs: https://www.johngrimwade.com/blog/2016/10/10/the-rough-idea/

I just purchased two sheets of Letratone on eBay. They arrived in pristine condition.
Coming soon Professor Michael Stoll (who has featured in number of posts) is putting on an exhibition of my work in Munich, from March 9 to 11, at the EDCH and INCH conferences. He has scanned a lot of the original art, and generally put a shocking amount of time into the whole process already. There will be several clear cabinets containing pieces of artwork, and some of the equipment used to produce it, plus posters showing how the art looked in the printed form. The exhibition is a comprehensive view of my career from analogue to digital.

The conference is in two parts: EDCH is Design and INCH is Infographics. I’m also running an infographics workshop. Perhaps I will see you there!

Design: http://www.edch-conference.com

Infographicshttp://www.inch-conference.com

Workshops: http://www.inch-conference.com/en/workshops

Tools of the trade

INFOGRAPHIC GEAR BEFORE THE COMPUTER.

Need a circle? Use this.

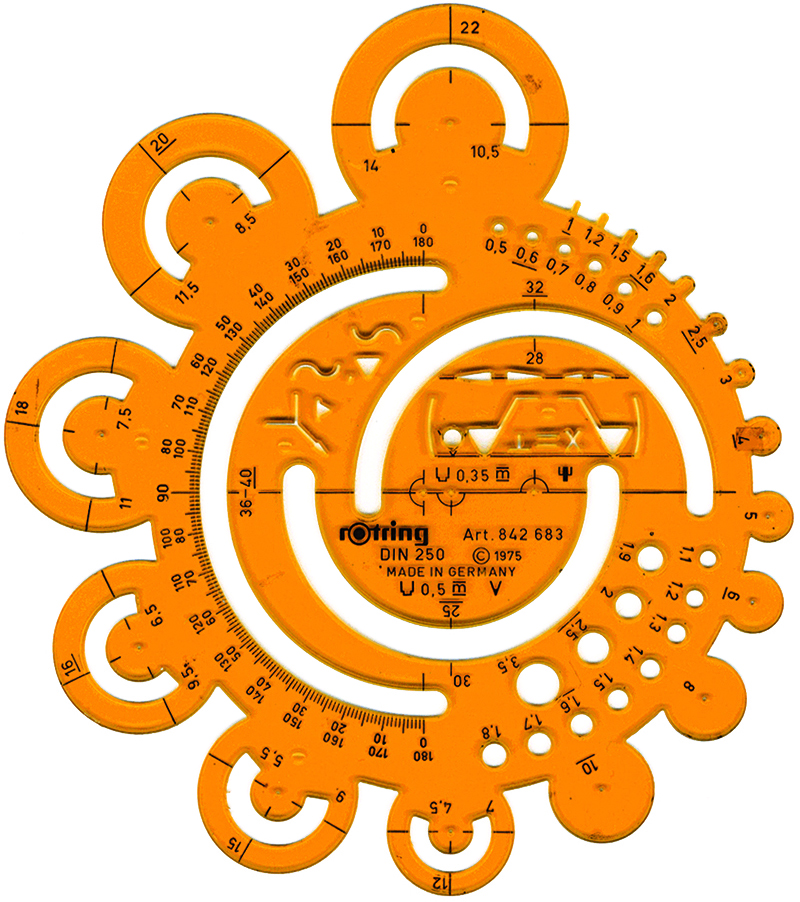
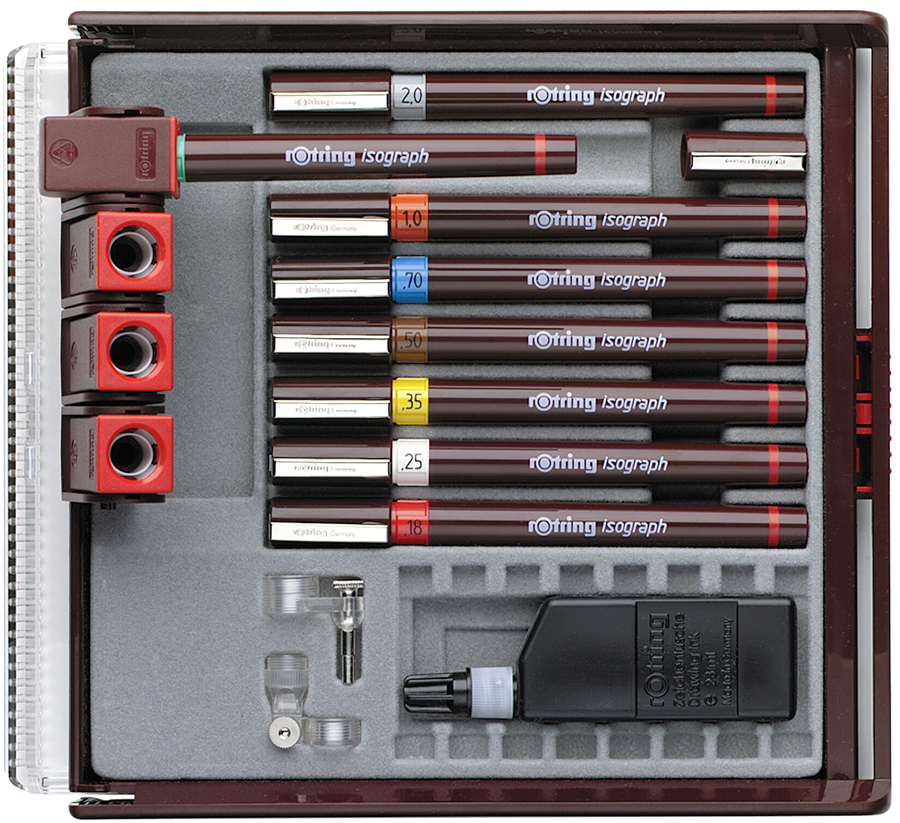
When I started making infographics, every freelancer in the business carried a briefcase everywhere they went. It was filled with all the equipment needed to make artwork. You needed technical pens, french curves, ellipse templates, compasses, ruling pens, paintbrushes, a craft knife, and so on. We spent a lot of time in art supply stores, buying designer’s colors and inks and everything else. I still love those places more than any other shops, although there are a hell of a lot less of them around now.

There were some problems that we don’t have today. If you ran out of ink on a Sunday, you were finished. Stores were closed for the day back then. Then there were the accidents: cuts from very sharp knives, bottles of ink knocked over onto elaborate artwork, airbrushes suddenly spitting paint over beautiful backgrounds.

Yes, it was stressful, but it was also a craft, and it felt like one. Like making furniture or pottery, or something arty. We were artists, or at least we thought we were. After all, we used some of the same gear, just no beret or white smock.

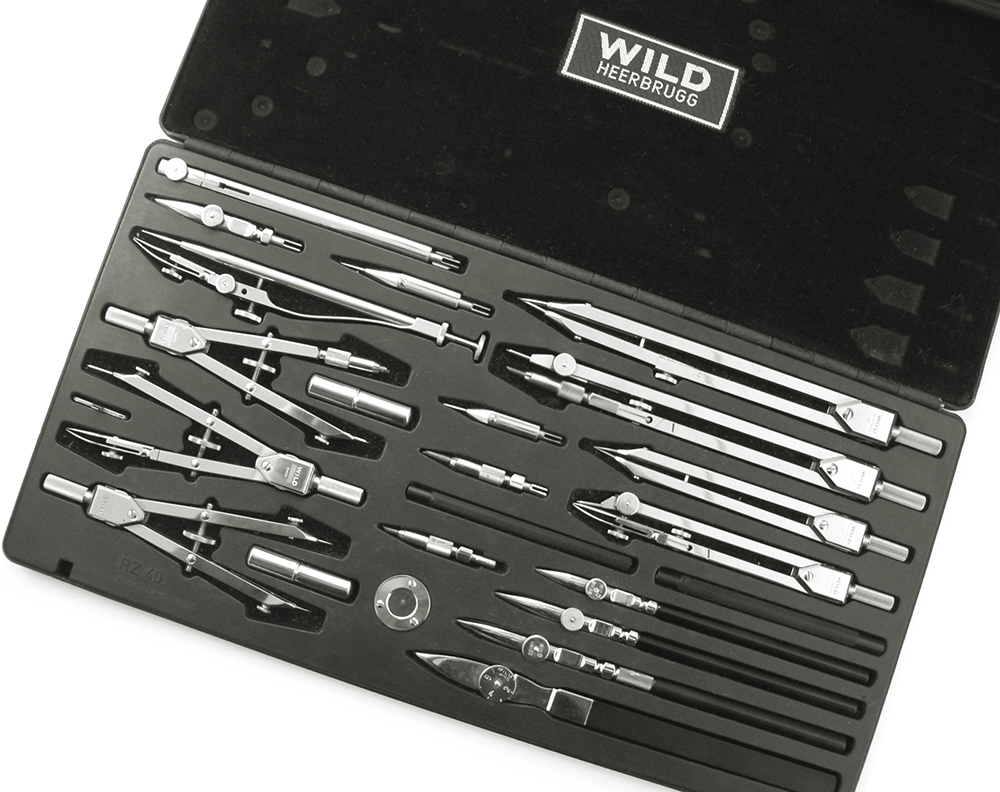
This compass set once belonged to Peter Sullivan, and was used to create numerous classic infographics. It is Swiss-made and is wonderful to use. It contains ruling pens and compasses of various sizes, including a drop-bow compass for very small circles, and an extension bar for large ones. Notice the small circular stand that lets you draw a circle without the compass point making a hole in the artwork.

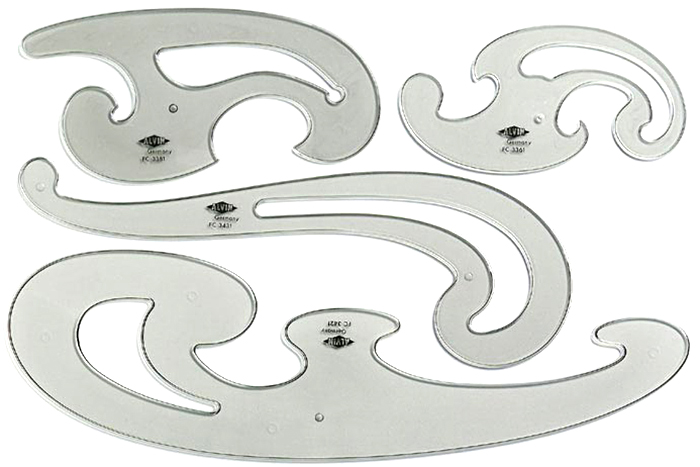
French curves were essential. I had some wooden ship curves for long, gentle arcs, and a difficult-to-use Flexicurve (a plastic bendable rod).

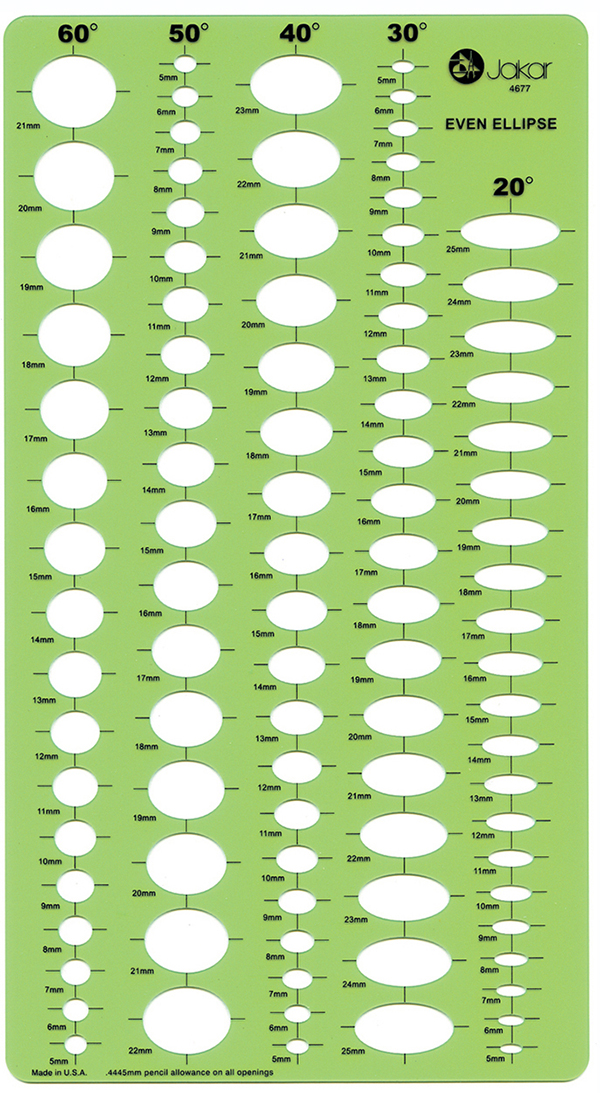
Ellipse templates were needed in multiple degrees and sizes to draw all the perspective circles in a piece of art. In a rough drawing, I would note the ellipses needed for the artwork, otherwise it meant painstakingly matching them up to their respective templates again. I had many of these crammed into my briefcase.

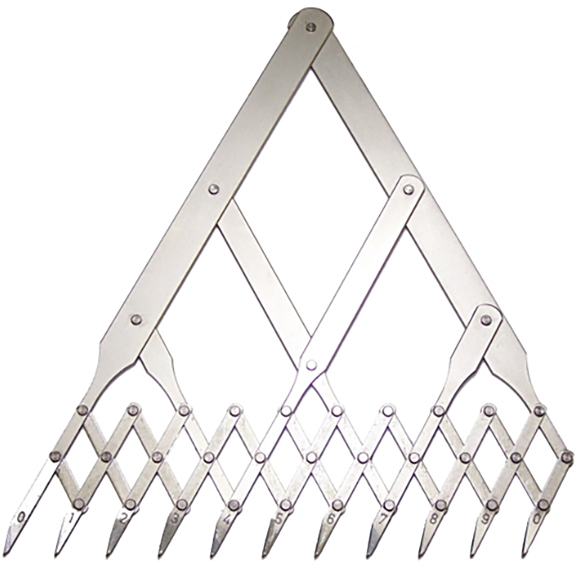
A more exotic instrument. The eleven-point divider was used for division of a line into up to ten equal sections, such as a scale on a chart. I never really used it, I just liked opening and closing it.

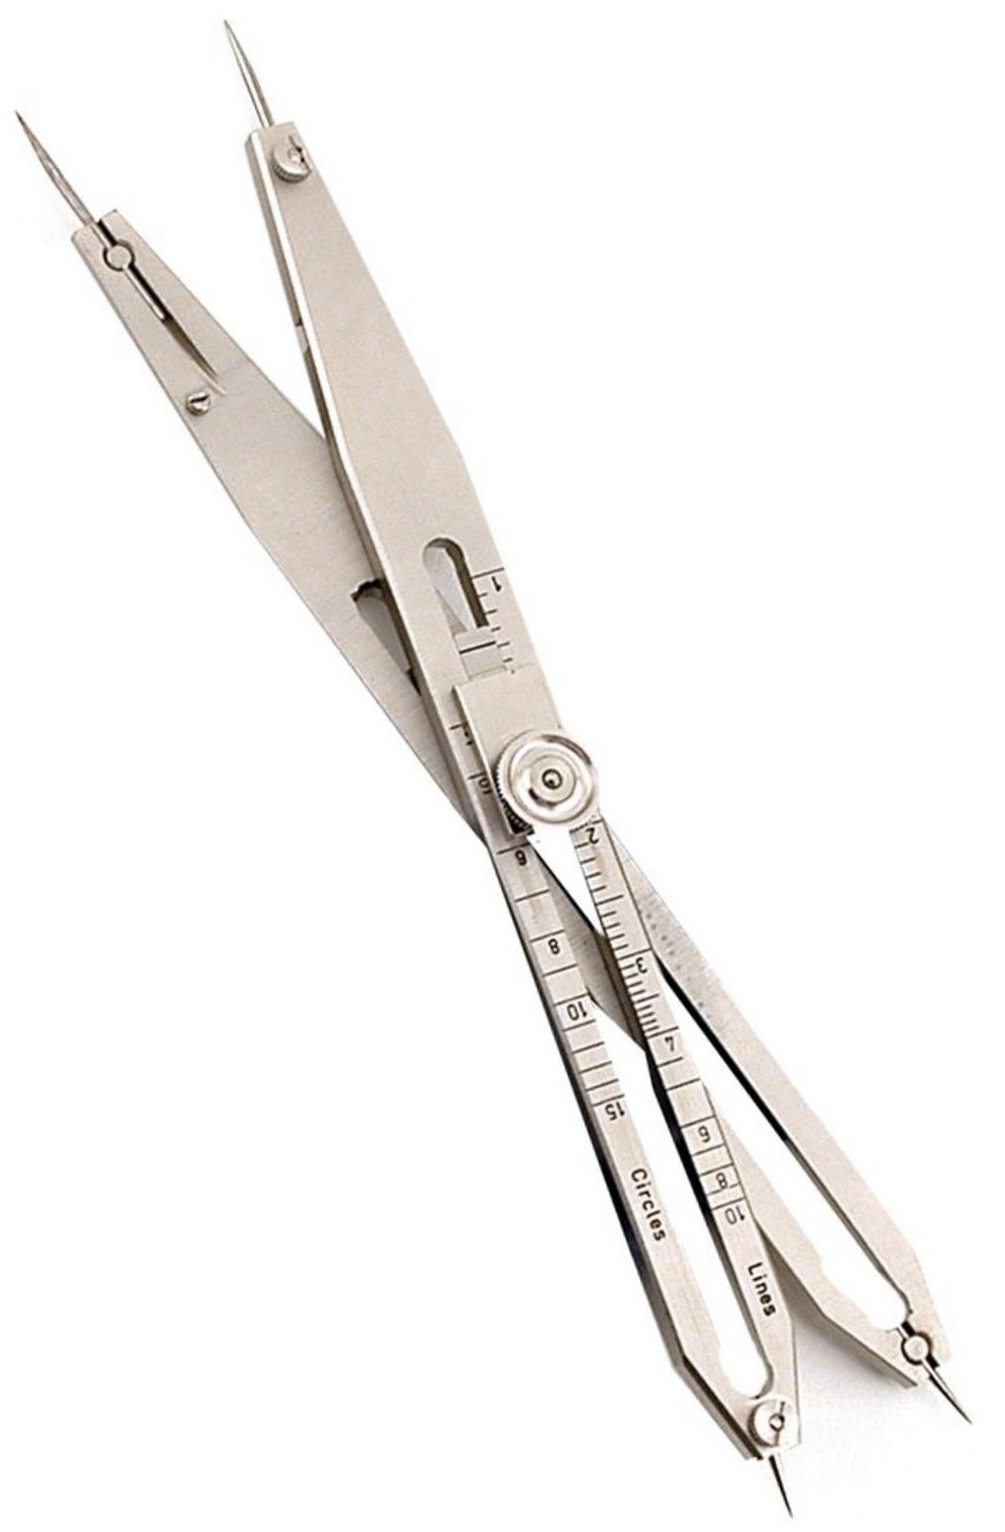
Below is a proportional divider. Used for transferring dimensions from one scale to another, or for dividing up lines equally.

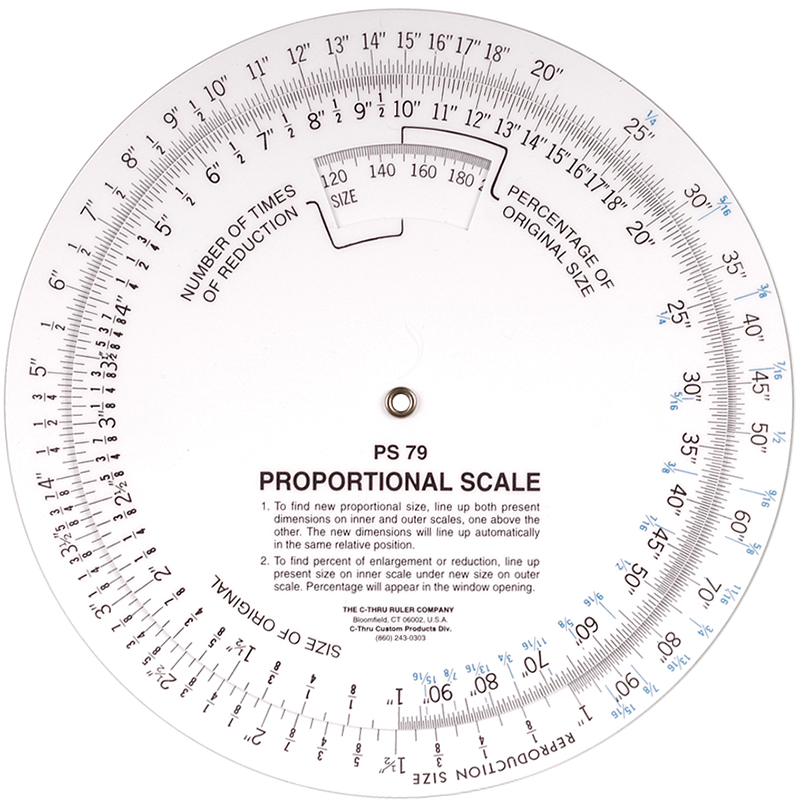
A proportional scale for working out scaled sizes was a staple of design departments back in the dark ages.

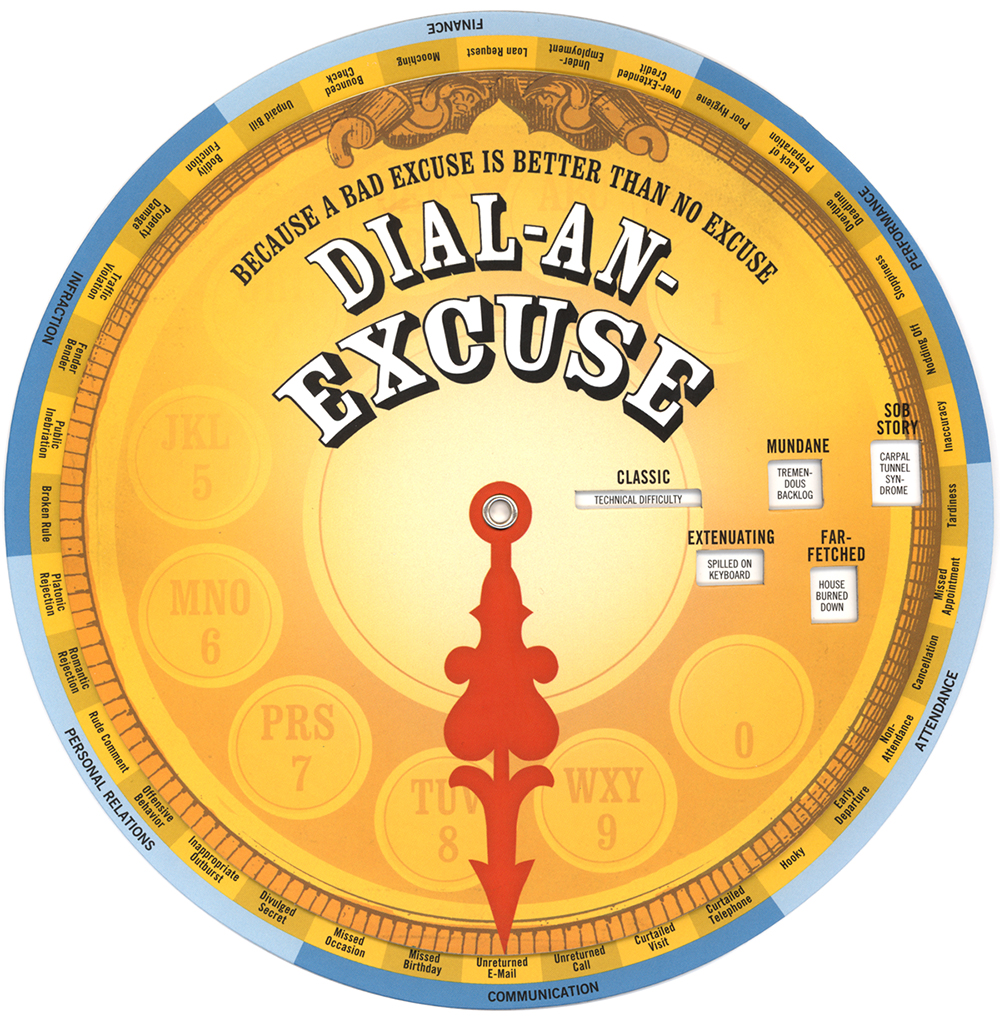
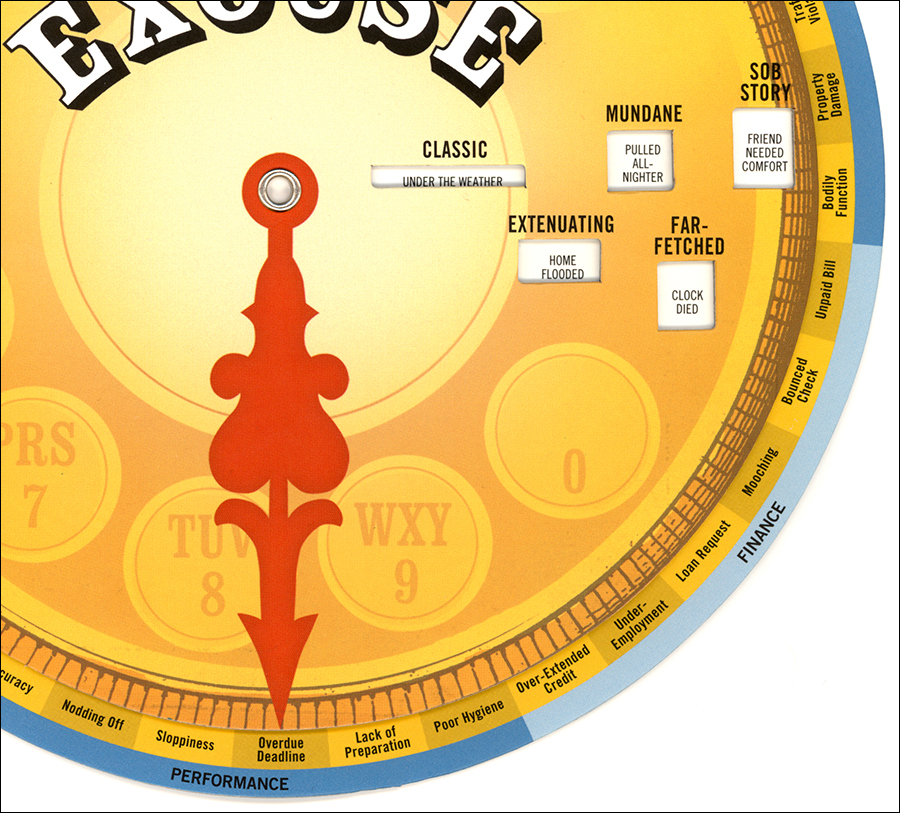
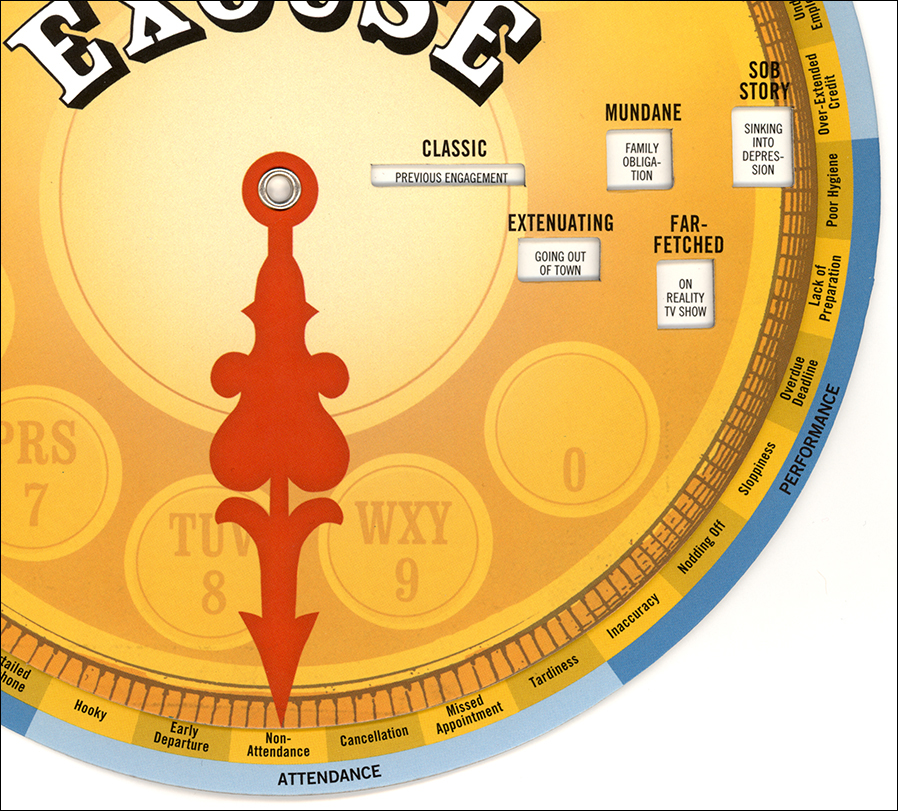
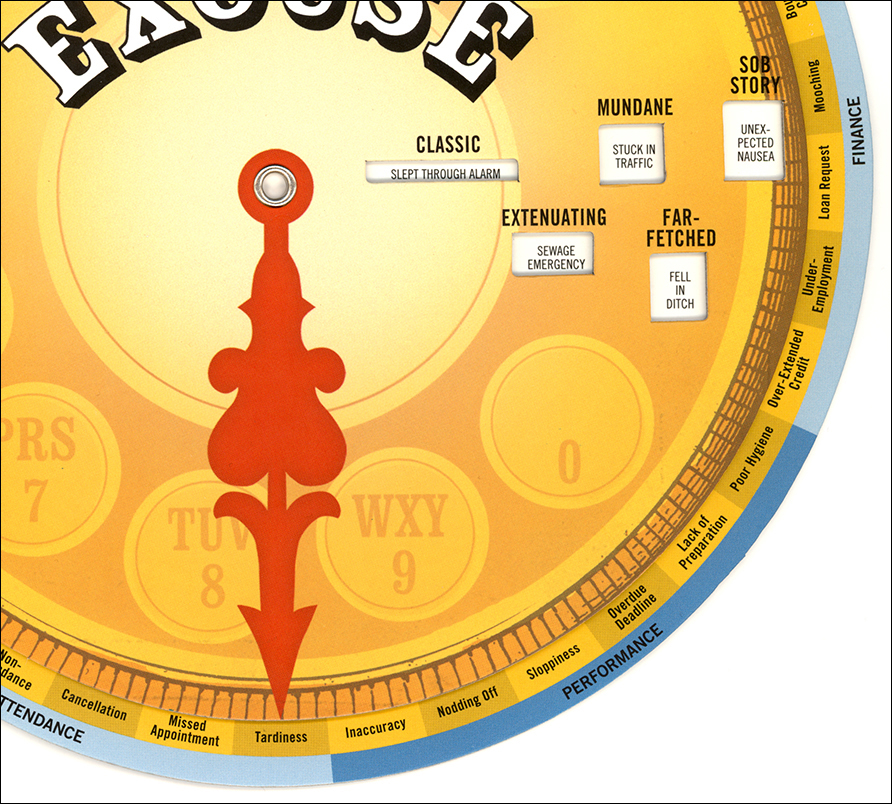
Wheel of excuses

EXPLAINING AWAY VARIOUS PROBLEMS.

In 2017, dialing up some useful excuses could come in handy for freelancers, professors, students, and everyone else. I’ve often needed something creative to calm down an anxious client. Unfortunately, this wheel doesn’t seem to be available right now (except perhaps on eBay), but when it reappears, you might want to get one. No batteries required.


CARDBOARD INTERACTIVES (PART 2)

On a more serious note, this is the second part of a wheel charts post that I ran last week. The first part is here: https://www.johngrimwade.com/blog/2016/12/26/cardboard-interactives/

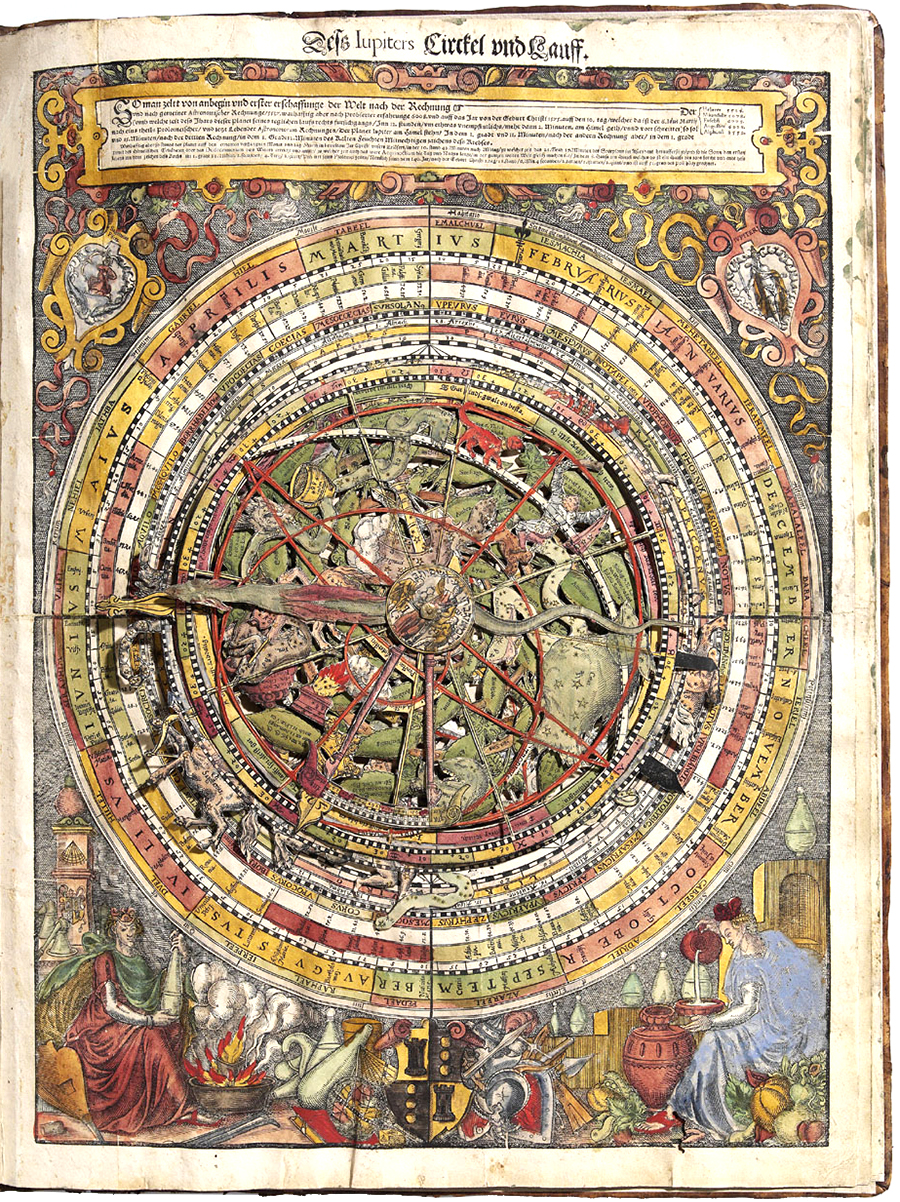
An astrolabe (astronomical calculator) from 1575.

Cardboard interactives

BEFORE THE INTERNET, WE HAD ROTATING INFORMATION INTERFACES.

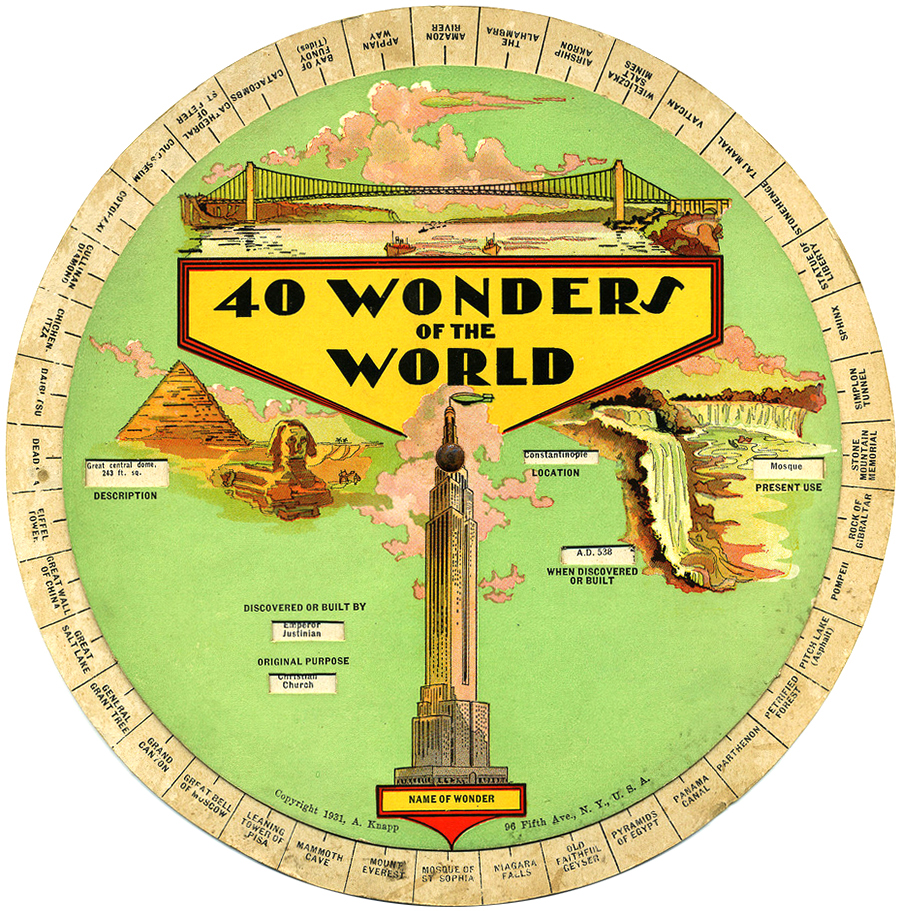
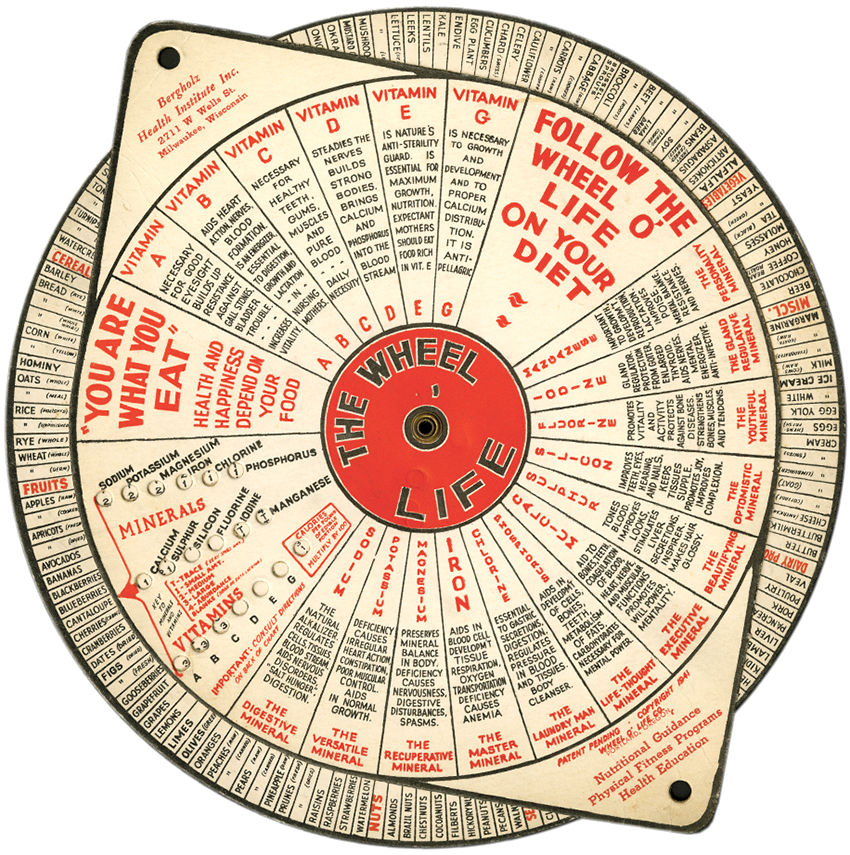
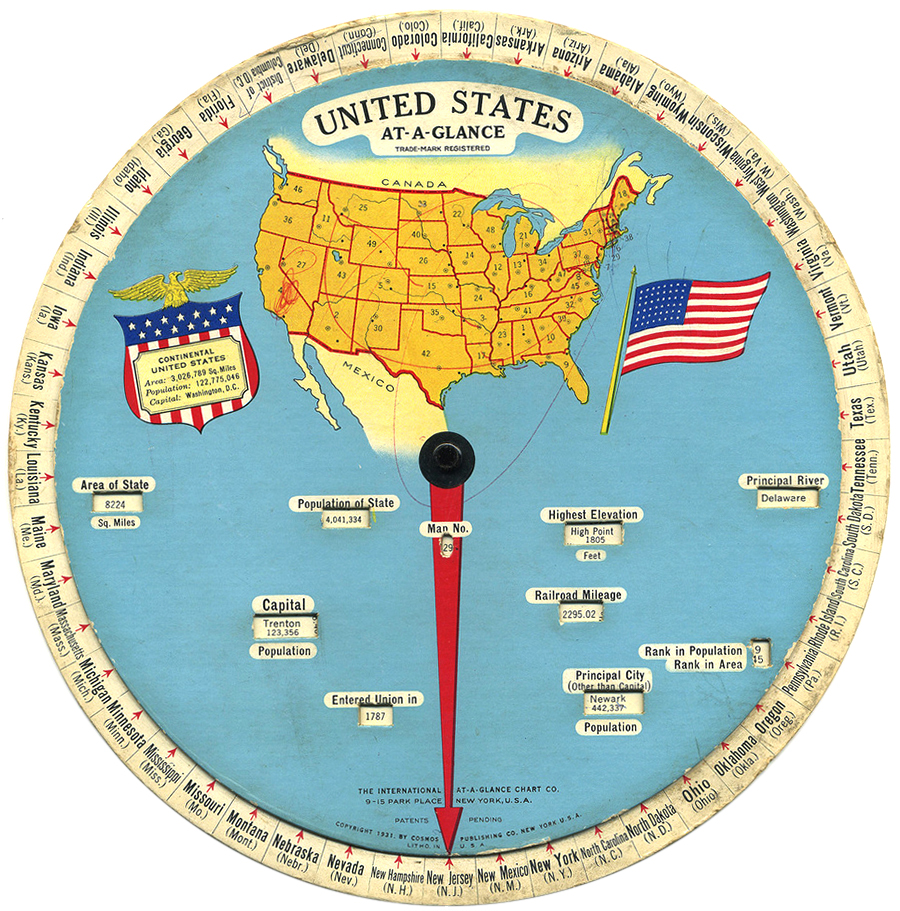
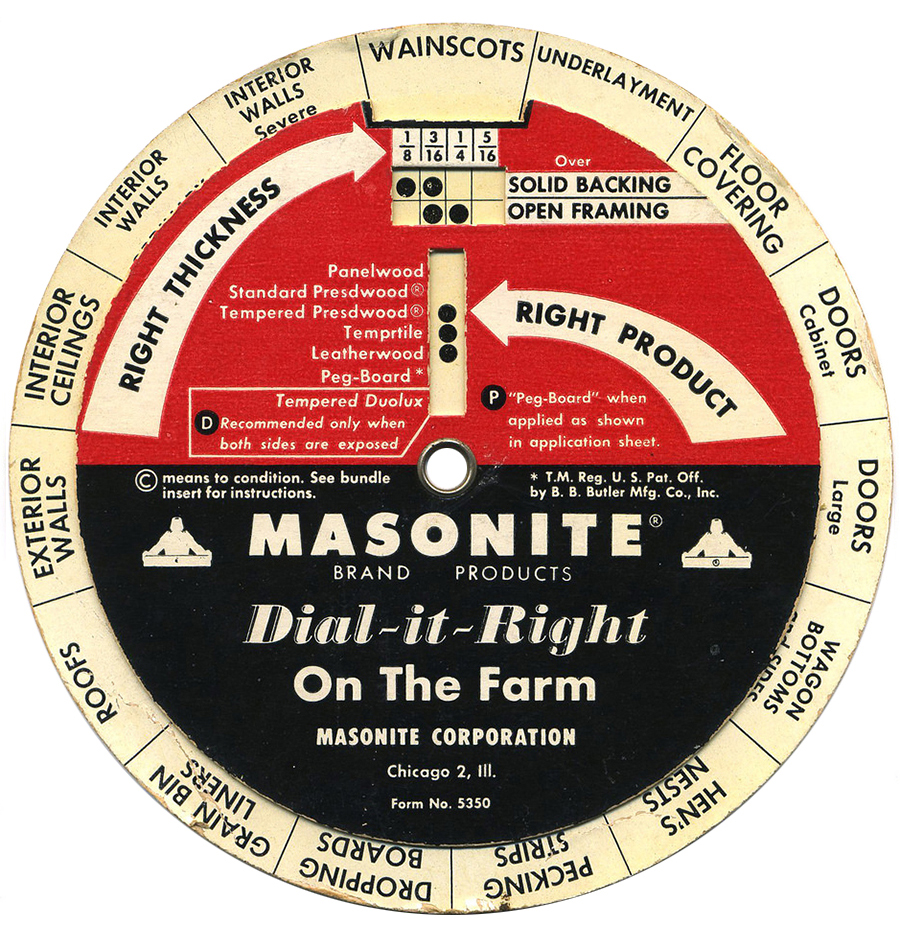
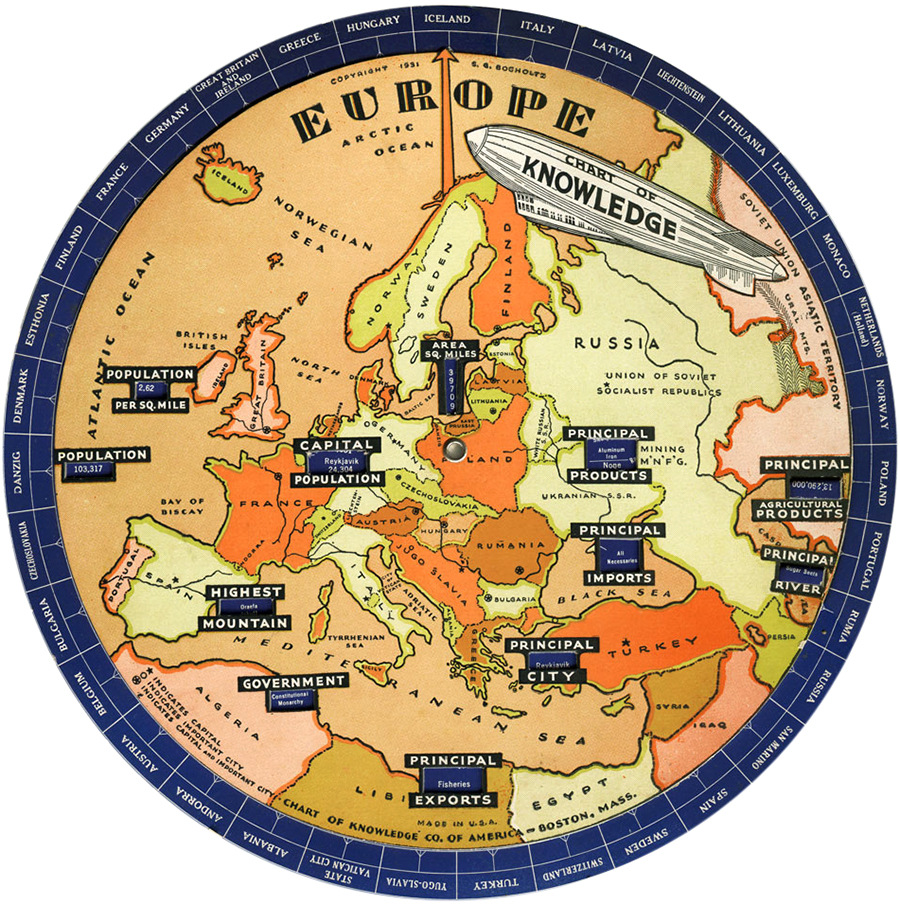
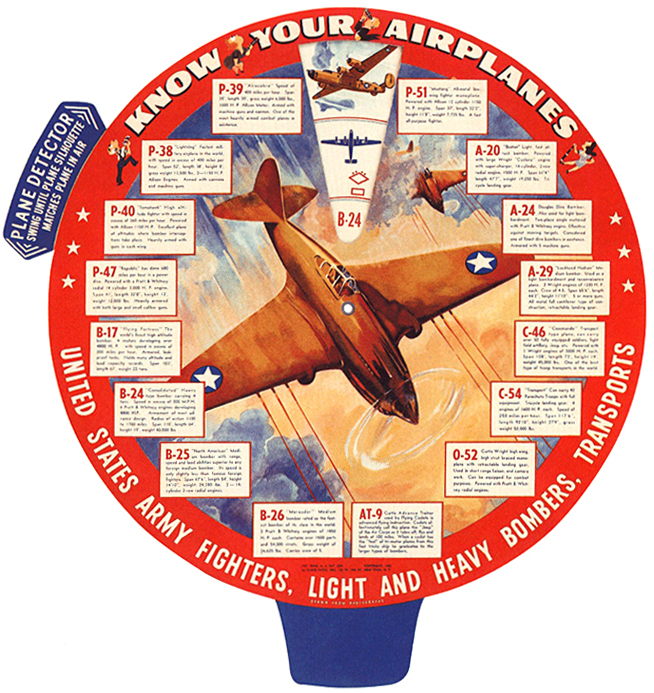
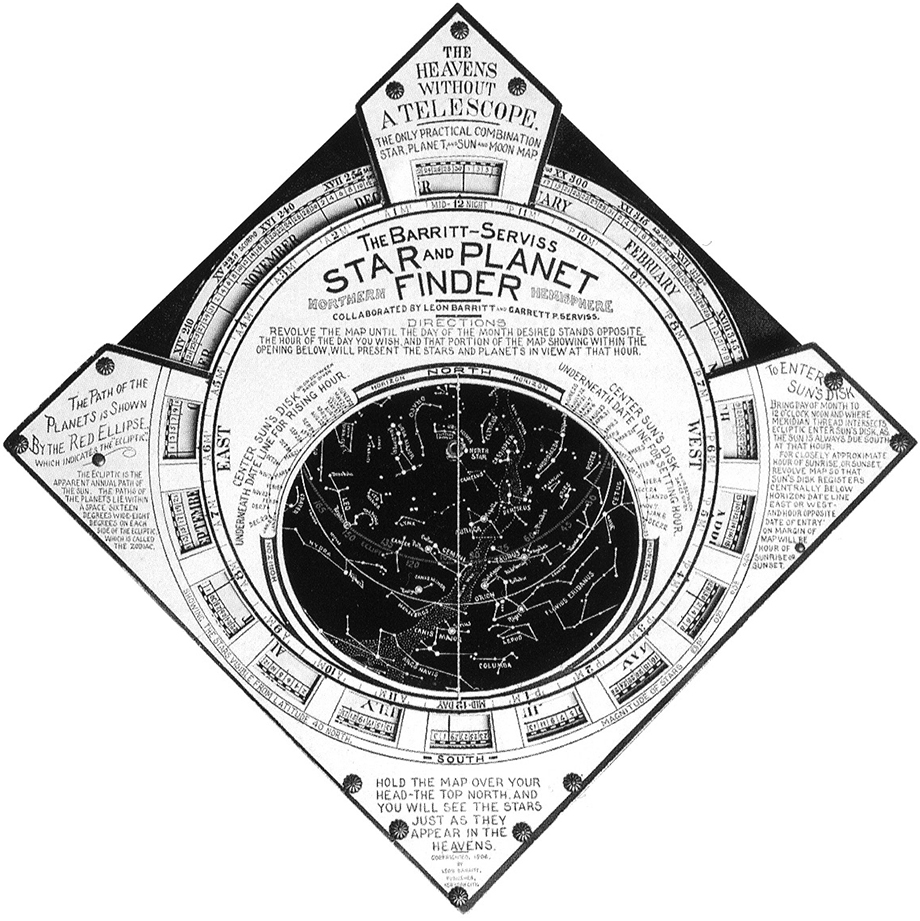
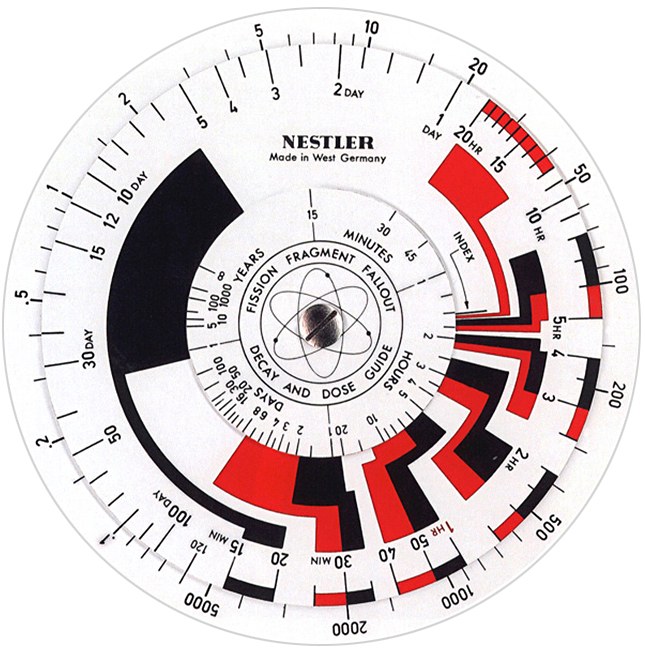
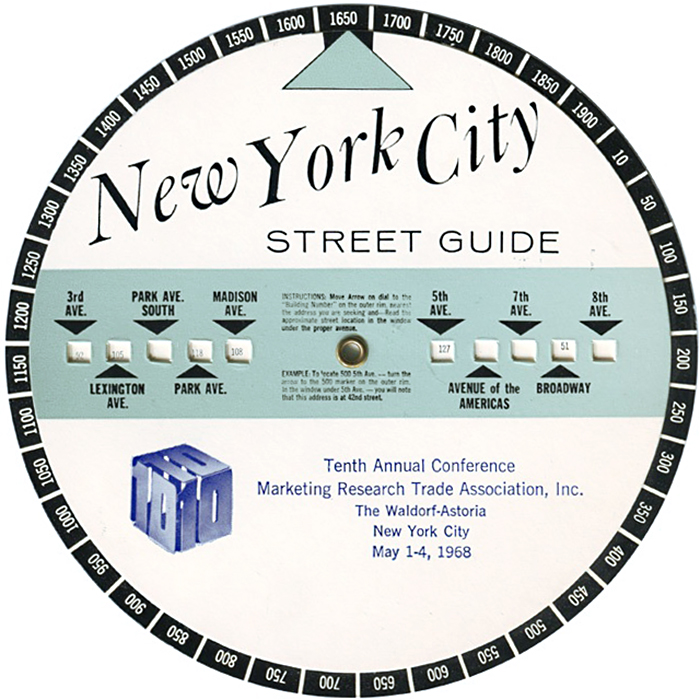
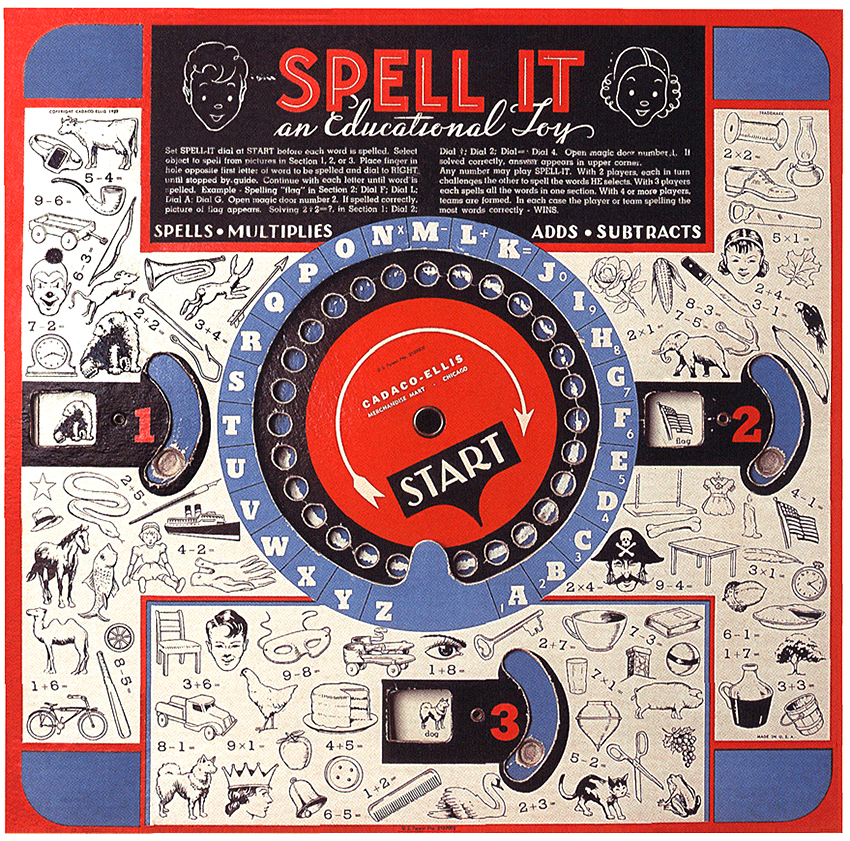
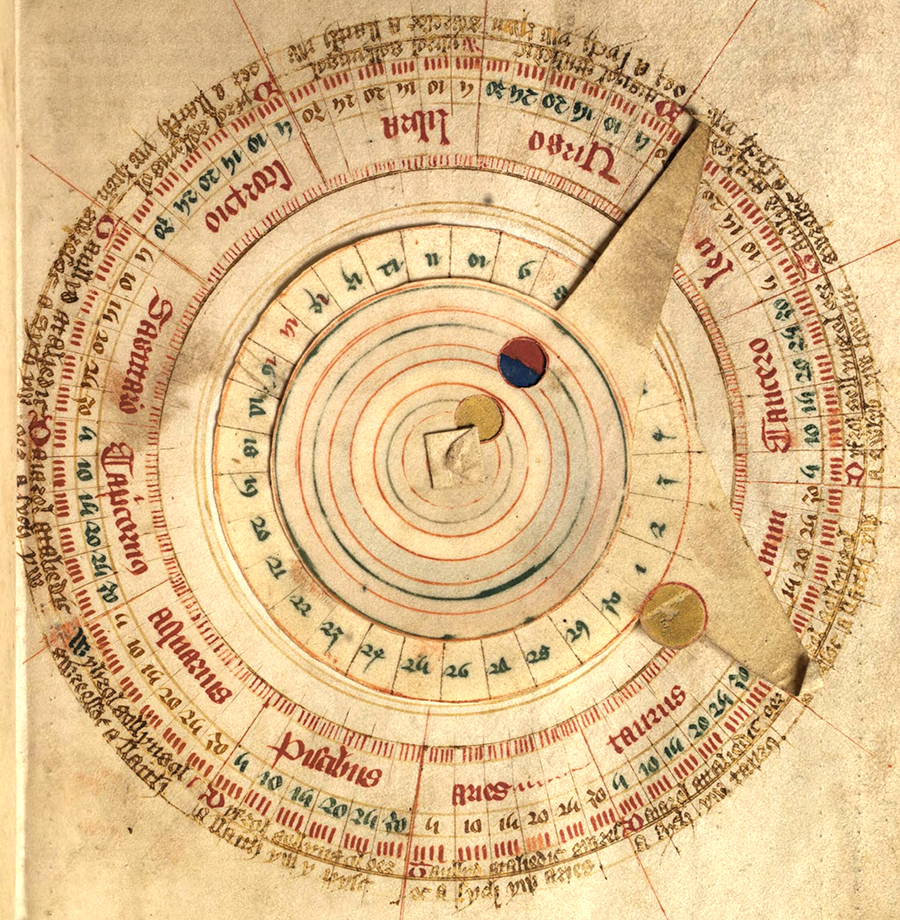
Long before online interactivity, there were rotating wheels (known as wheel charts, or volvelles). They often contained a lot of information and delivered it in small, user-controlled amounts. Isn’t that exactly what we’re trying to do today? There are several examples in Jessica Helfand’s excellent book “Wheels of Invention”: goo.gl/QrLZNx

HISTORY

Wheel charts have been around a very long time. This one, from the 15th-century, is for determining the position of the Sun and the Moon in the zodiac.

(National Library of Wales)


The Eagle

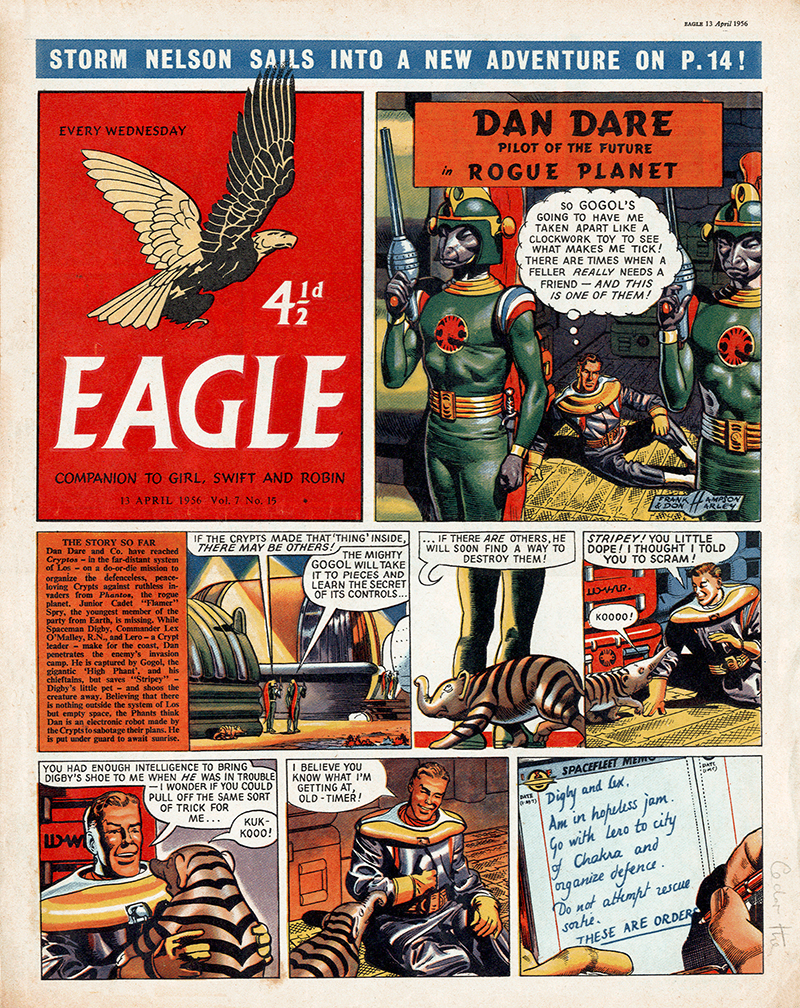
A GROUND-BREAKING ILLUSTRATED CHILDREN’S COMIC.


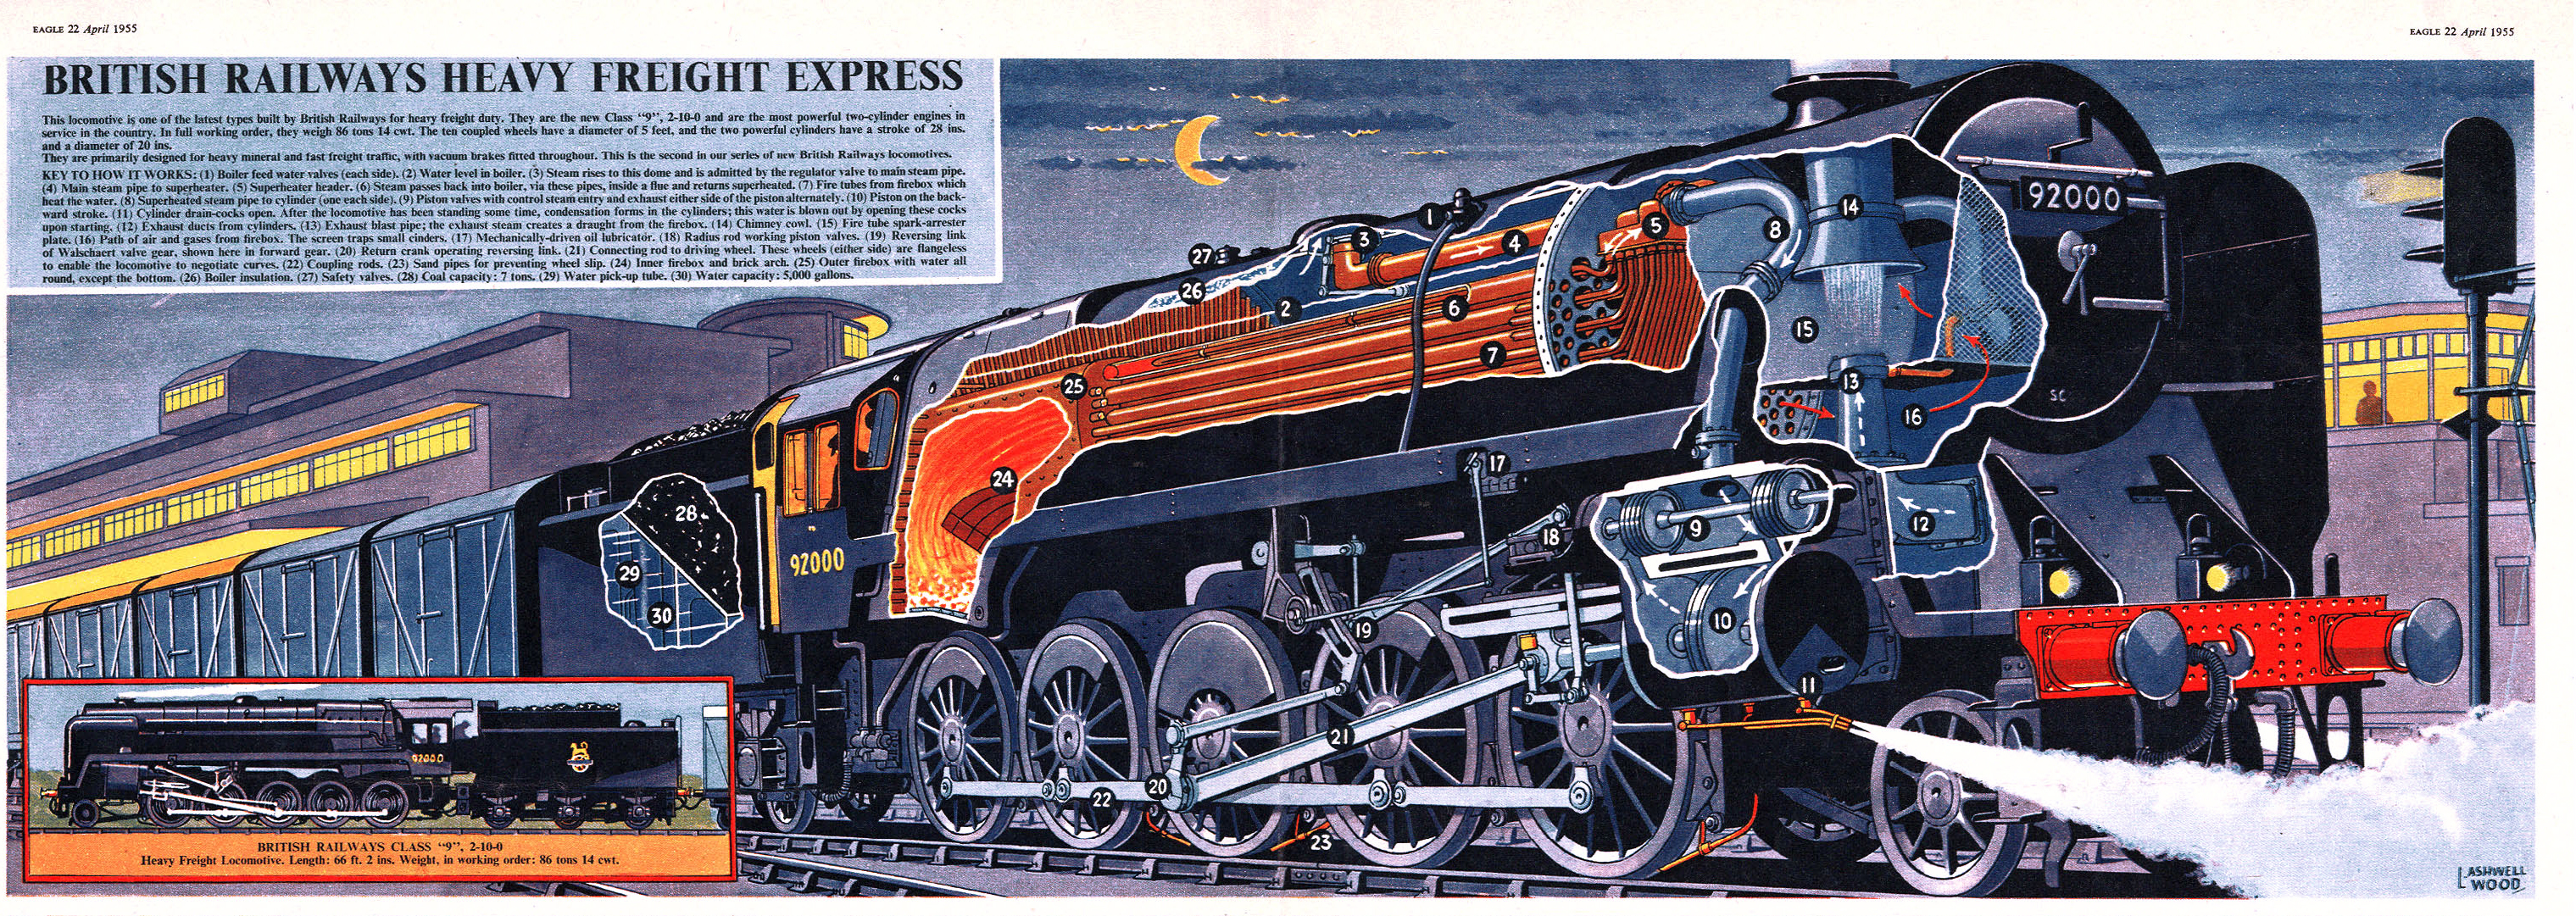
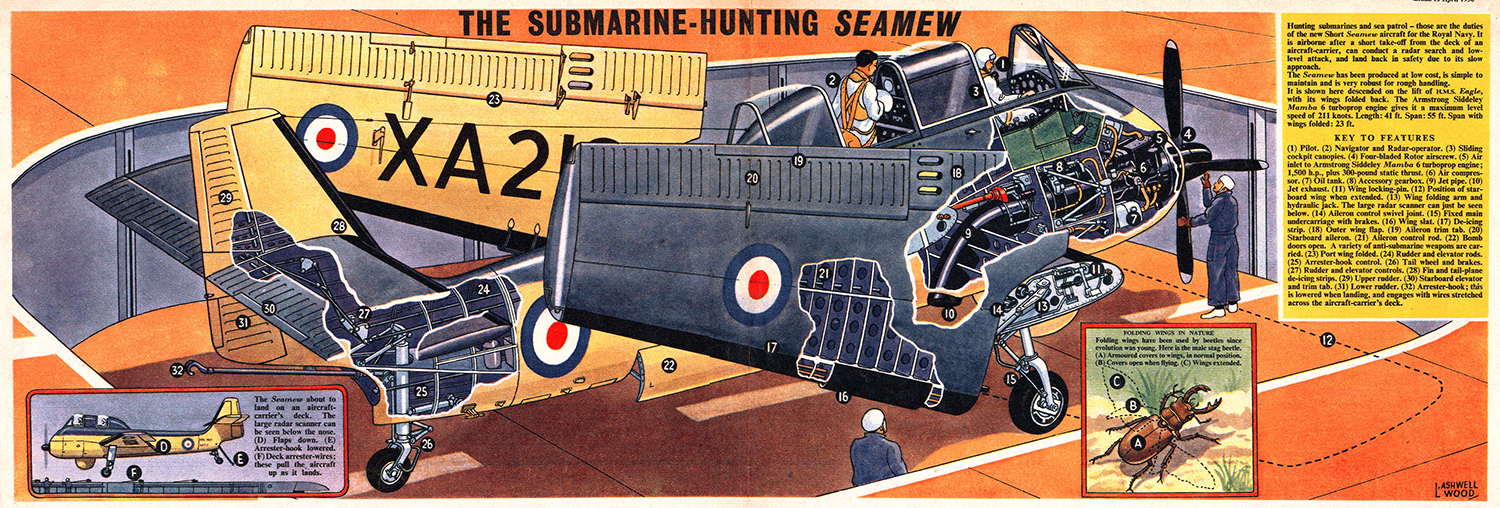
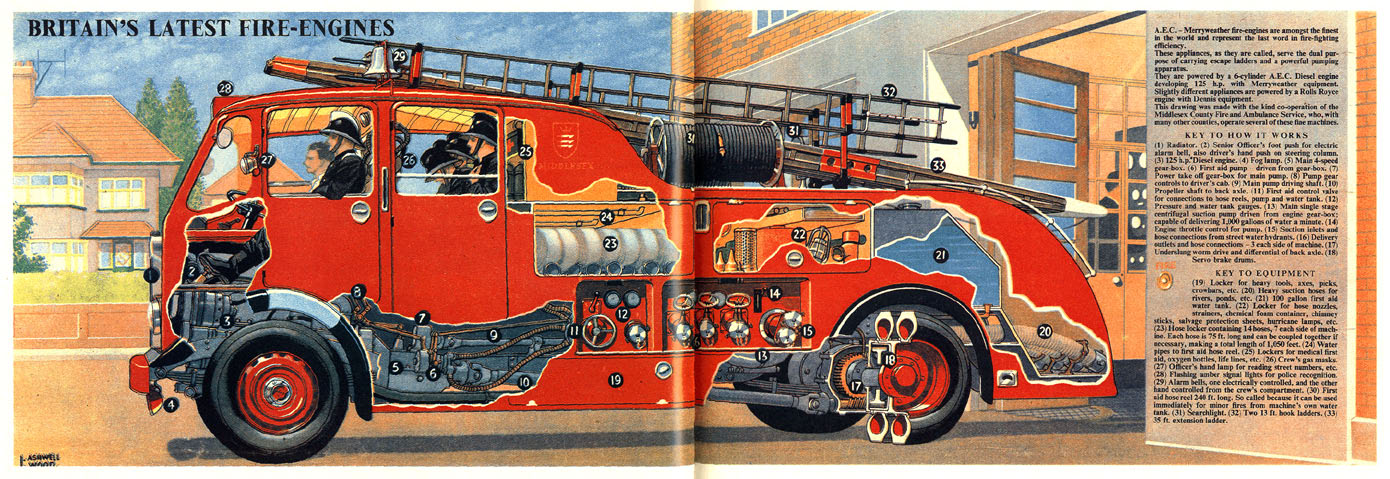
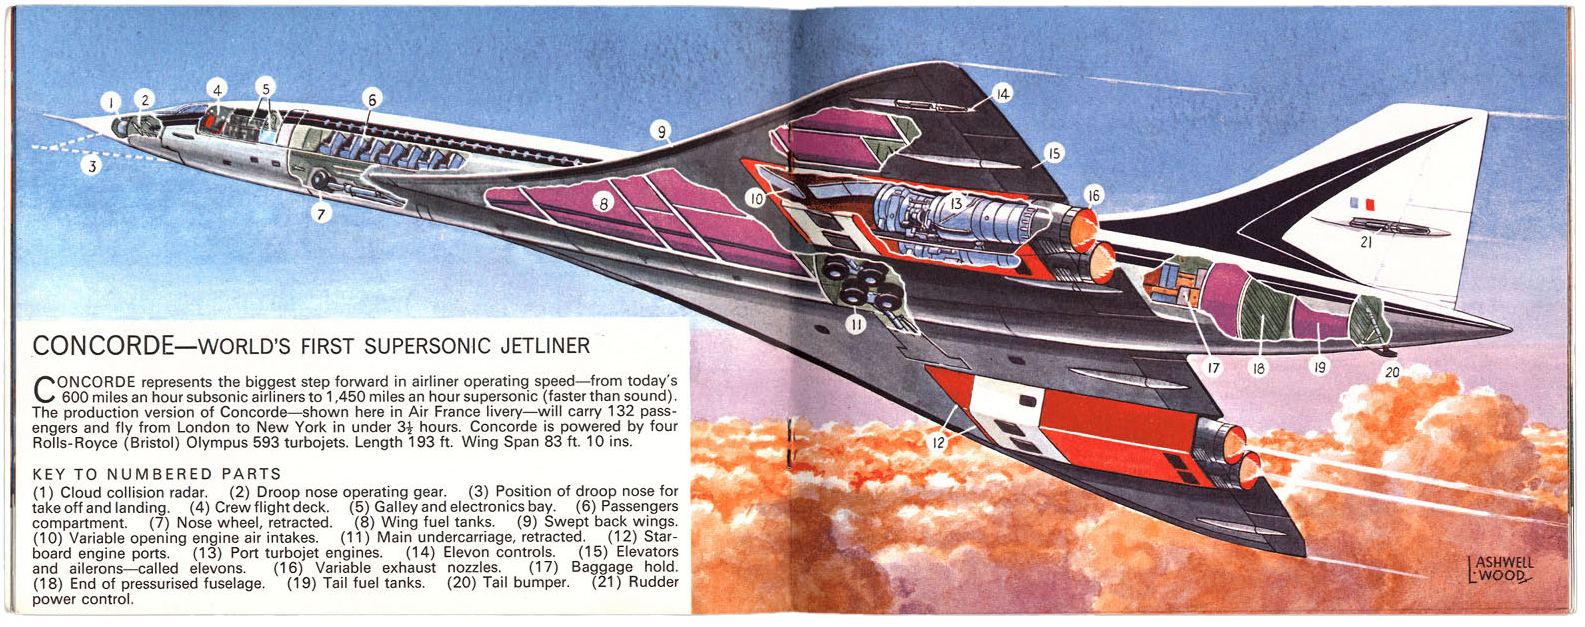
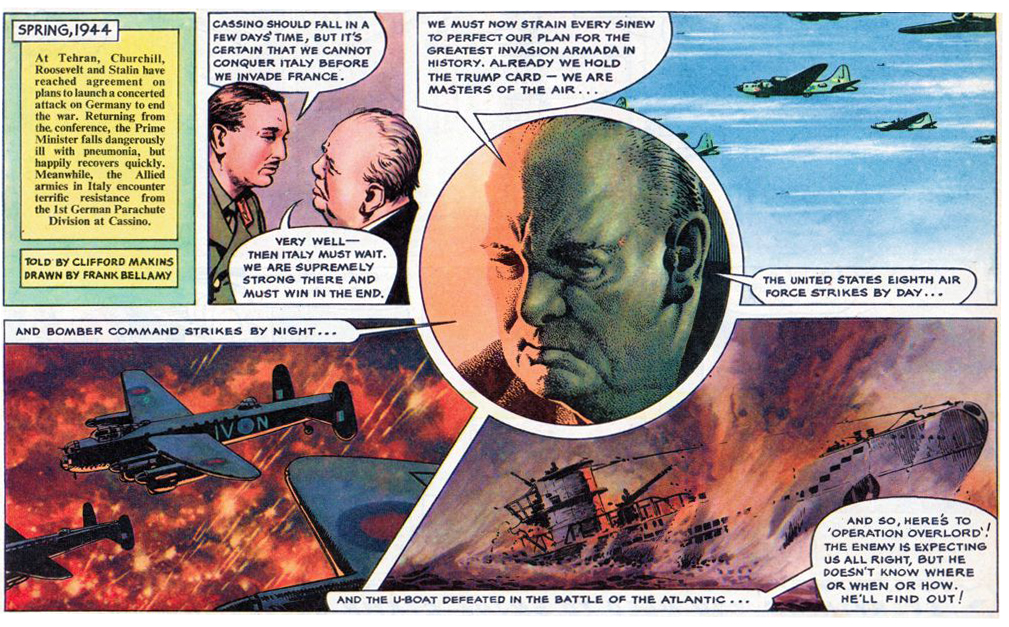
Published between 1950 and 1969 in it’s original form, the Eagle was probably quite influential on a couple of generations of potential British graphic artists. It was really successful, the first issue sold out the print run of 900,000 copies. Always beautifully illustrated throughout by a roster full of talent. As far as I’m concerned, three illustrators stand out. Frank Hampson, who drew the Dan Dare cover feature, L.Ashwell Wood, who illustrated the cutaways that were in the center of every issue, and Frank Bellamy, with his powerful use of color and space. Bellamy eventually took over the creation of the Dan Dare strip.

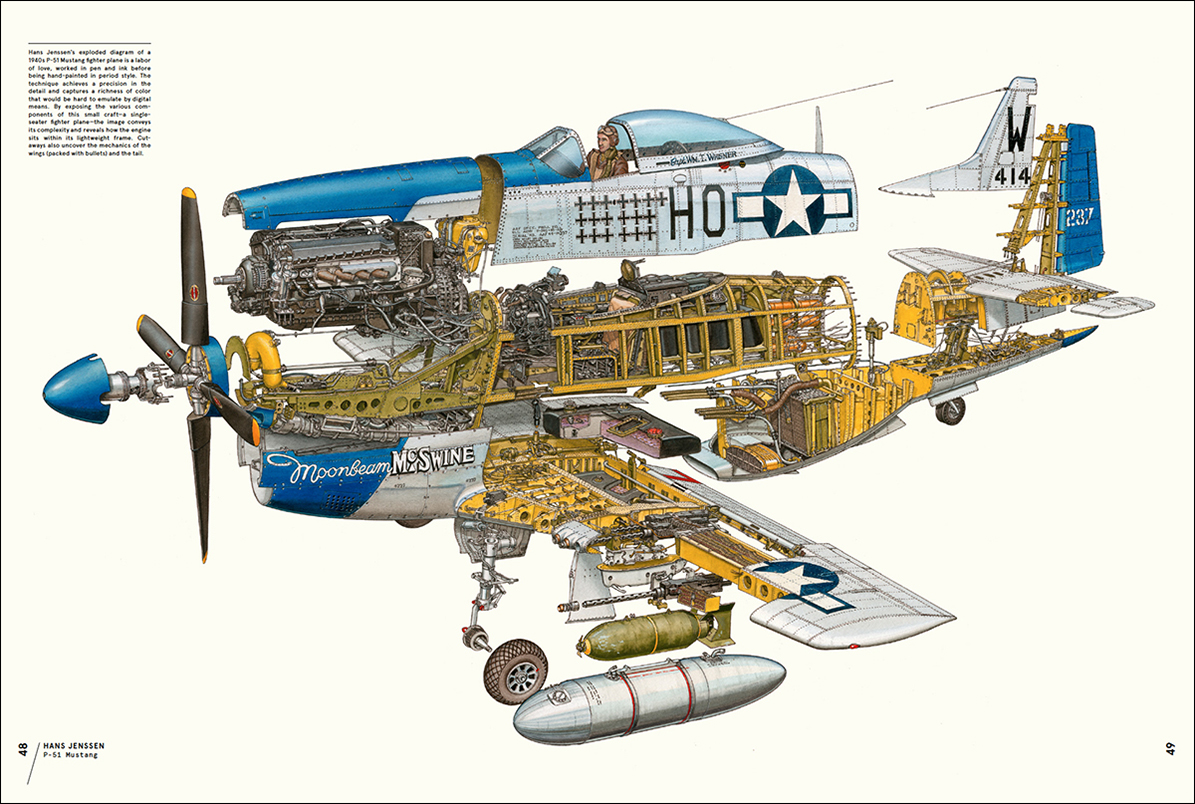
Below, cutaways by L.Ashwell Wood.

The Happy Warrior: The Life Story of Sir Winston Churchill by Frank Bellamy (dandare.org).

More Eagle here: http://www.dandare.org


Metal

INFOGRAPHICS USED TO MADE OF ZINC.

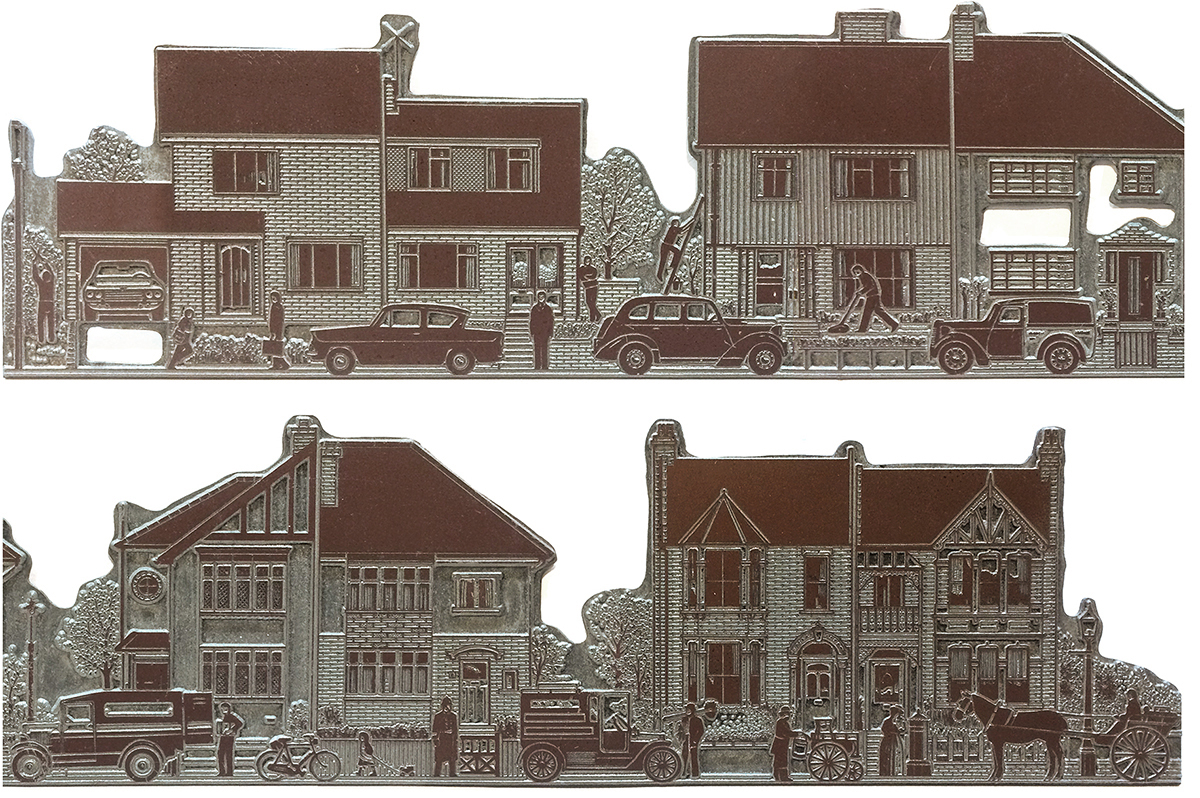
Unfortunately, I don’t have the (hand-drawn) original artwork of this graphic any more. Just the metal plate. It’s a relic of a pre-computer time, although this reproduction method is still used in traditional letterpress printing today. The plate is shown larger below to give a better idea of the details. The feature that contained this illustration was about the history of British residential architecture, and I tried to capture the different eras. From right to left in this reversed image.

THE PROCESS Artwork was drawn larger than the final size (150% or 200%). Then it was photographed with a line art camera, and that image was photo-etched out of a sheet of zinc to make the printing plate. The white areas were further removed using a router (the holes in the plate here), to make sure they would not be liable to pick up any ink during printing. In some of the indentations, you can see ink from proofs that were made directly from the plate before it became part of the page, and again after the page had been completely assembled.

HOT METAL That was the term for newspaper composition at that time. The type for the page was set on Monotype or Linotype typesetting machines, which were like giant typewriters with pots of melted lead feeding into moulds. The resulting metal type was locked together with the photographs and illustrations (mounted on blocks) in a metal frame called a chase. From that complete page, a flong (a papier-mâché mould) was made, and this was used to cast the curved printing plates that would fit onto the rollers of the huge rumbling presses down in the newspaper’s basement.

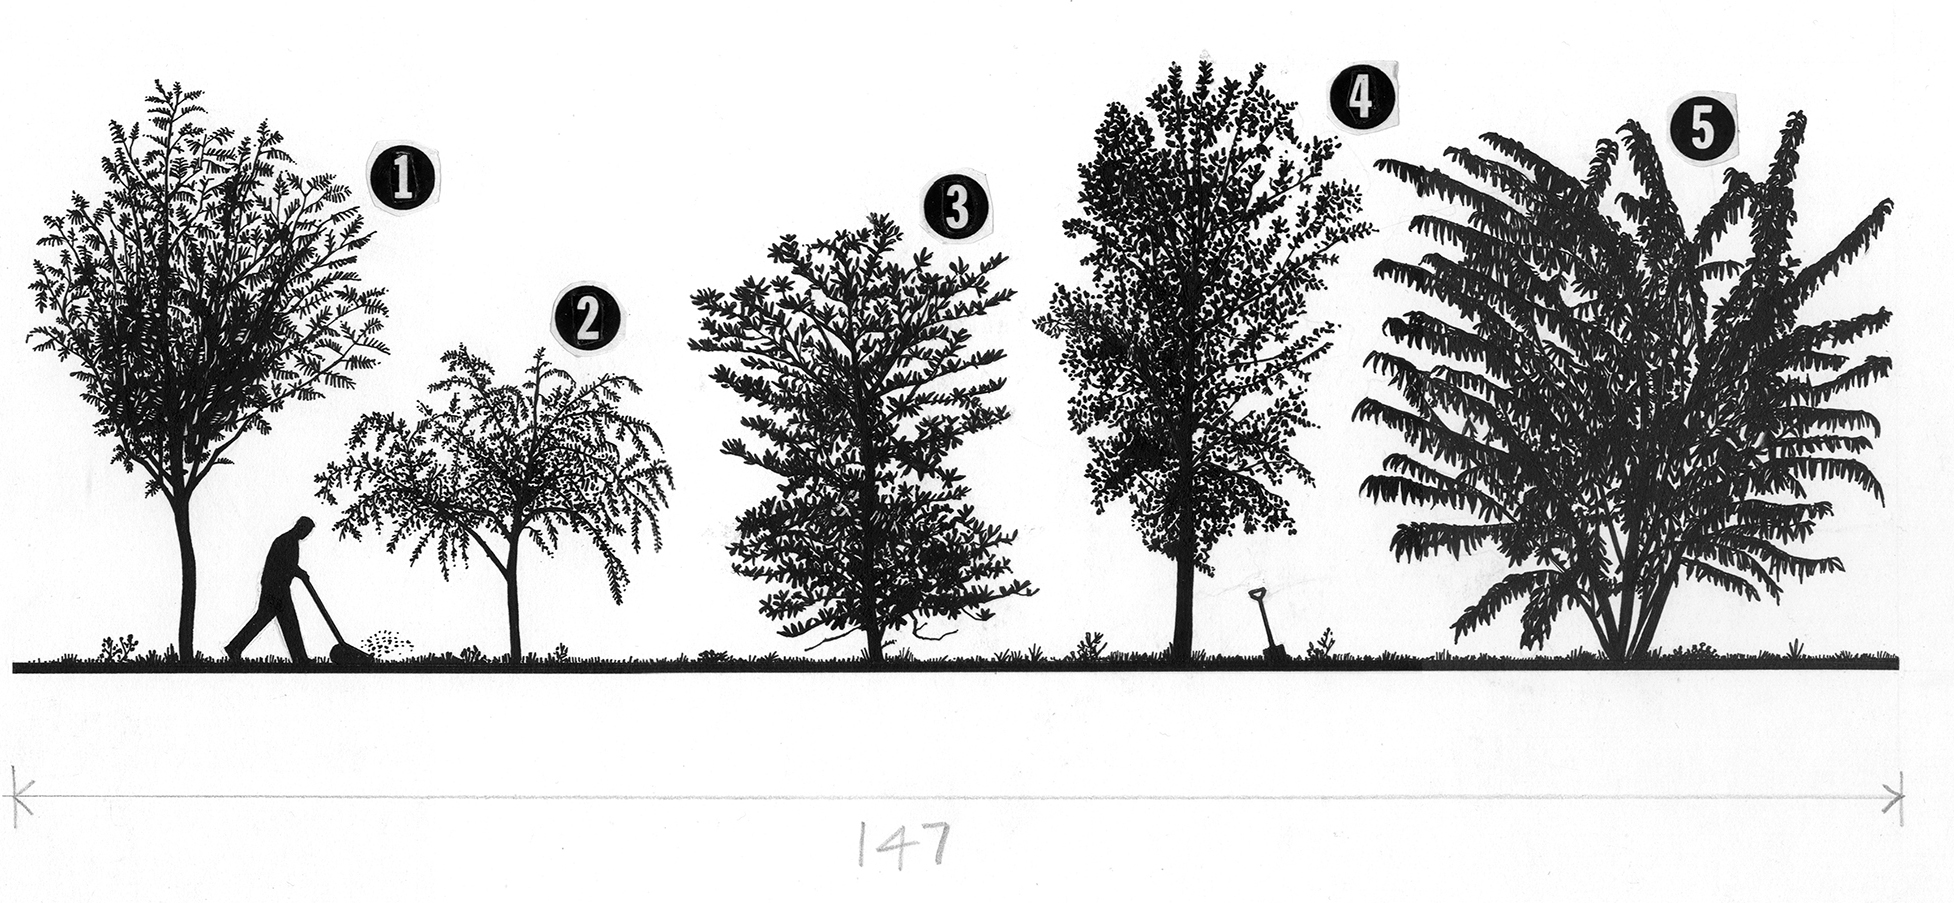
The artwork above was shown in an earlier post (https://www.johngrimwade.com/blog/2016/10/31/old-school/). As you can see, it was to be printed 147 mm wide, the dimension penciled below the art, and was drawn at 150% of the final size. It was much easier to work with pen and ink at a larger size, of course. But then again, as I said in that earlier post, “Trees are easy”.


Test card

THE PATTERN THAT SETS THE STANDARD FOR TELEVISIONS.

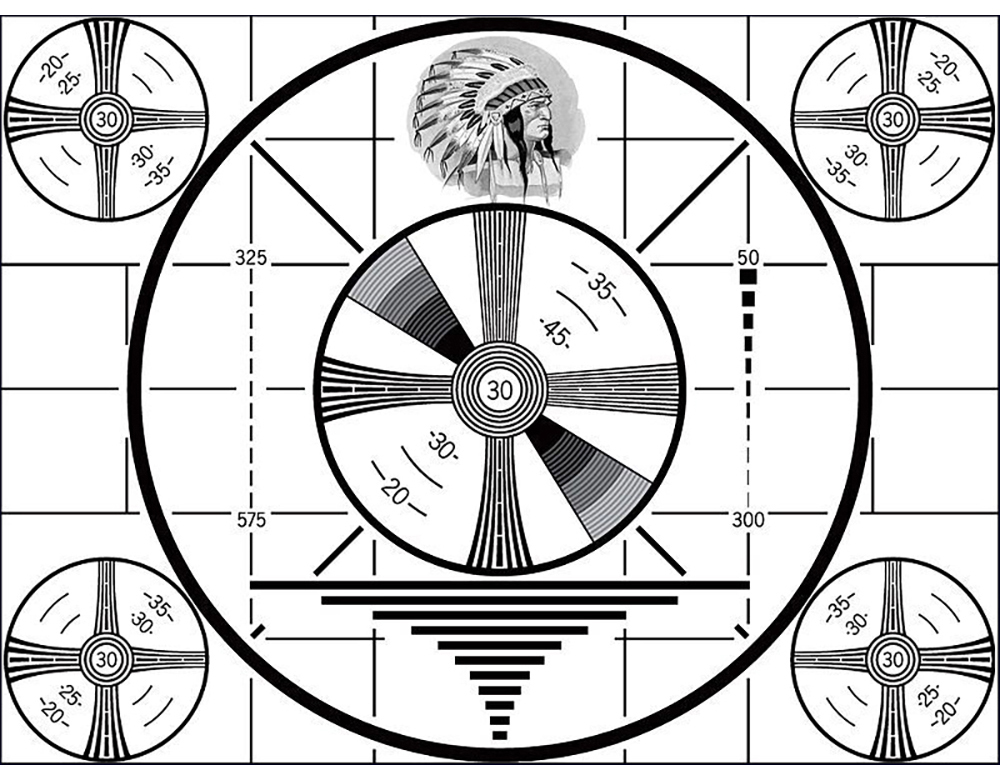
phillips1

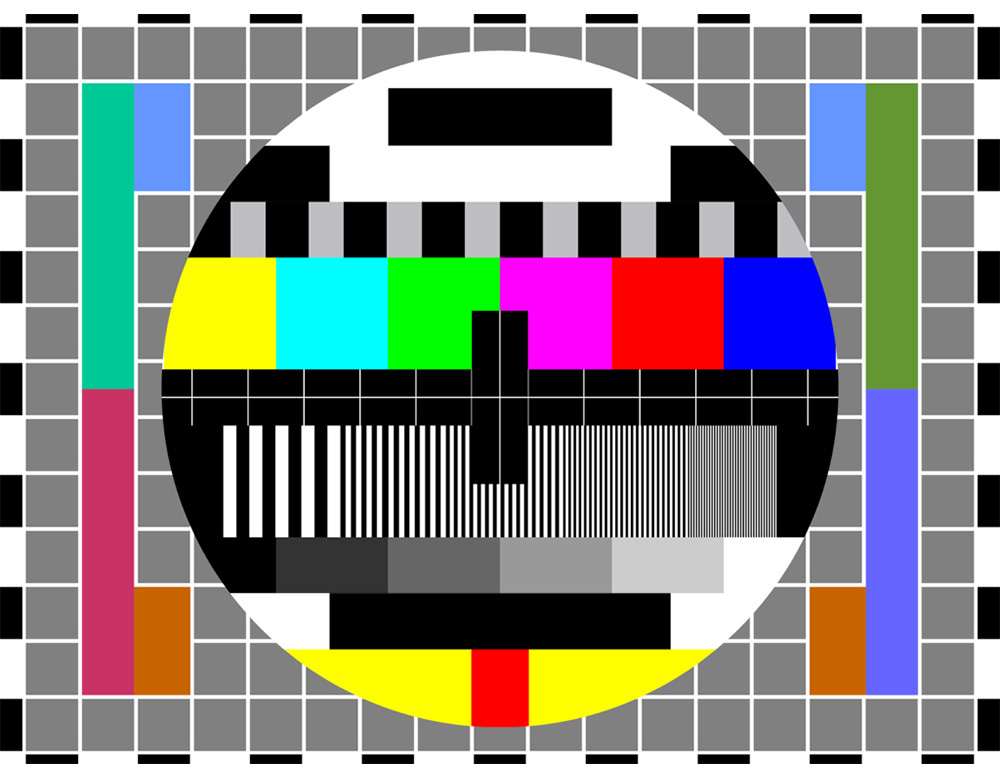
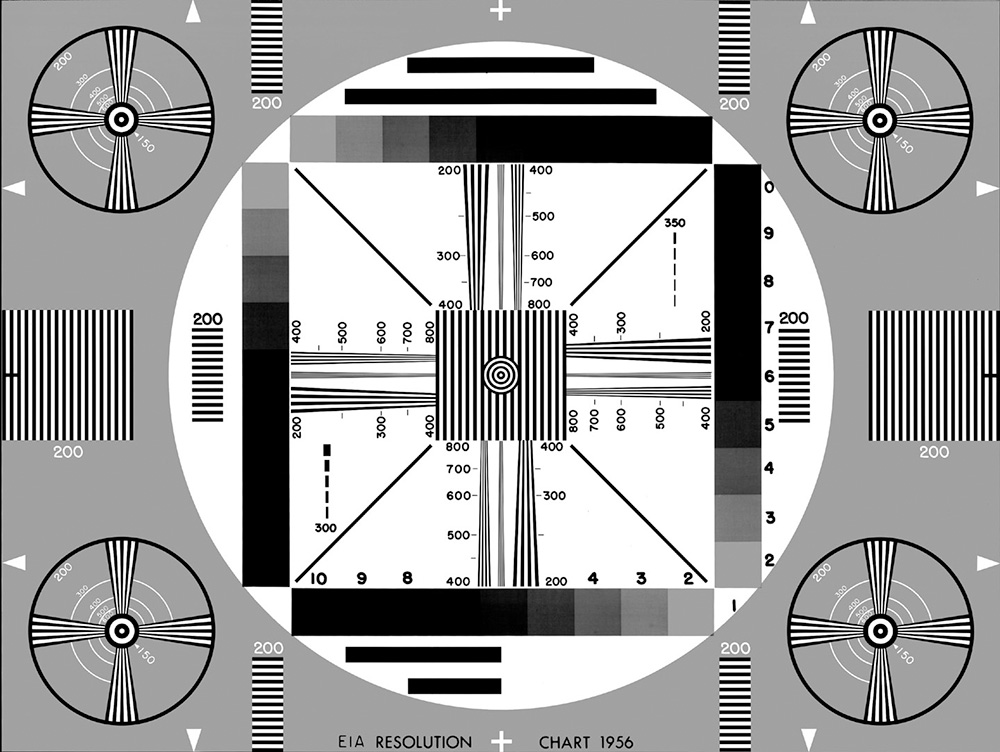
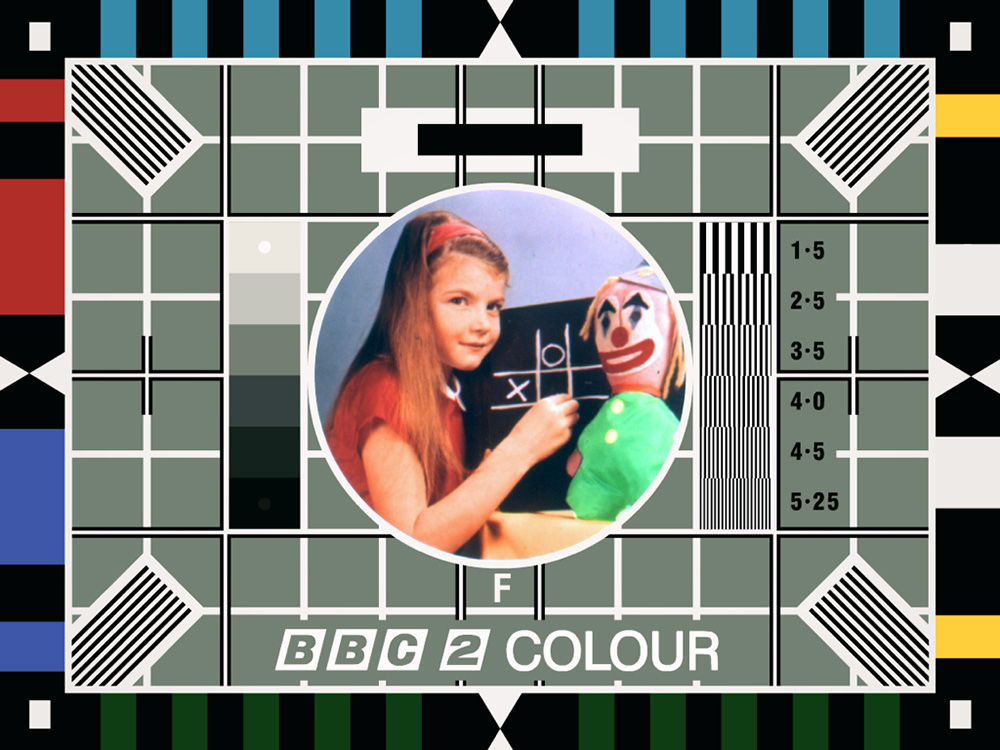
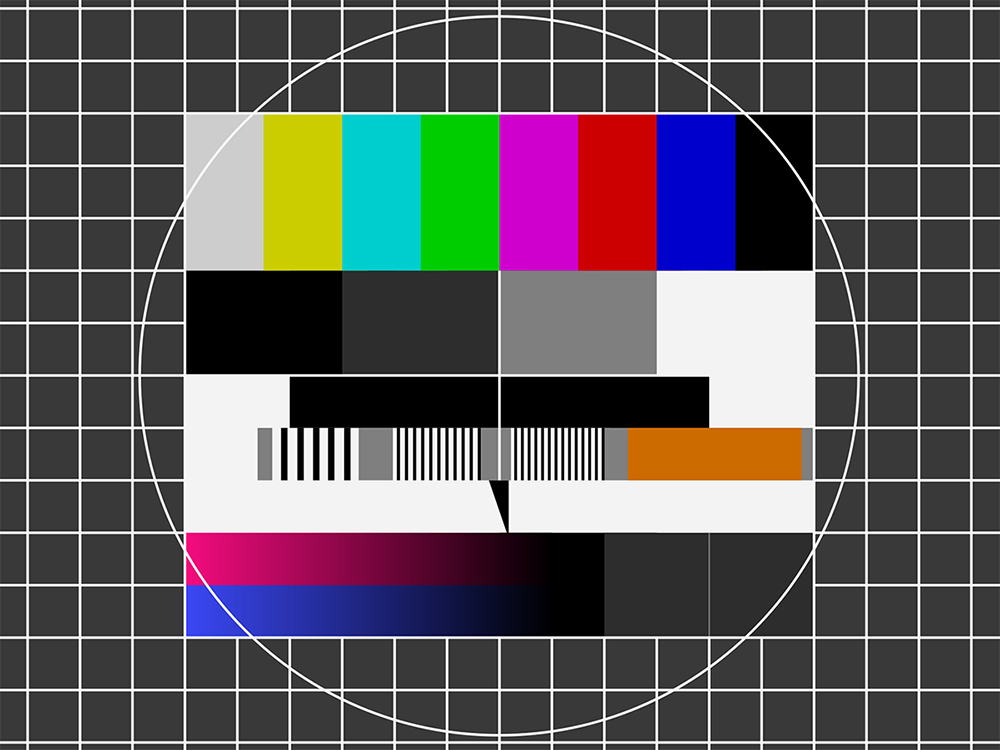
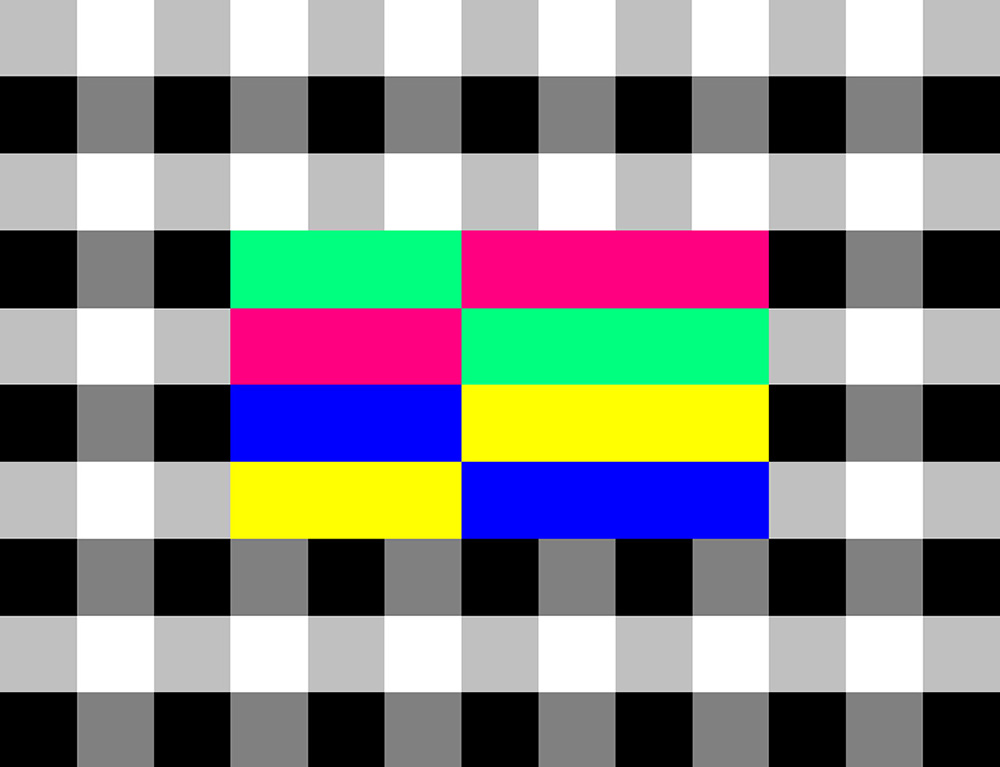
In the earlier days of television, when the cathode ray tube (CRT) was king, broadcasters would put up a test pattern when there was no programming (which was quite often). It was a reference point to help engineers and technicians tune in cameras and tvs, adjust aerials etc. It was called a test card because it really was a card that a camera was pointing at. Later it became know as a test pattern. The geometry of the earlier versions is there to help adjust CRTs. Not needed with modern plasma and LCD sets. The patterns are still around today in digital form for equipment adjustment, but there is no downtime on television channels, so we don’t see them on our sets. I’ve always liked them as simple, functional pieces of information design.

Below, a 1939 Indian-head pattern. Used up to 1970.

indianhead2


eia


bbc2


telefunken


oud

They were (and are) accompanied by music, or a sine wave tone, for checking sound reception.
The SMPTE bars are the most common test screen today in the North American region (NTSC standard). Used frequently in video production and transmission, this is a known standard, meaning that people across the T.V. industry have a benchmark to match their image against. The pattern comes with a potentially mind-numbing continuous tone. Experience the joy of it here: goo.gl/JxK1gp

smptehd

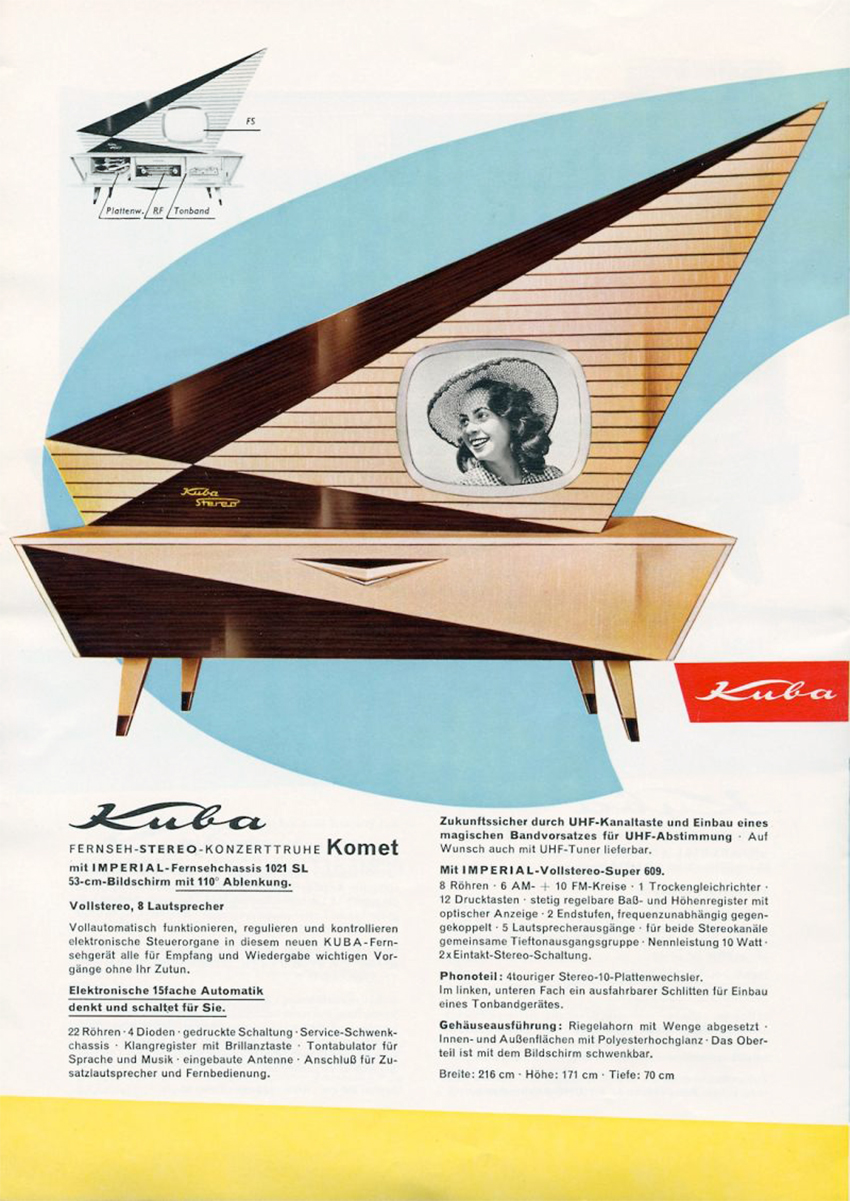
And to finish, here’s a dynamic-looking T.V. from the 1950s, just because it’s…unusual by today’s standards. Not a thin black rectangle.

kubakomet1957


Bayer’s masterpiece

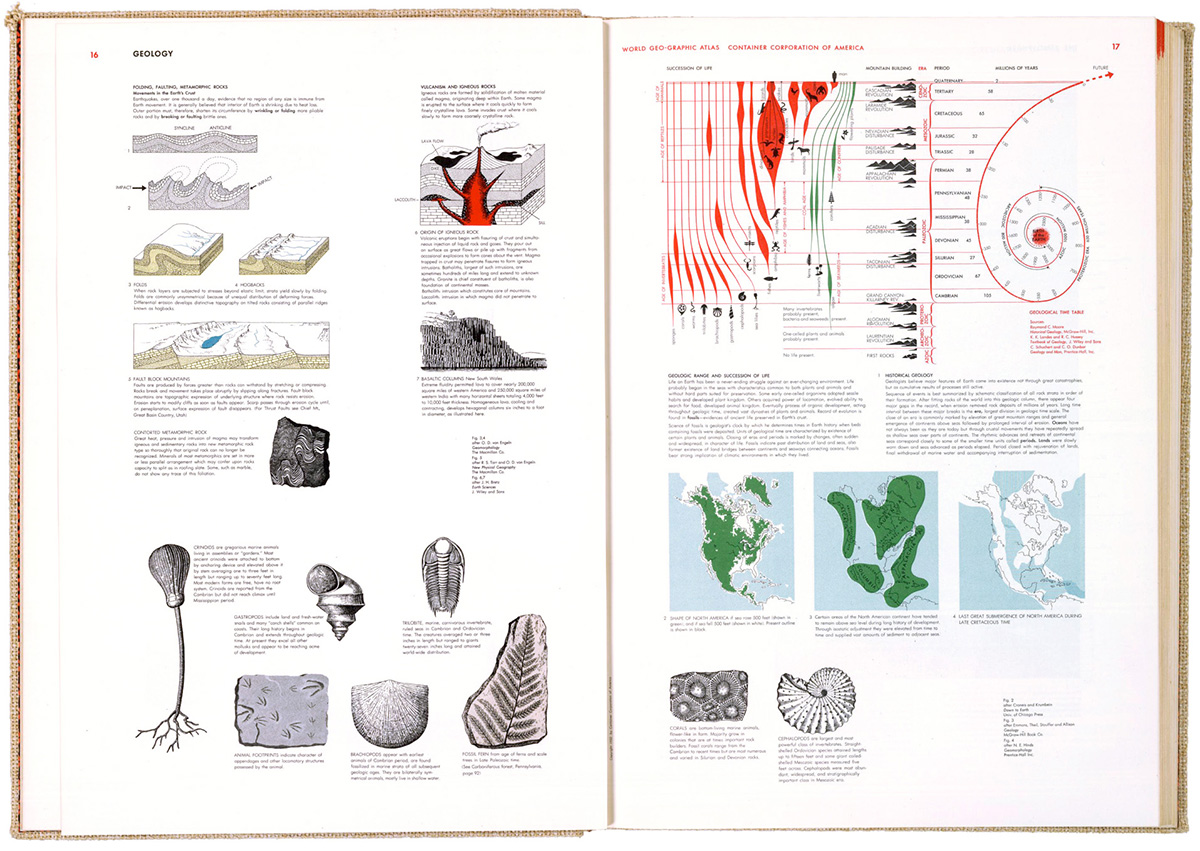
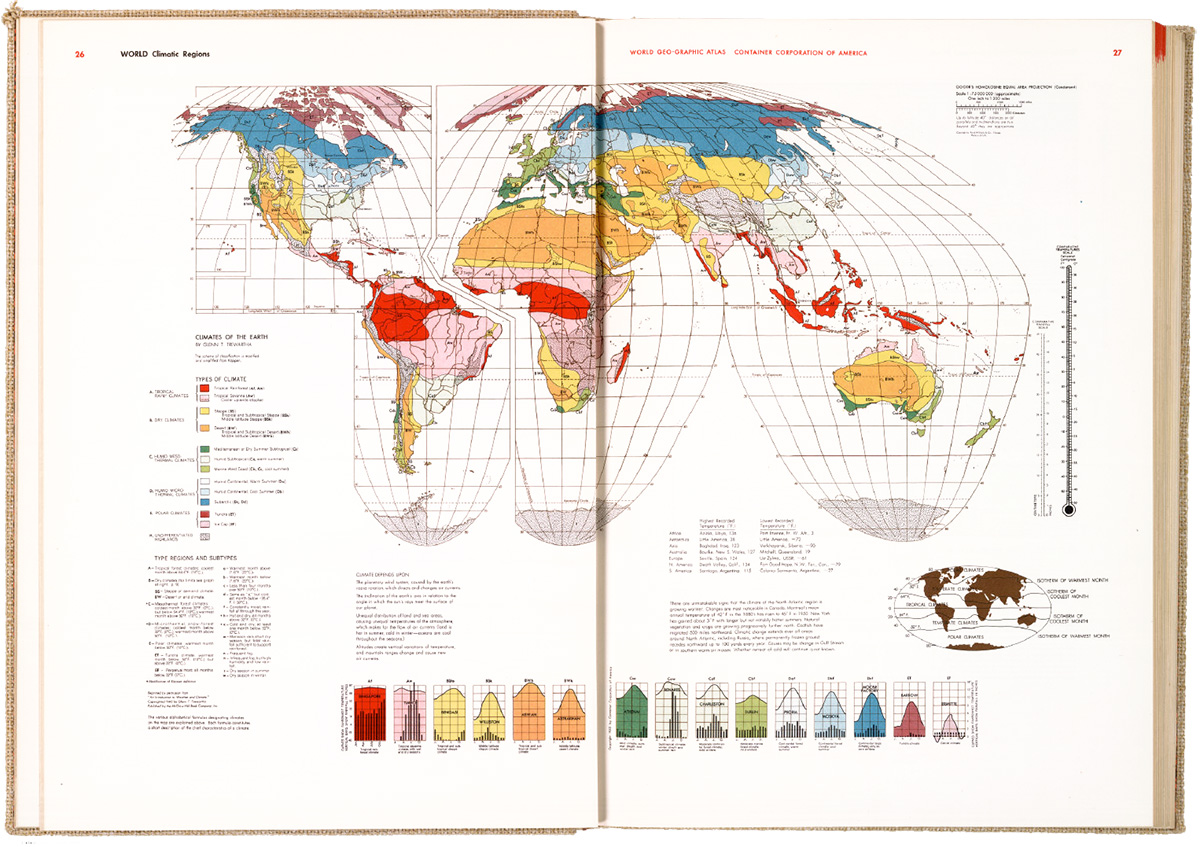
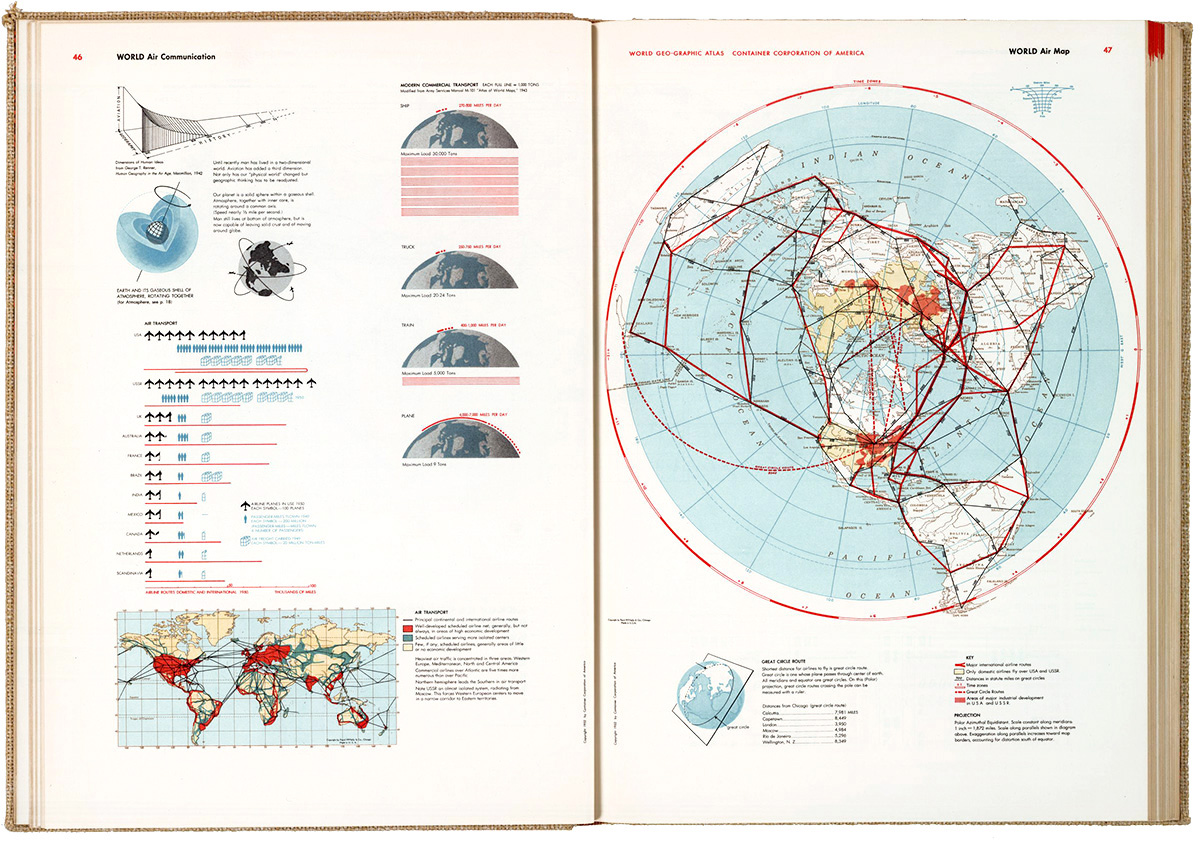
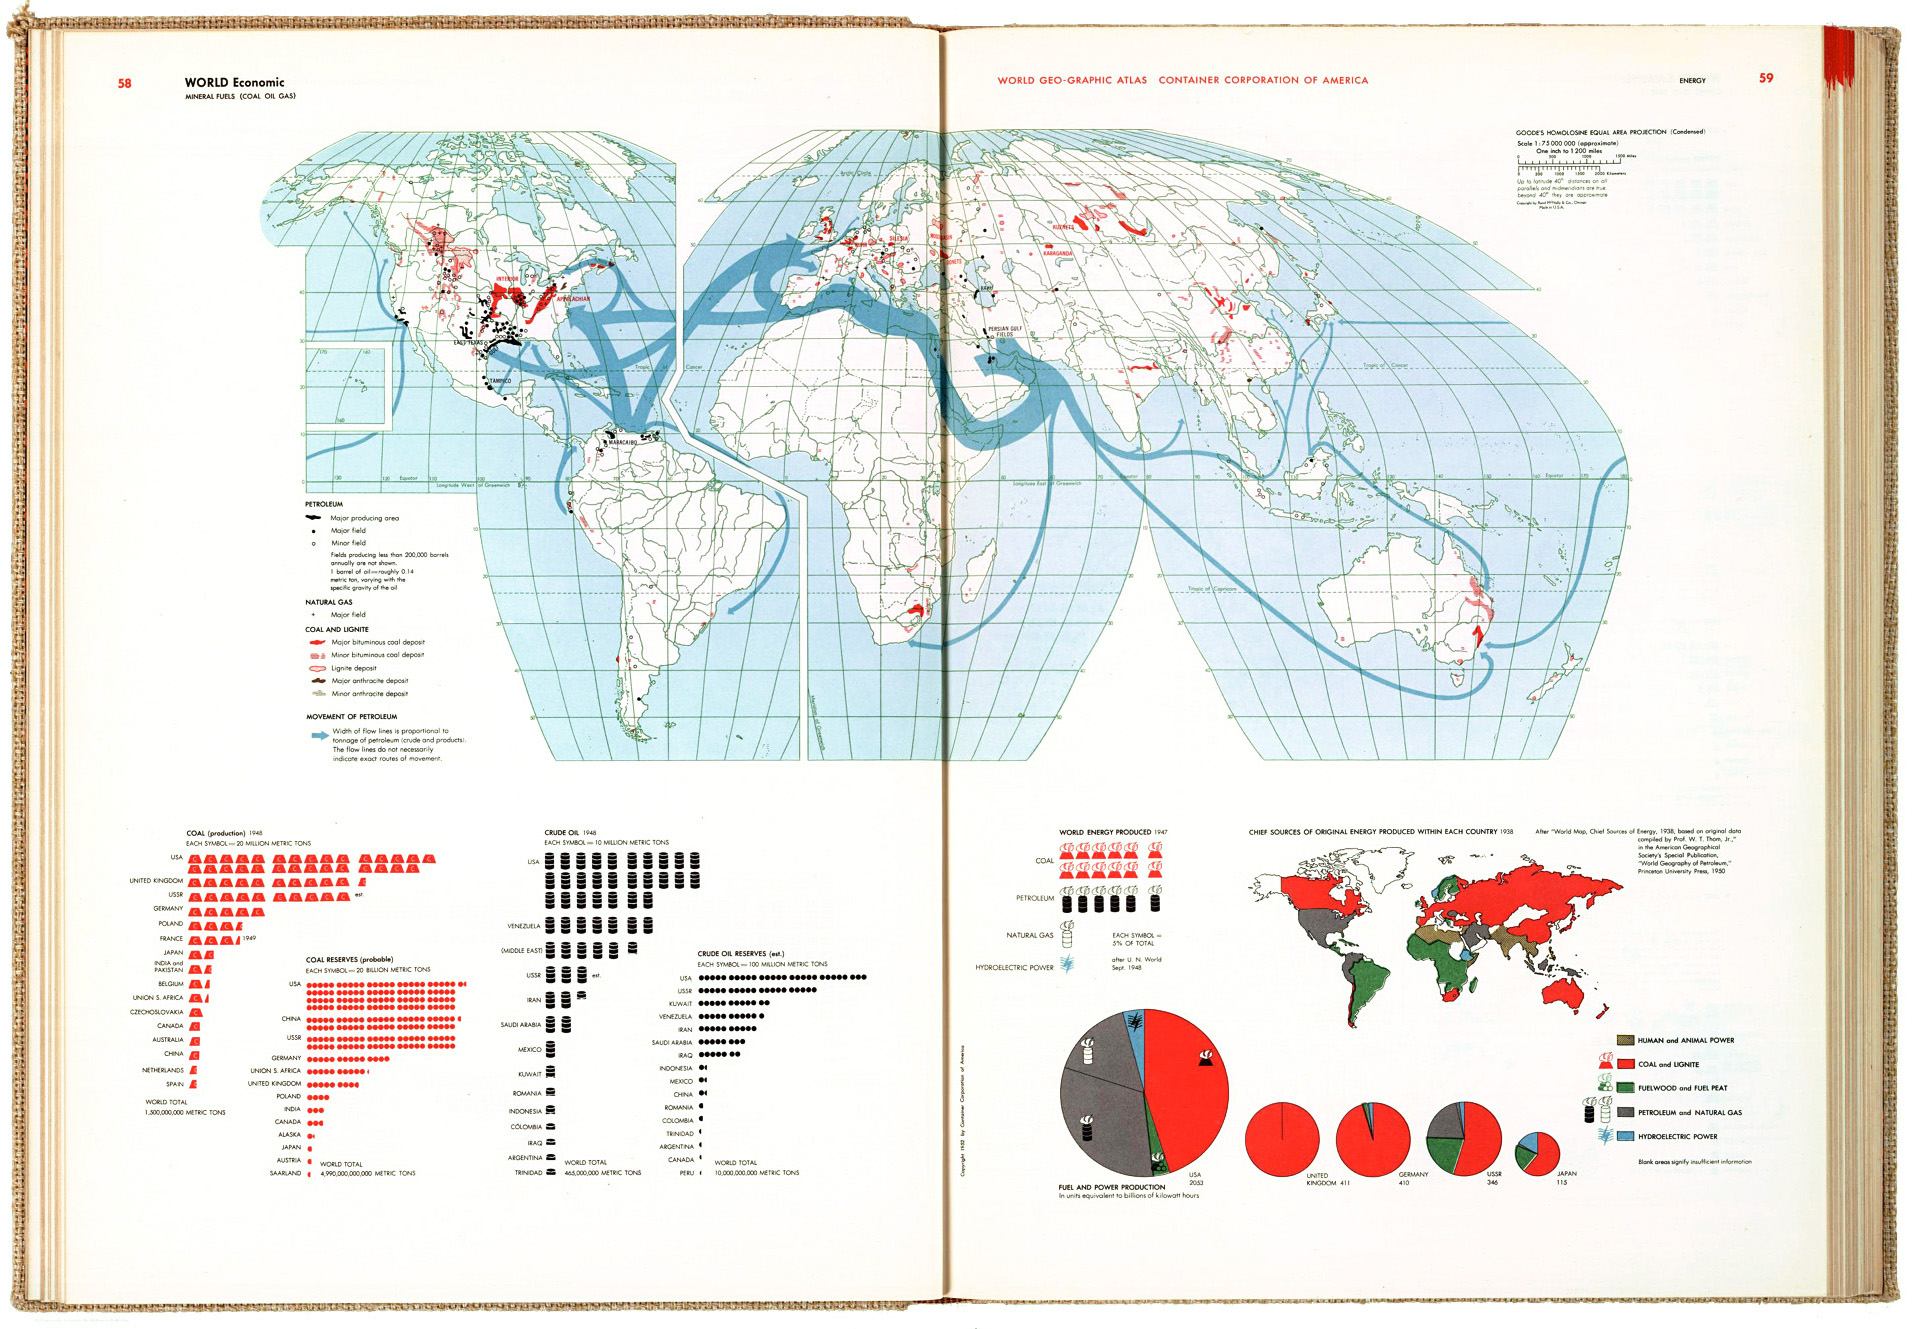
THE 1953 WORLD GEO-GRAPHIC ATLAS.

astronomy_hb1

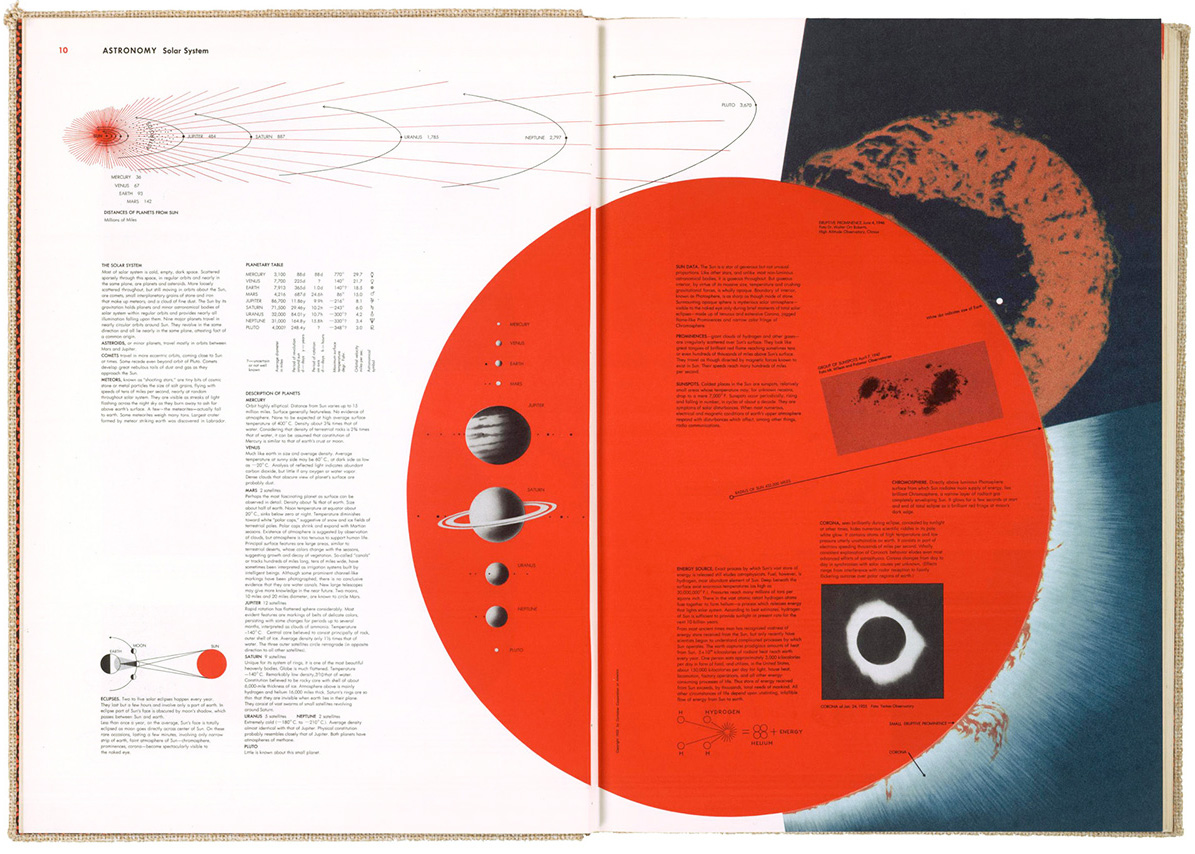
This informational gem took five years to produce and contains a few thousand infographic items. I don’t own a copy, but Michael Stoll, who I mentioned in an earlier post (https://www.johngrimwade.com/blog/2016/10/06/atlas-heaven/ ), has one (naturally) in his superb collection of historical information design. I was in Augsburg two weeks ago, and was able to examine the real thing, instead of looking at digital images. Seeing design in it’s original format, as opposed to looking at different sizes and variable image quality online (or in this blog, for that matter) is a vastly different experience. Often difficult to achieve, but worth the effort.

themoon_hb

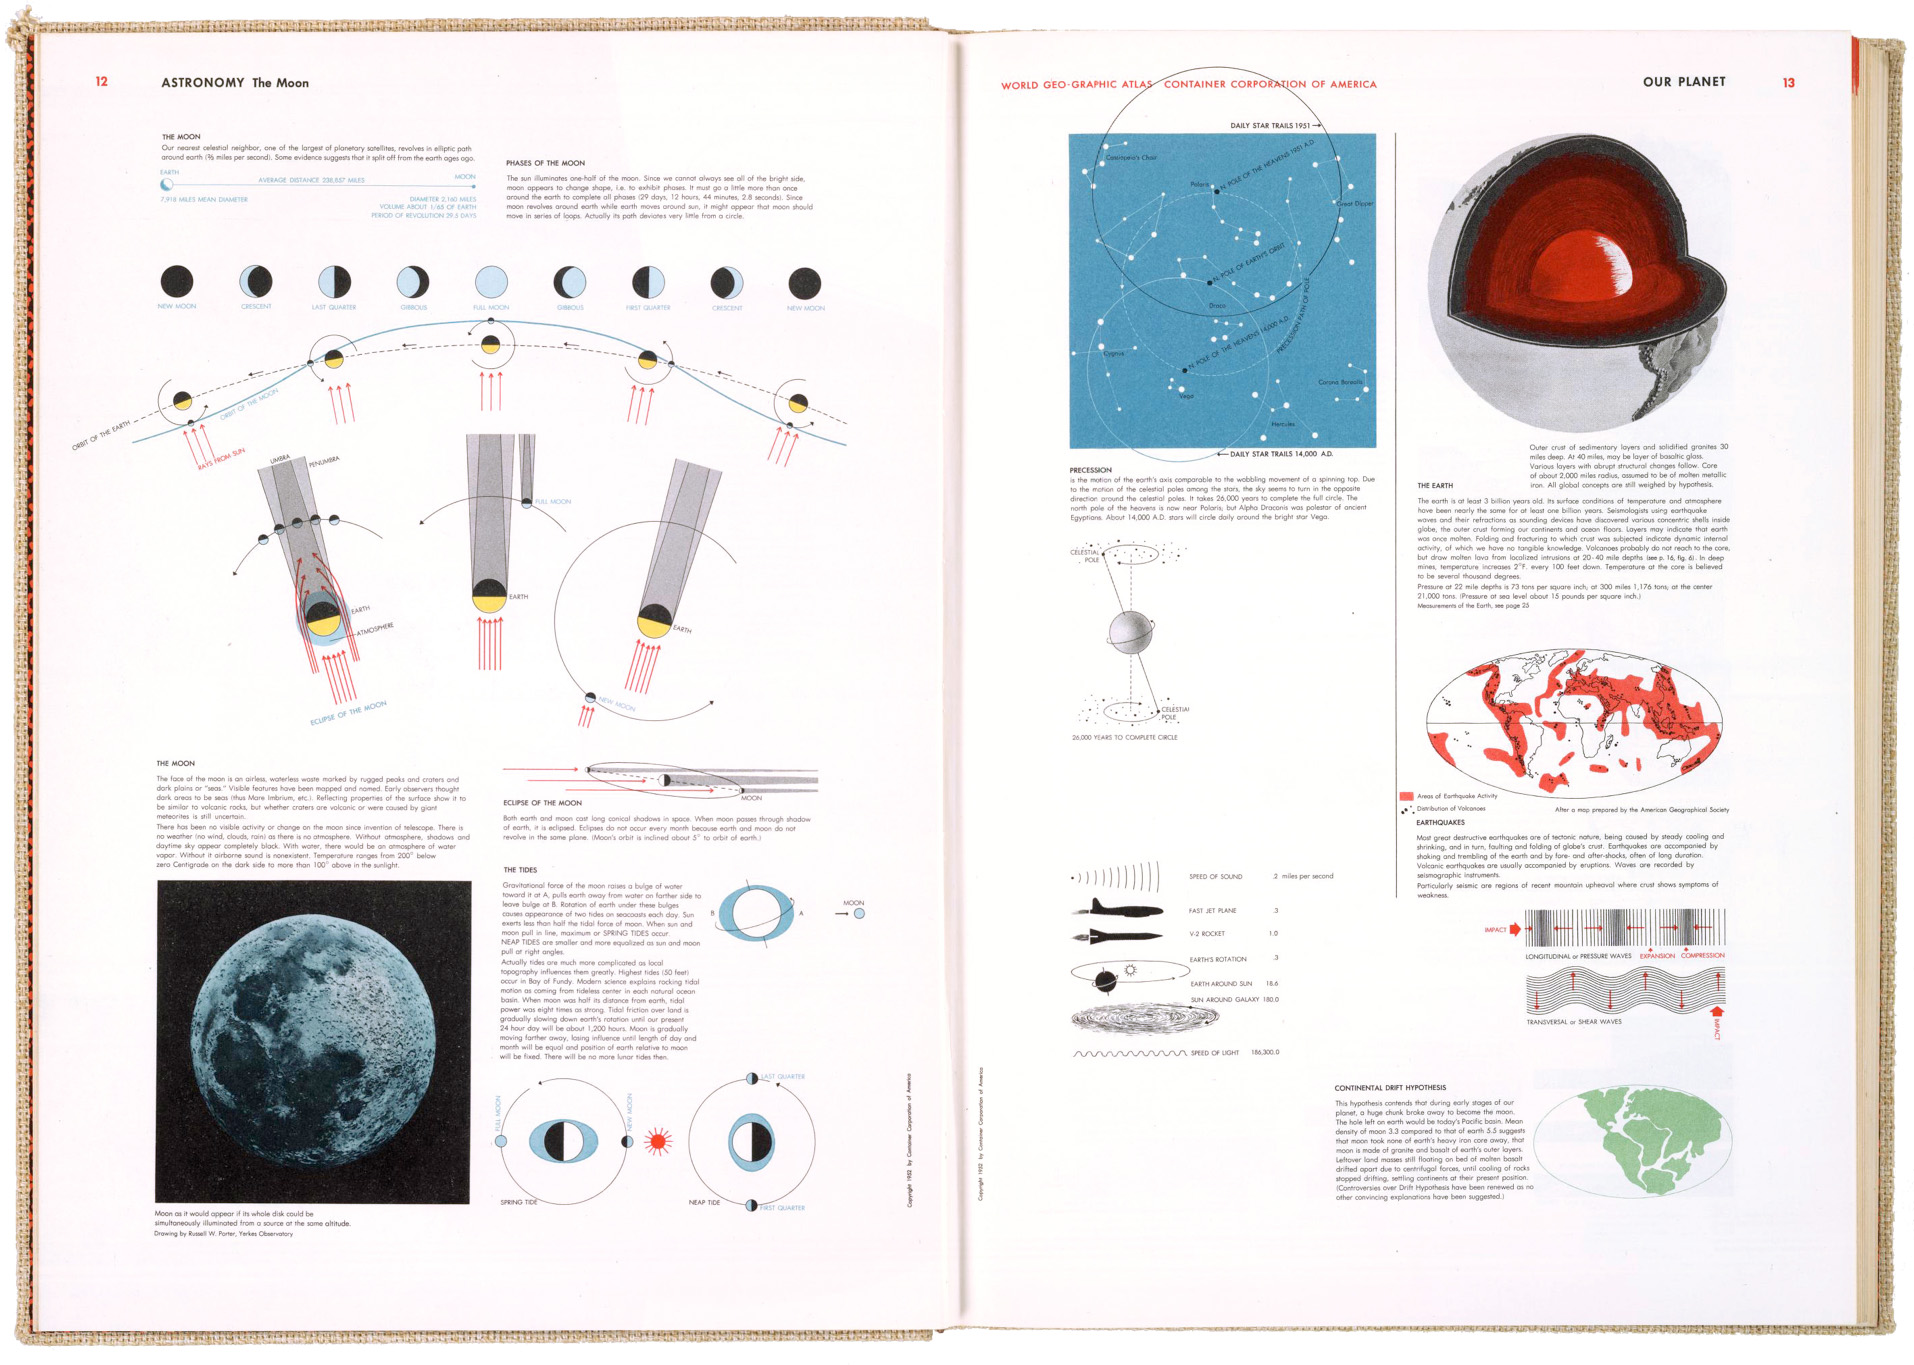
The atlas was produced for the Container Corporation of America to commemorate their twenty-fifth anniversary. 30,000 copies were printed. They were distributed to customers as a gift, and given to numerous colleges and universities. It was never produced commercially, or reprinted, so original atlases in good condition are quite rare, and thus expensive to acquire.

A team of three designers worked under Bayer to develop a graphic language for the book, using the color system that had been developed for CCA by Egbert Jacobsen. Bayer did his own research, traveling widely to assemble the information. There are many design influences to be seen in the pages, like the Isotype system of pictograms. I’m struck by how it looks so modern, sixty-three years after publication. It shows the staying power of precise, clear information design.
geology_hb

Herbert Bayer was a Renaissance Man. A graphic designer, typographer, photographer, artist, interior designer and architect who studied and taught at the legendary Bauhaus school. He emigrated to the U.S. before the Second World War, and produced all kinds of impressive design across many fields.

climate_hb

airconnections_hb4

economic_hb3

These images are from the David Rumsey Map Collection. See the full atlas in high-res there: goo.gl/gpd8nV