Category: History

Old school

ANOTHER TRIP DOWN INFOGRAPHIC MEMORY LANE.

I’ve been looking at my old, pre-computer artwork again. All created with pens, ink, and a fair amount of white paint. In terms of quality, it’s a mixed bag. Not all greatness, by any means, but it has a certain hard-to-resist appeal.


landmark

A selection of architectural items that are protected by English Heritage. (Click on the image to see a larger version.)

I wanted to see what was inside this boxing glove, so I cut it in half with an expensive kitchen knife, which ruined both items.

boxing_gloves

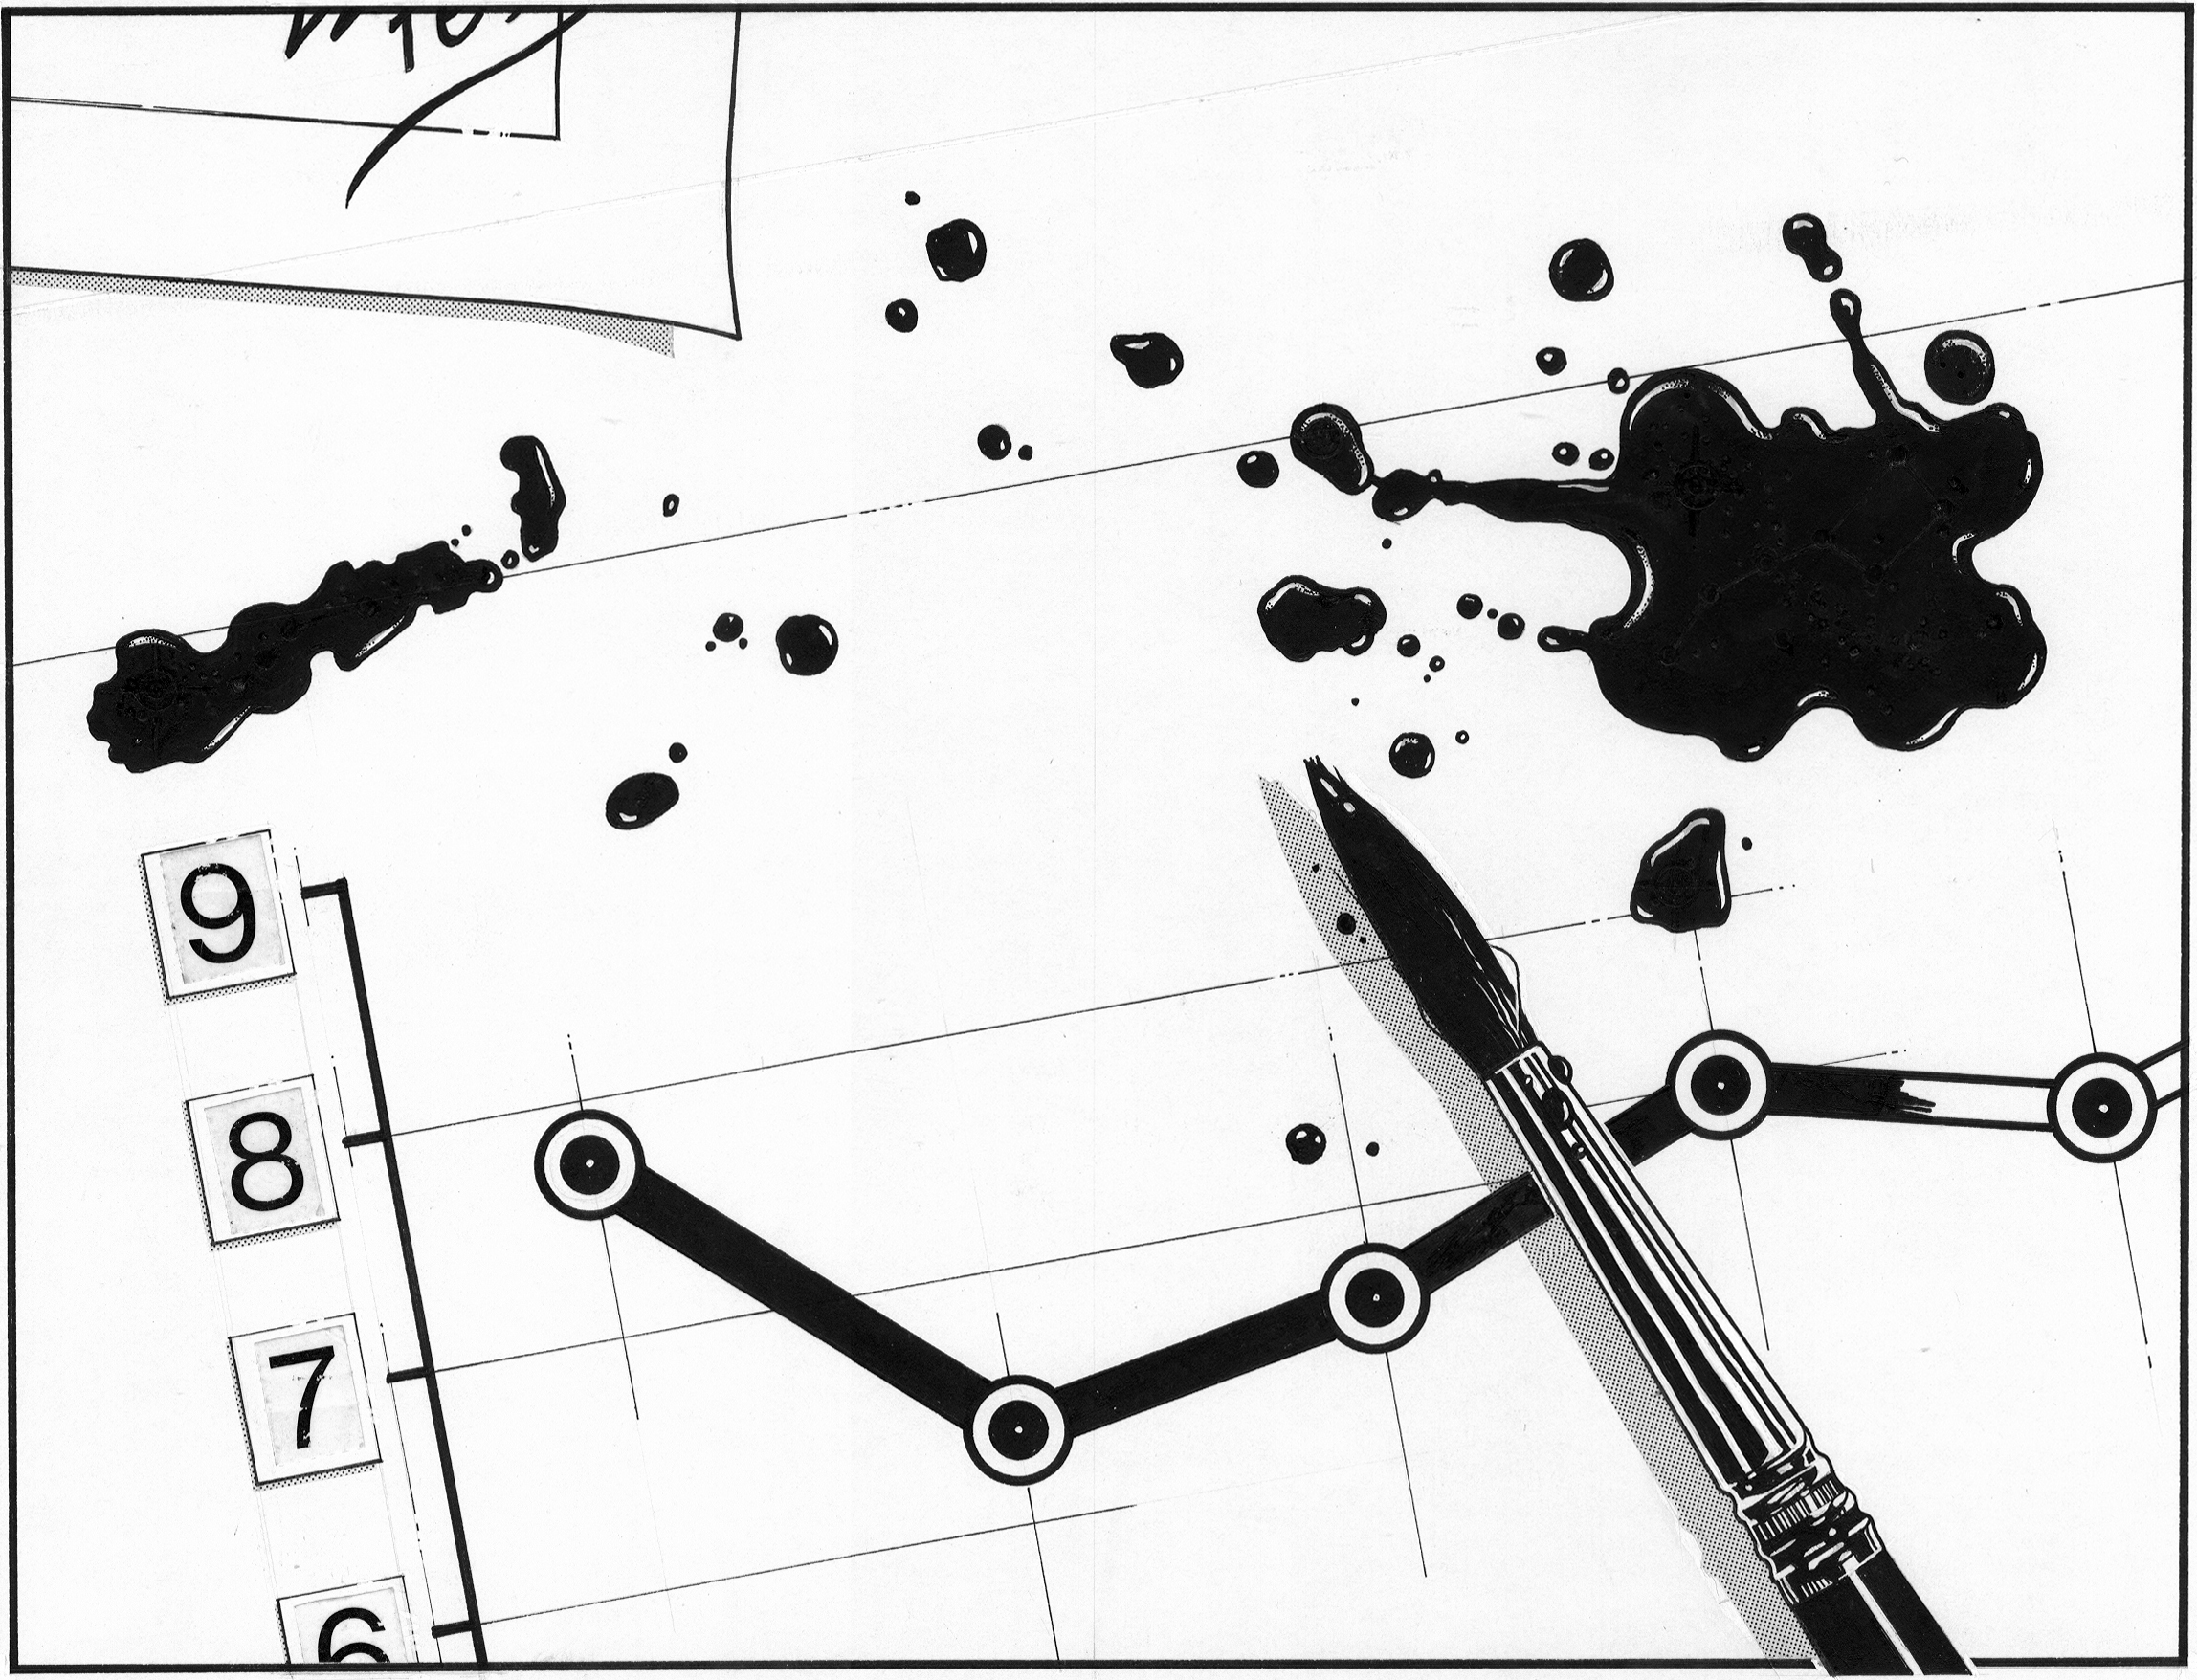
With ink around, sometimes there would be an accident. I had an unfortunate spill over a business chart, so instead of starting immediately again, I illustrated the event. And I have no idea why.

accident1

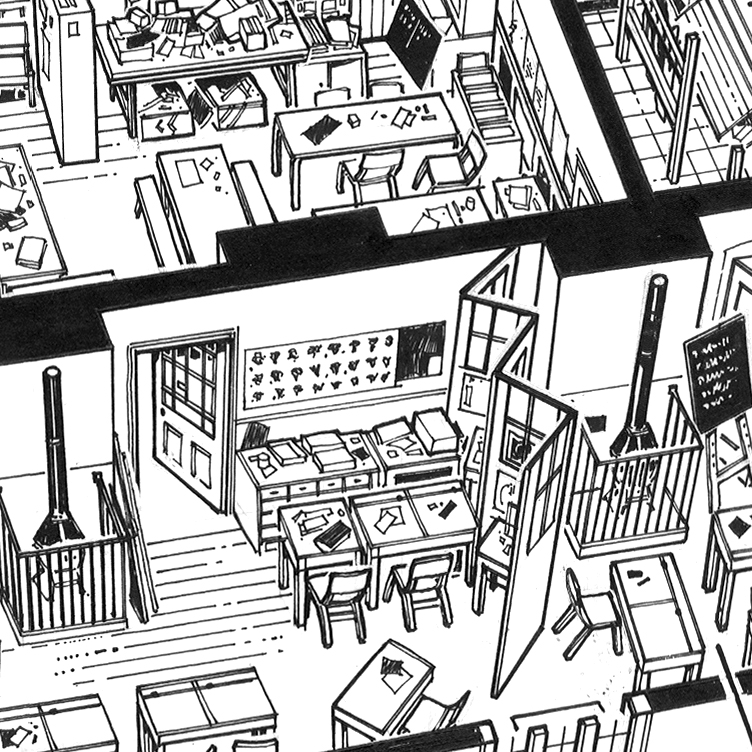
This kind of village school was disappearing. Unfortunately, it looks like all life has disappeared too. That is a problem.

school1

Detail.

school_detail1

cue

Snooker cue Illustration.

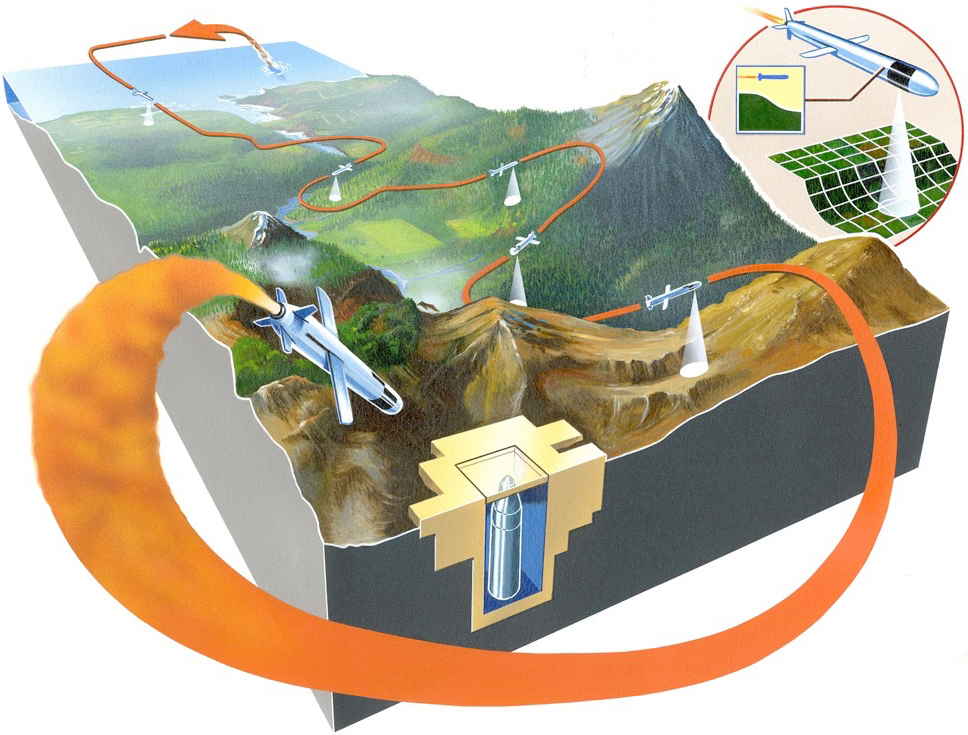
Below is a cruise missile diagram painted with gouache, and airbrushed, that seems somewhat over-worked now. But bear in mind that it was very hard to go backwards in those days. There was no “Command-Z.”

cruisemissile


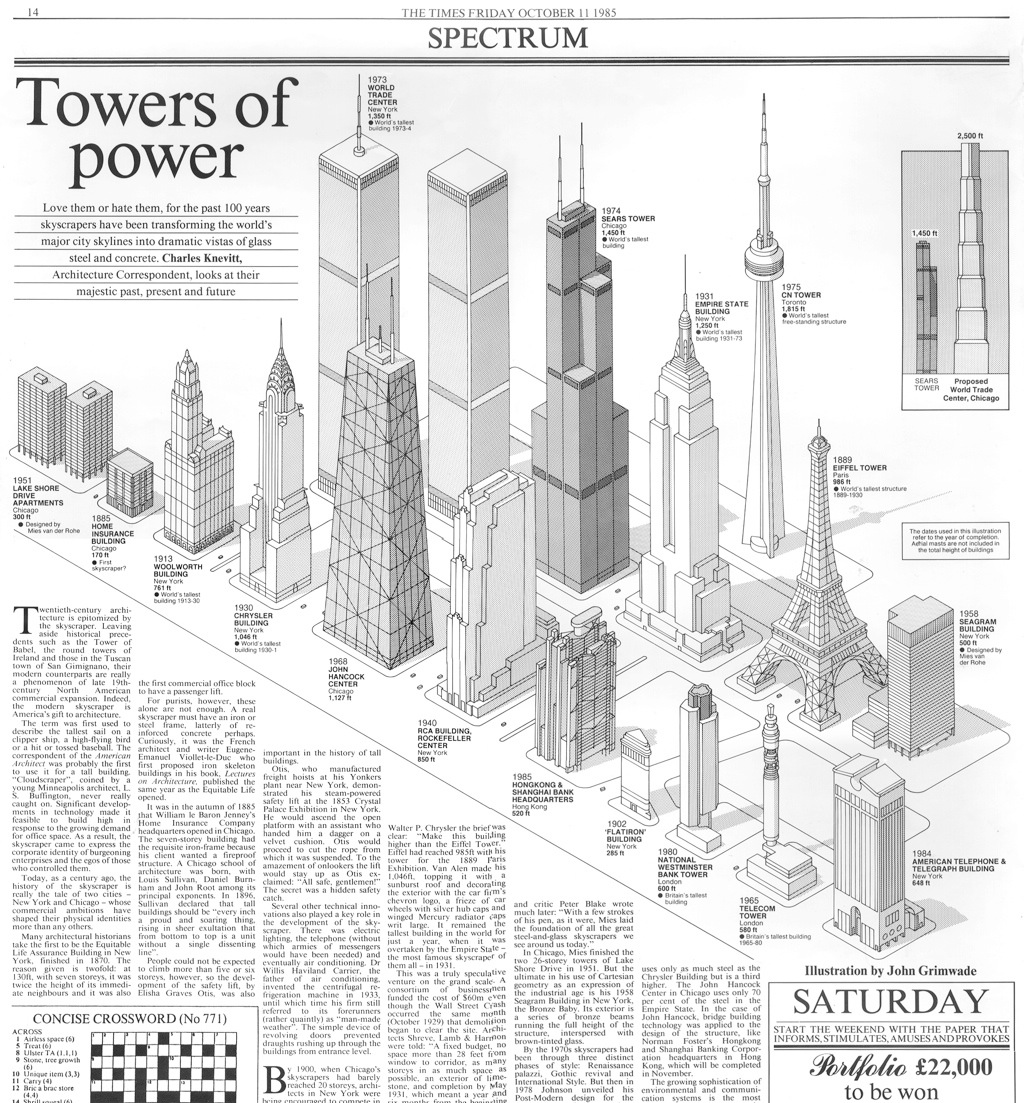
For this tall buildings page, each building was drawn in pencil separately, then xeroxed and assembled as a layout. When I was happy with that stage, I began drawing the various elements in ink.

towers_com_a

towers

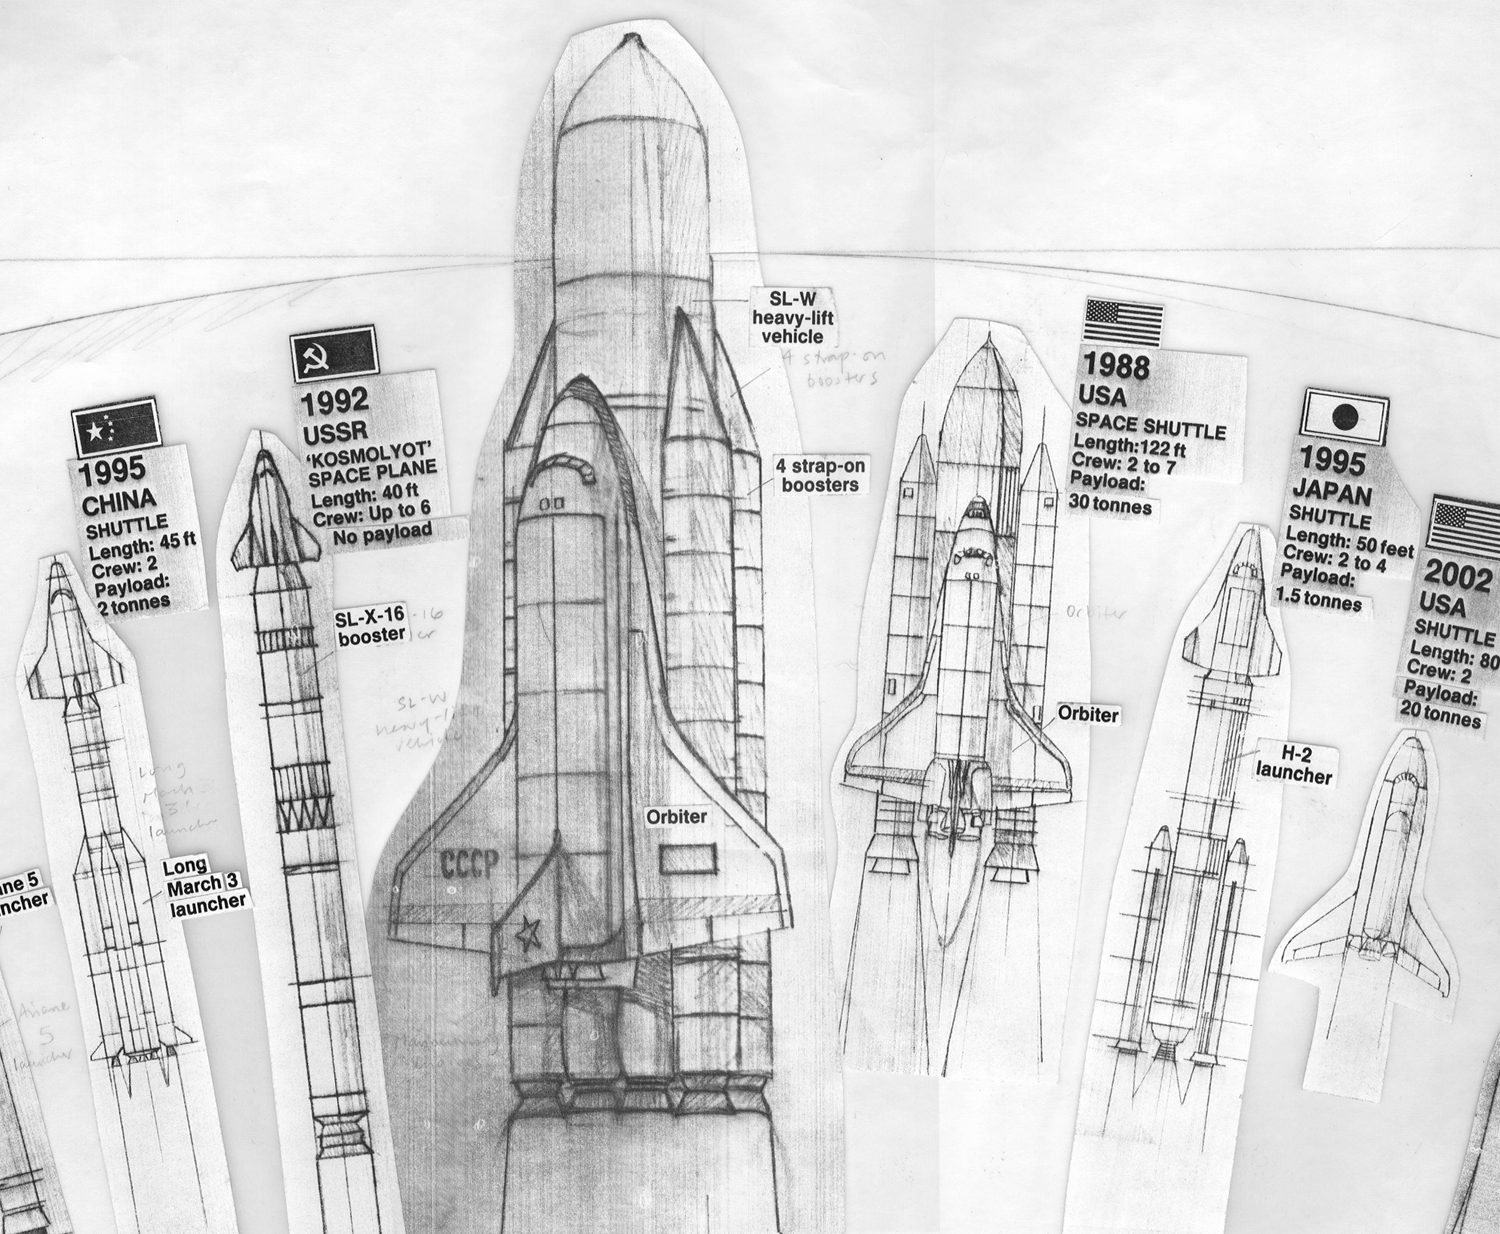
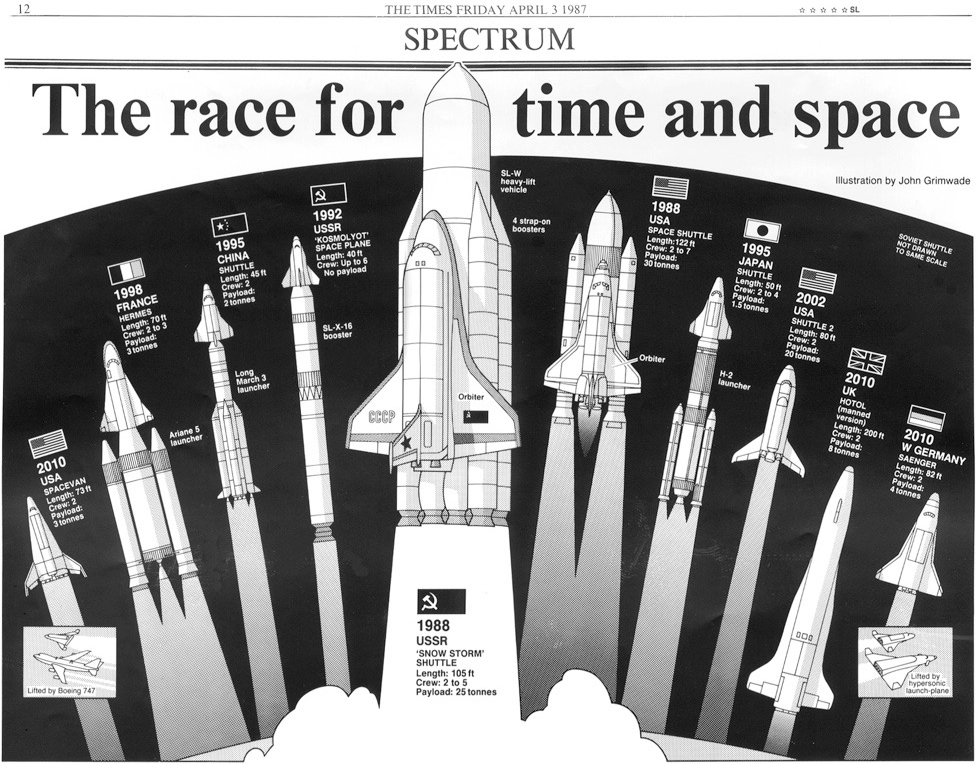
The same process was used for these space shuttle fantasies.

shuttle_comp

shuttles_a


Trees are easy. You can quote me on that.

trees

Jaime Serra’s game-changer

TWENTY YEARS AGO, I SAW THIS MAP AND I KNEW THAT INFOGRAPHICS WERE ENTERING A RICHER PHASE.
ruanda1

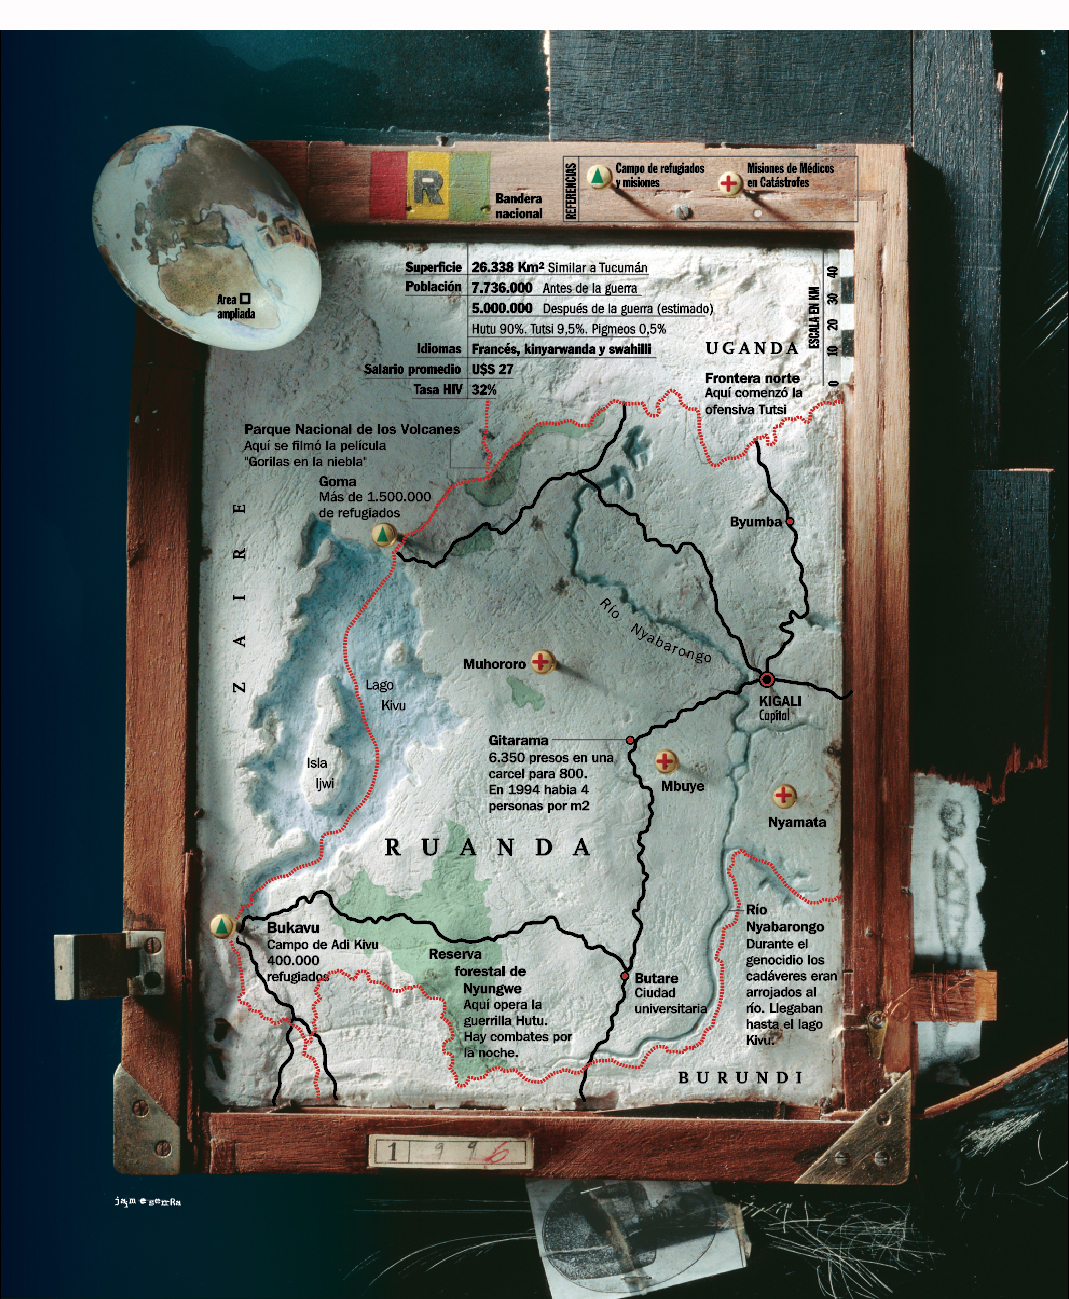
Genocide in Rwanda. (Click on the image for a larger version.)

Back in 1996, when Jaime put this graphic on my desk, I could see that the gap had been bridged from the computer-generated graphics of that time back to our rich, artistic infographic heritage. Art and information were brought together in a beautiful form, with function intact. As far as I’m concerned, this is one of the milestones of late twentieth-century information design. Jaime went on to produce numerous award-winning graphics at Clarín (see below), and many of you know them very well, but this one is really where it started.

Here are Jaime’s thoughts about the graphic. Written a few weeks ago, with the hindsight of the years in-between.

“Some background to the subject: In 1994 the Rwandan government, controlled by the Hutu community, were responsible for the murder of between 500,000 and one million Tutsis, equivalent to 75% of the population of that ethnic group.

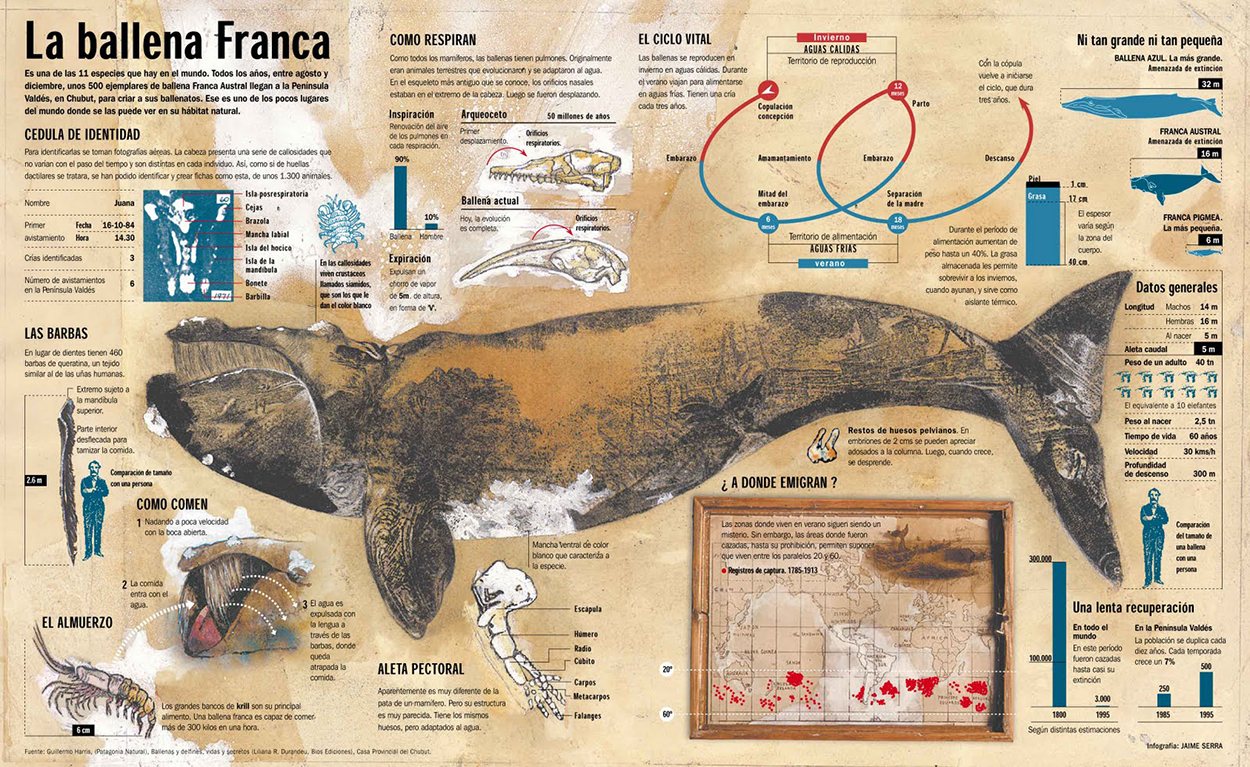
A year after the genocide, a Clarín team traveled to the refugee camps in the area. The infographic contribution to the coverage was just a small locator map. But it grew into a page in the Sunday magazine, mainly because of the graphic treatment. Pre-dating my better-known works such as “La Balena Franca” (Editor’s note: Gold medal winner at the Malofiej Awards.), this map was one of the first examples where I was able to capture my personal graphic style in a complete and radical way.

ARGENTINA

A year earlier, I had arrived in Argentina to create a graphics department at Clarín, a daily newspaper with the most readers in the Spanish-speaking world. At that time, there were no infographics in Argentine journalism, and although that was on the one hand a serious handicap, it also meant that I had the freedom to rethink the foundations on which we had built the profession in recent years.

Back then, the general style of infographics was always the same, regardless of the subject. A somewhat cold, sterile style created with vector software. I was convinced that we were wasting a primary way to attract readers—aesthetics. So ready to take some risks, I gave Clarín a complete style manual that would be rigidly applied, while also starting a concept which I called “aesthetics and ethics” for the numerous exceptions where the graphic style manual would not be used. This idea was not a style, but rather the absence of it. Each infographic would be treated according to it’s subject matter. Using this approach, the Clarín team created, more or less successfully, each individual infographic, whether it was about rubber, Houdini, or the Anne Frank House.

Looking back, I think that this was the natural evolution of my understanding of the components of infographics (illustration, information and design). Clarín was the place where my previous work and the new path came together. (Click on the infographics for larger versions.)
ballena

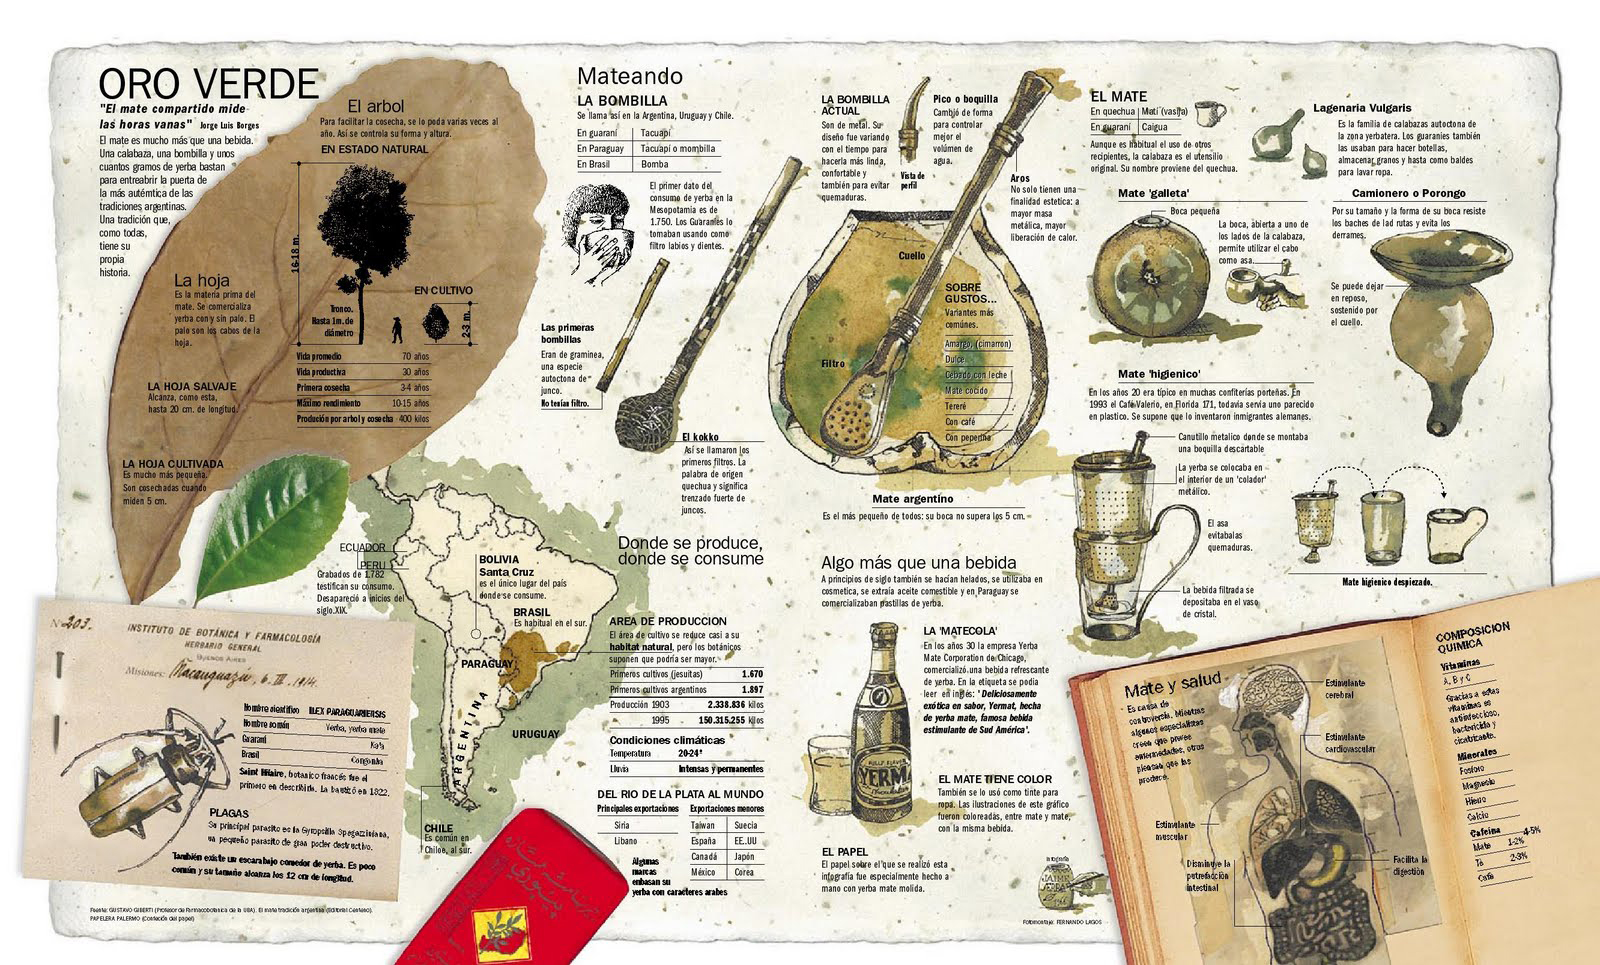
mate_

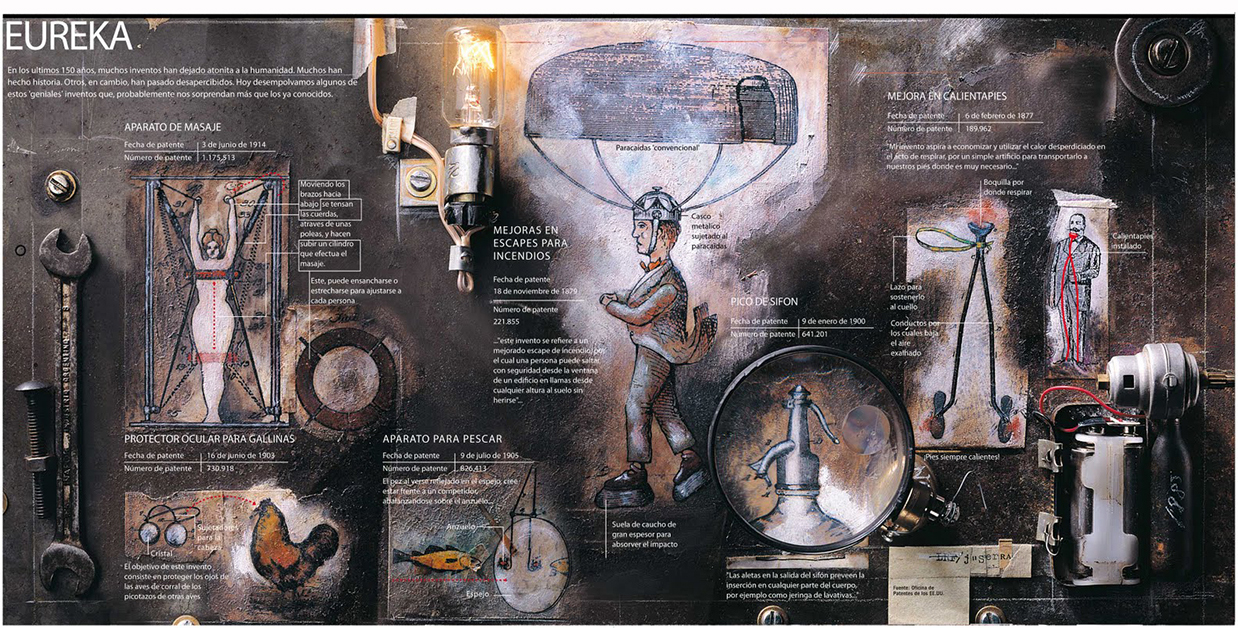
eureka1

annafrank

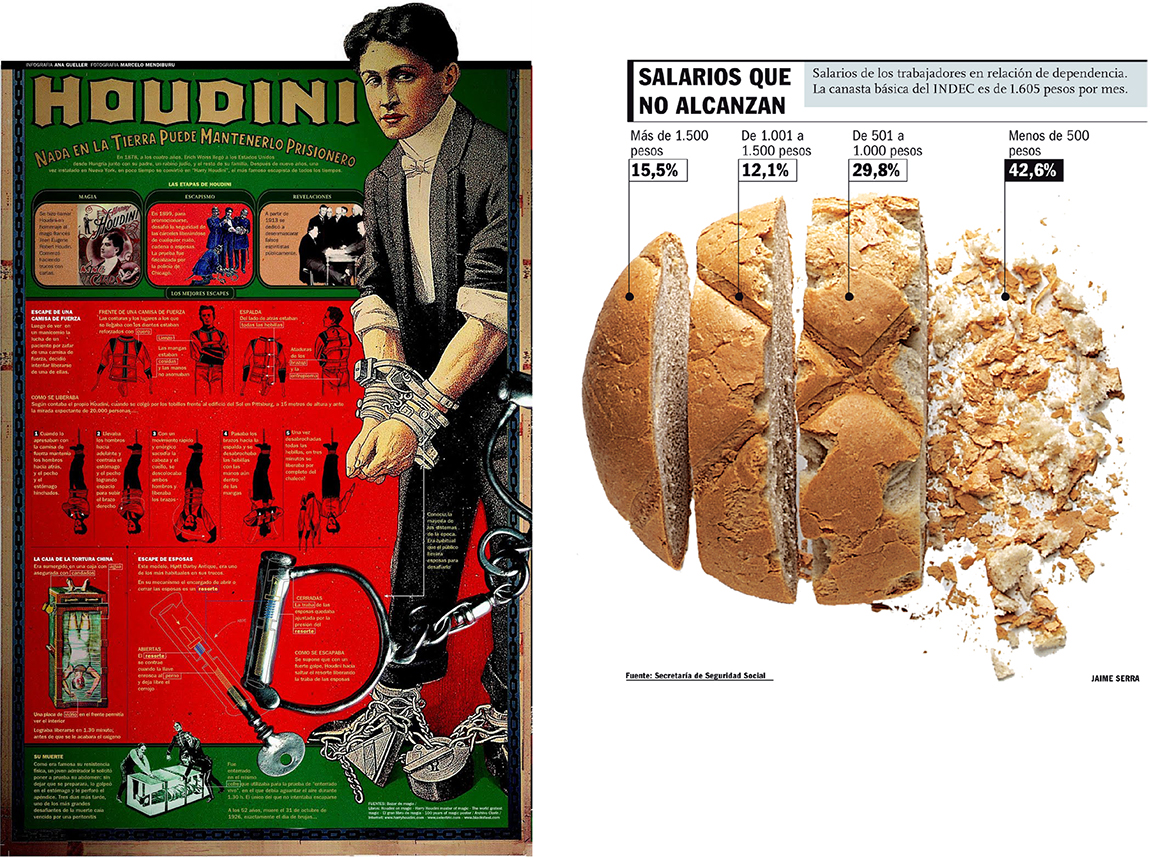
houdini_pan

A clear precursor is the double-page spread (below) on the 1992 Olympic Games for El Periódico de Catalunya (where I had worked before moving to Clarín). It won my first Gold Malofiej medal. The illustrations that explain the sports of the ancient Olympic Games are hand-drawn with a scratchboard technique, using a stroke and color inspired by images of ceramics from ancient Greece. Peter Sullivan had made the point about hand-drawn elements in his book “Information Graphics in Colour” (published by IFRA in 1993), but I don’t think that many people followed the path he was suggesting.
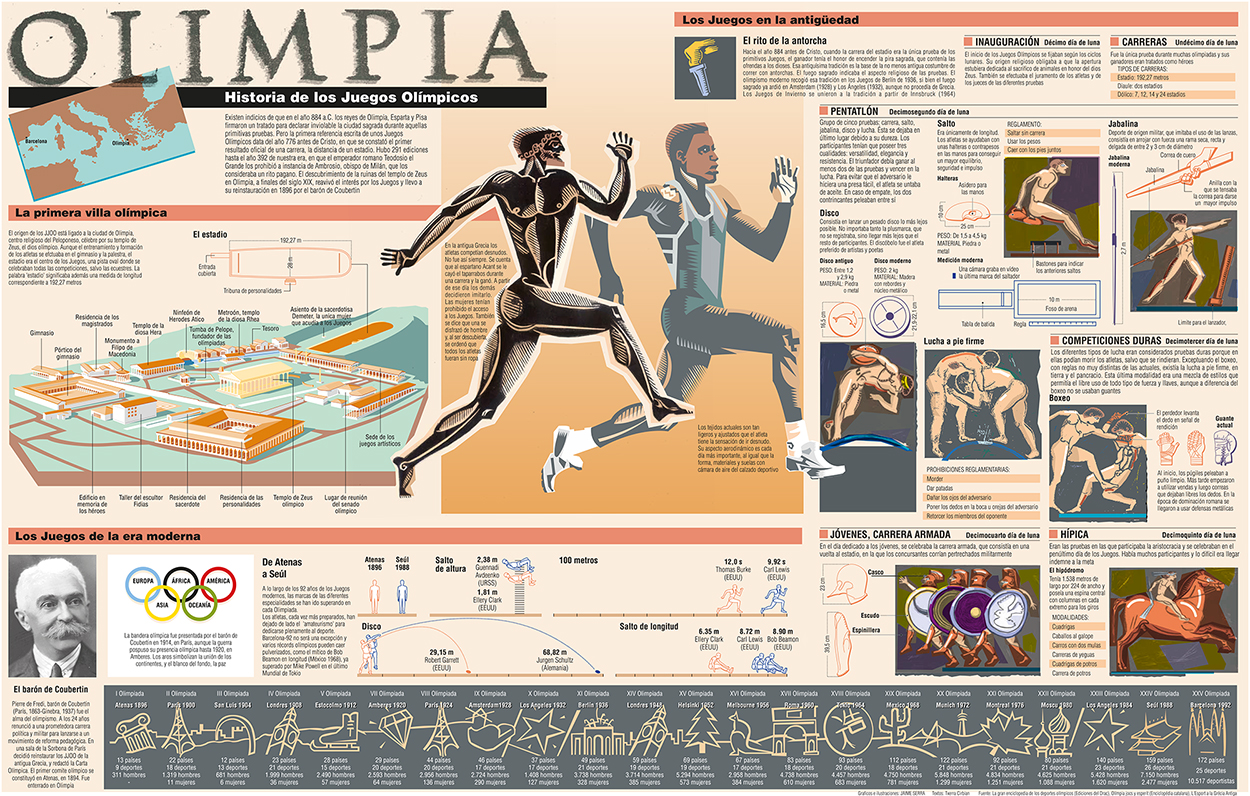
Doble Historica (Converted) copia

While I was using the idea of a stylebook and the option to go outside it, I had another thought that would take me further: Could I use my own style in infographics, the same as I used in my most personal work, without compromising the information, and perhaps even improve it?

So with a graphic style influenced by illustrators like Henrik Drescher (http://www.hdrescher.com/), designer David Carson’s work in the magazine Ray Gun (http://www.davidcarsondesign.com/), and Anselm Kiefer (an artist who still fascinates me today), the strong content of the Rwanda map was an opportunity to explore the answers.

NEW YORK

John remembers the time we met in his office in Manhattan. I took a trip there to get a reaction to the work I had done in my first year of Clarín. That was how I met, among others, Charles Blow, graphics director of the New York Times; Joe Zeff, graphics director at Time Magazine and John, graphics director at Conde Nast Traveler magazine.

To be honest, I had never heard of Blow or Zeff. It was how they worked that interested me. But I knew John’s work very well, although I did not really know Condé Nast Traveler, apart from the infographics. If Carson, Dresher and Kiefer were the role models for my style, Grimwade was my main reference for infographics. My objective was to apply my personal aesthetic to the communication skills that I had learned from observing how these graphics directors worked.

STILL RELEVANT TODAY

At the bottom of the Rwanda map is a hand-drawn date. It’s the year that I made it: 1996. Twenty years later, I wonder (and I asked John this recently), who would be interested in it? His answer: many people, and for me it is more than enough that he thinks it still seems relevant.

(Another editor’s note: I called this blog “Infographics for the People” to draw our attention to the need to add warmth to information presentations, and generally engage the public. Jaime was doing that decades ago.)
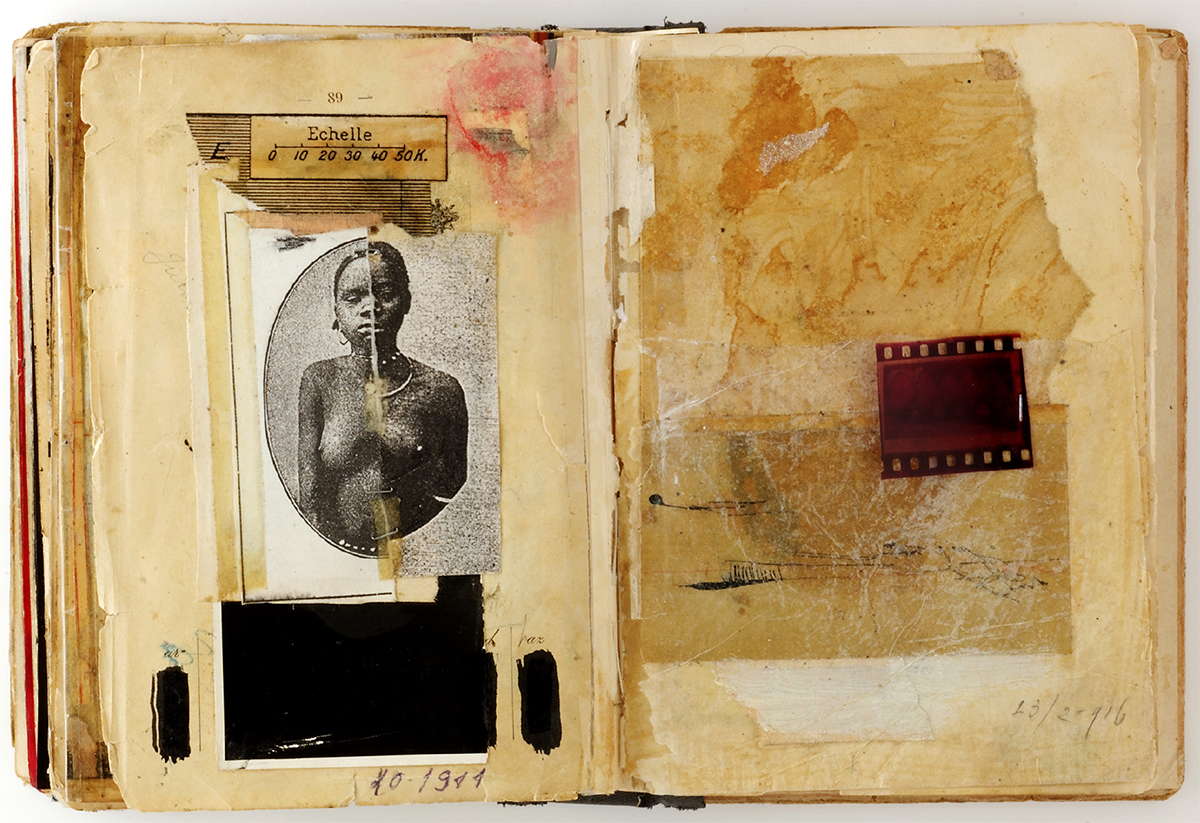
sketchbook_ruanda

STYLE SKETCH

In addition to making sketches to plan the layout and content of the infographic, I also made drawings to find the right tone. In my sketchbook, I made this montage with photocopies of two very similar black women. There was no racial difference between Tutsi and Hutu. They are two divisions within the Banyarwanda ethnic group. After the genocide, they were eliminated from a national document which was cut and re-joined with staples. Most of the countless murders that were documented were carried out with machetes. The geographical scale is in French: Rwanda had been a Belgian colony, and this seems to suggest the dimension of human and social costs.”

See more of Jaime’s brilliant work, and the process behind it, here: http://jaimeserra-archivos.blogspot.com.es


Infographics for aliens

FIRST CONTACT PROBABLY INVOLVES SOME INFORMATION DESIGN.

They have green eyes on stalks, and huge brains, but will they like our infographics? This is a question that is often on my mind. The most important graphics of all time could be the ones we’ve attached to a spacecraft, or beamed into space.
Let’s take a look at three classics. (All are from the decade of the interstellar graphic, the 1970s.) And anyway, it’s a good excuse to use NASA’s retro logo.

pioneer10_nasa1

INFOGRAPHIC PLAQUE

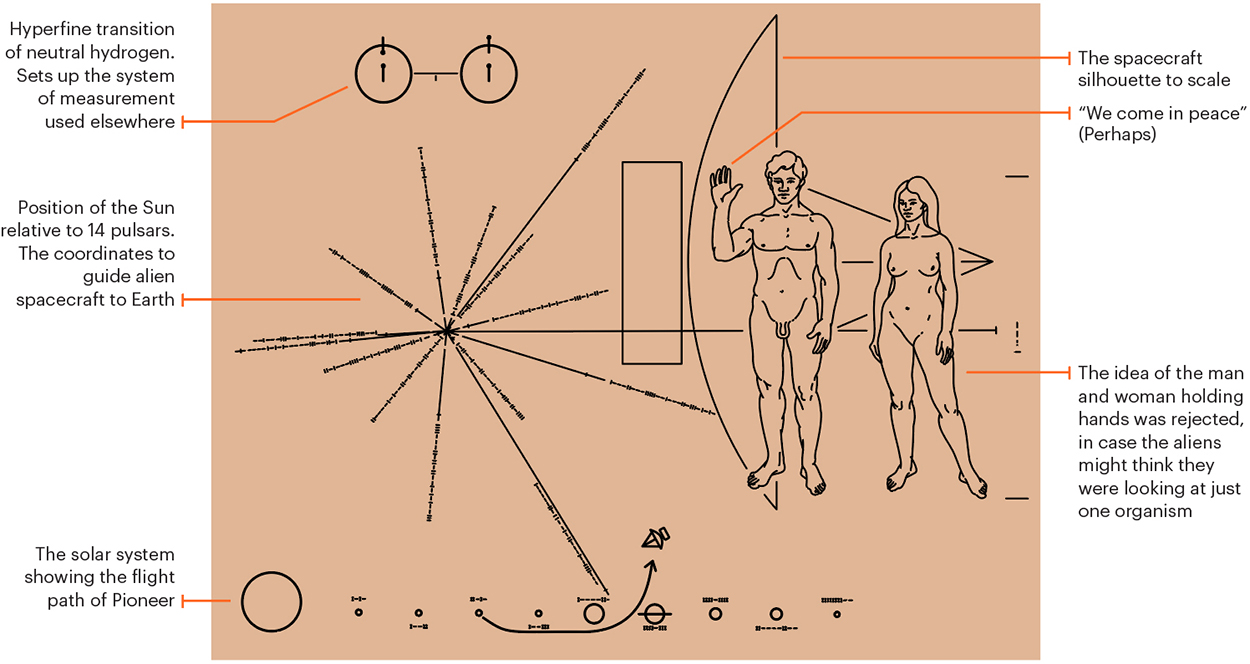
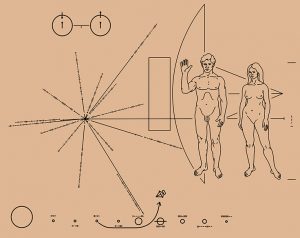
Pioneer 10, launched in 1972, was the first spacecraft to fly by Jupiter. By 2003, it was 7.5 billion miles (12 billion kilometers) out into space, when contact was lost. This gold-anodized aluminum plaque is attached to it, thanks to the efforts of Carl Sagan. The design is by Sagan’s wife, Linda Salzman, who had a tight deadline. There were only three weeks between the original idea and making the engraving. So perhaps we should make some allowance for that. (Incidentally, Pioneer 11 also carries a plaque.)
There was a lot of debate at the time about the nude figures. Some people wanted them to have modesty rectangles added. Others felt that although they were supposed to be “representative of all mankind,” they only represent Caucasians. And then there’s the “We come in peace” gesture, which unfortunately means “Go to hell” in Greece and Turkey. If the aliens take this sign the wrong way, we can perhaps expect a visit like this: https://www.youtube.com/watch?v=nxVxtvJWoqs

pioneer10_plaque


A MESSAGE TO THE STARS

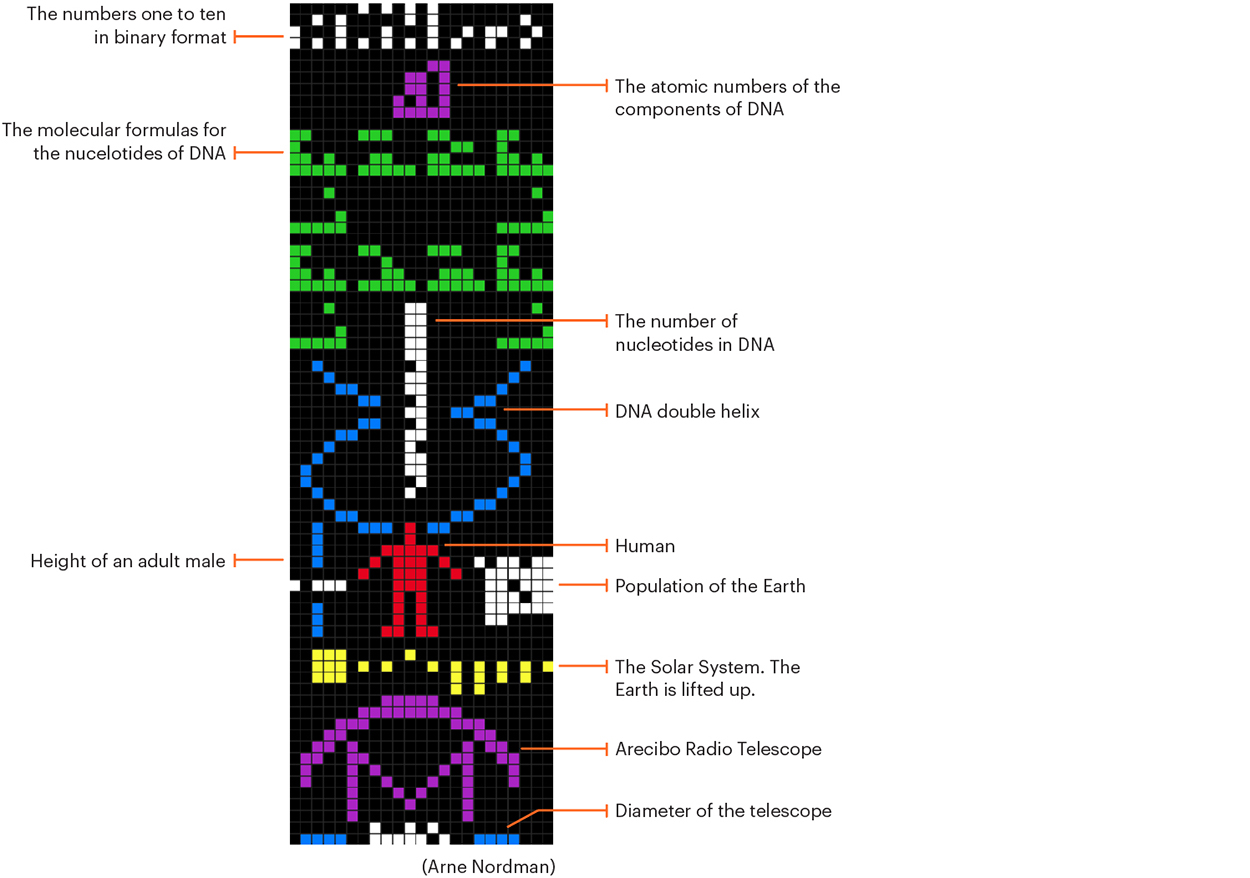
In 1974, the Arecibo Radio Telescope aimed a radio message at the star cluster M13, which is 25,000 light years away. Why there? Because it was in the sky at the time of the broadcast. The 1,679 binary digits (approximately 210 bytes) took less than three minutes to send. Obviously, the information is in black and white, but is colorized here to show the different components. Carl Sagan was involved with this one too.
It will only take about 25,000 years to get to M13, and 25,000 years after that before we get an answer. Unless the aliens are way ahead of us in terms of technology.

radio_message

THE GOLDEN RECORD

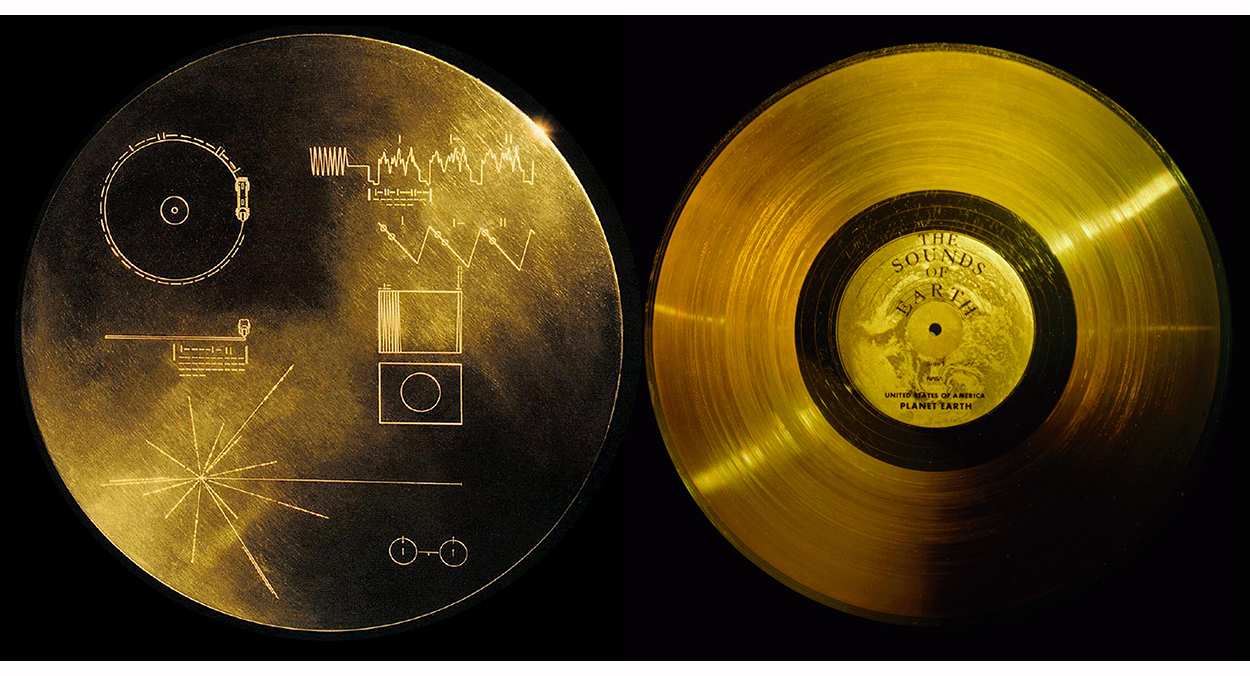
Another Carl Sagan-led project. Voyager 1 and 2 both carried a 12-inch disk, complete with cartridge, needle and diagrammatic instructions on the cover for playing the record. Of course, the aliens who capture Voyager in their tractor beam may not need those if they happen to have a compatible stereo handy. It’s very much an idea forever rooted in 1970s technology. The record contained spoken “Greetings to the Universe” in multiple languages, animal sounds, music, and a mixed-bag of images (see examples below). Quite what our bug-eyed potential friends will make of them remains to be seen. Voyager 1 is currently about 12 billion miles (19 billion kilometers) from Earth. And it will be 40,000 years before the spacecraft gets close to another planetary system, so perhaps we don’t need to worry.

golden_record1

fetus1

Fetus diagram.

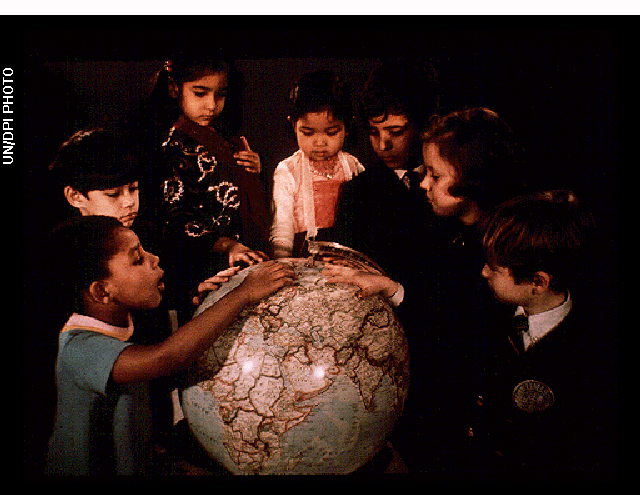
childrenglobe1

Children with globe.

eatingdrinking1

Demonstration of licking, eating and drinking. This one scares me, and probably our alien audience too.


Atlas heaven

A RECENT ADDITION TO MICHAEL STOLL’S IMPRESSIVE COLLECTION OF HISTORICAL INFORMATION DESIGN.

Quotemark1  I don’t cry often, but when this gem finally arrived on my desk, I nearly did. QuoteMark2

cover

The Atlas to Alexander von Humboldt’s “Kosmos,” by Traugott Bromme. Stuttgart: Krais & Hoffmann, 1851

THE SEARCH

“It began after I heard a radio discussion about the influential German geographer and explorer, Alexander von Humboldt. Although the publications containing his findings dealt with geographical, botanical and weather related topics, there were very few explanatory graphics. Humboldt clearly didn’t intend “Kosmos” to be a textbook for use in schools and universities, even though it was a summary of the talks he had given over the years. Nevertheless, the public recognized the exceptional content of the book, although they probably didn’t understand the details as well as they might. There was a demand for a more popular and explanatory version. Traugott Bromme’s atlas was a companion volume that responded to that need.

After almost a year of searching (these things can take a while), I stumbled upon a copy that was up for auction. No one (except me) made a bid for it, probably because the listing describing the item contained many spelling errors.”

MY OWN COPY.

“The atlas measures only about 13 by 11 inches, is leather bound, and except for the foreword (which was set in movable type), all of the 42 pages have maps, diagrams and charts. They are steel engraved in such impressive detail, that you need a magnifying glass to discover the smallest spills of lava or rocks, thrown out by a volcano. Then you realize that all the engravings were water-colored by hand. You can feel the passion and dedication of the author and the publisher.

These two plates are my favorites”. (For larger images, click on the examples.)

atlas_a

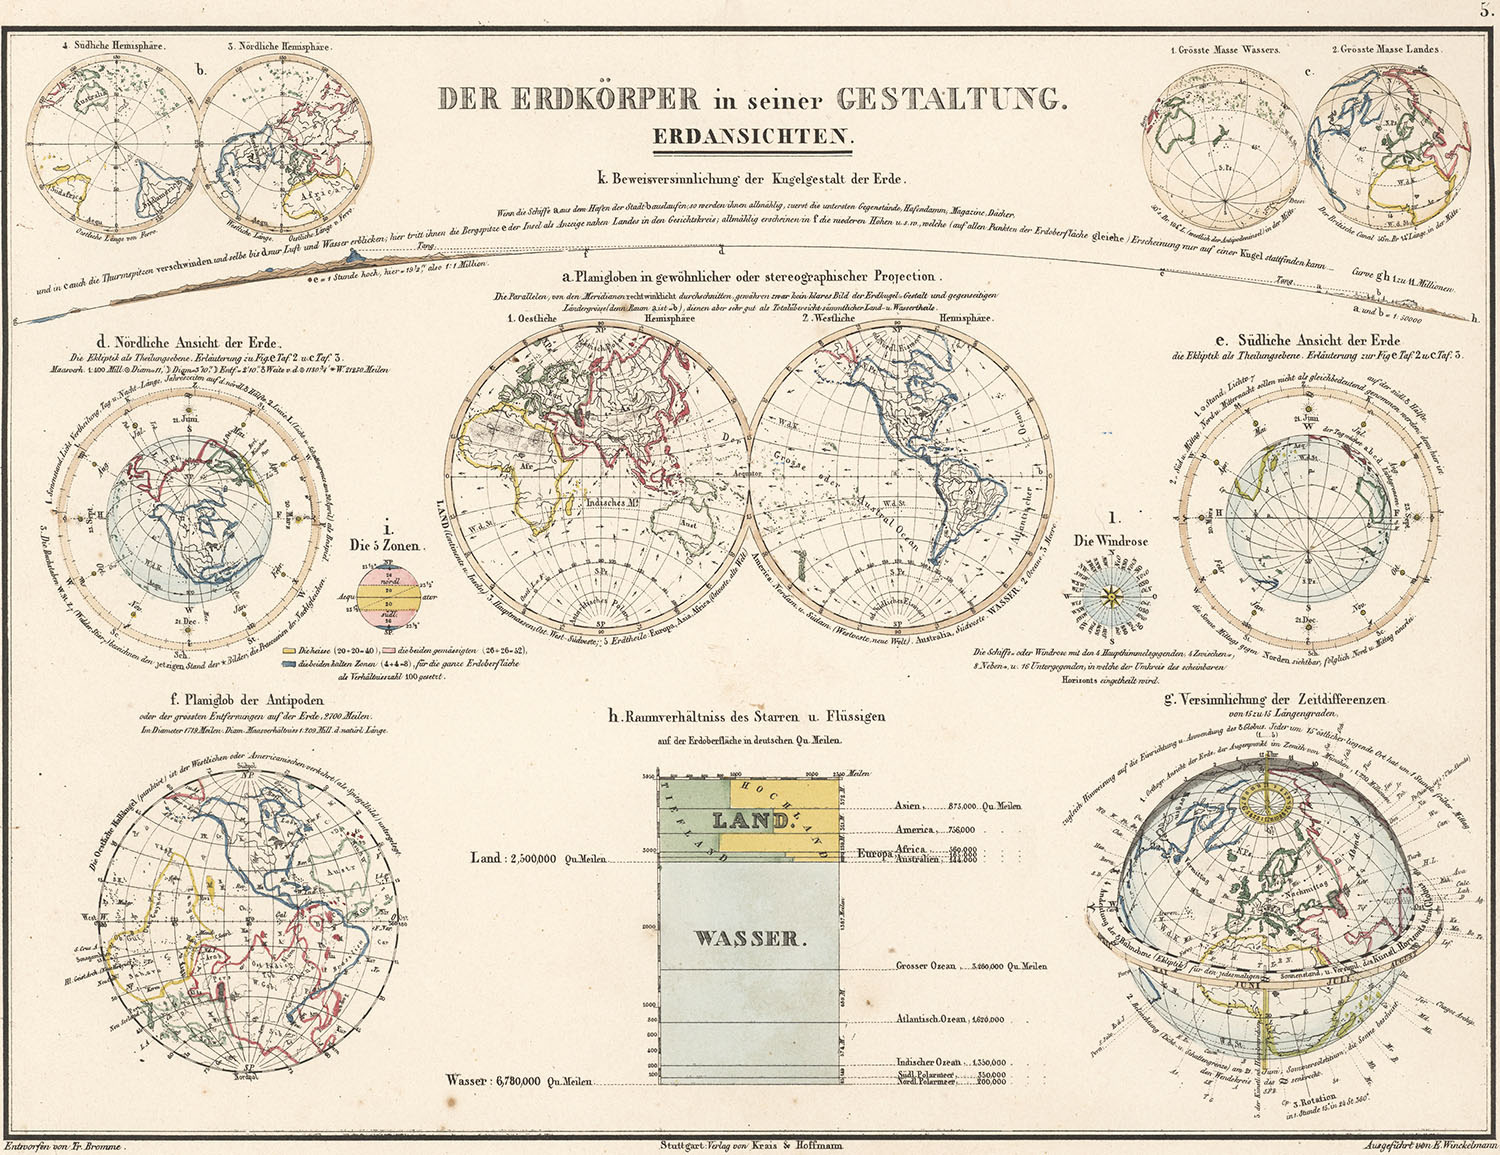
The design of the Earth.

“An elegant symmetrical layout, with integrated descriptive text elements. In the top center of the page, Bromme explains, in two lines of text, the visual effects of a curved surface. A sailor approaching a harbor first sees a mountain peak before he sees the shore, harbor walls etc. The two lines of description curve with the diagram. We know this convention from the way river names are shown on a map, but here it is used to link the words to the image. The colored chart at the bottom tells us immediately how the Earth’s surface divides between land and sea, and how many square miles of land are in each continent”.


atlas_b

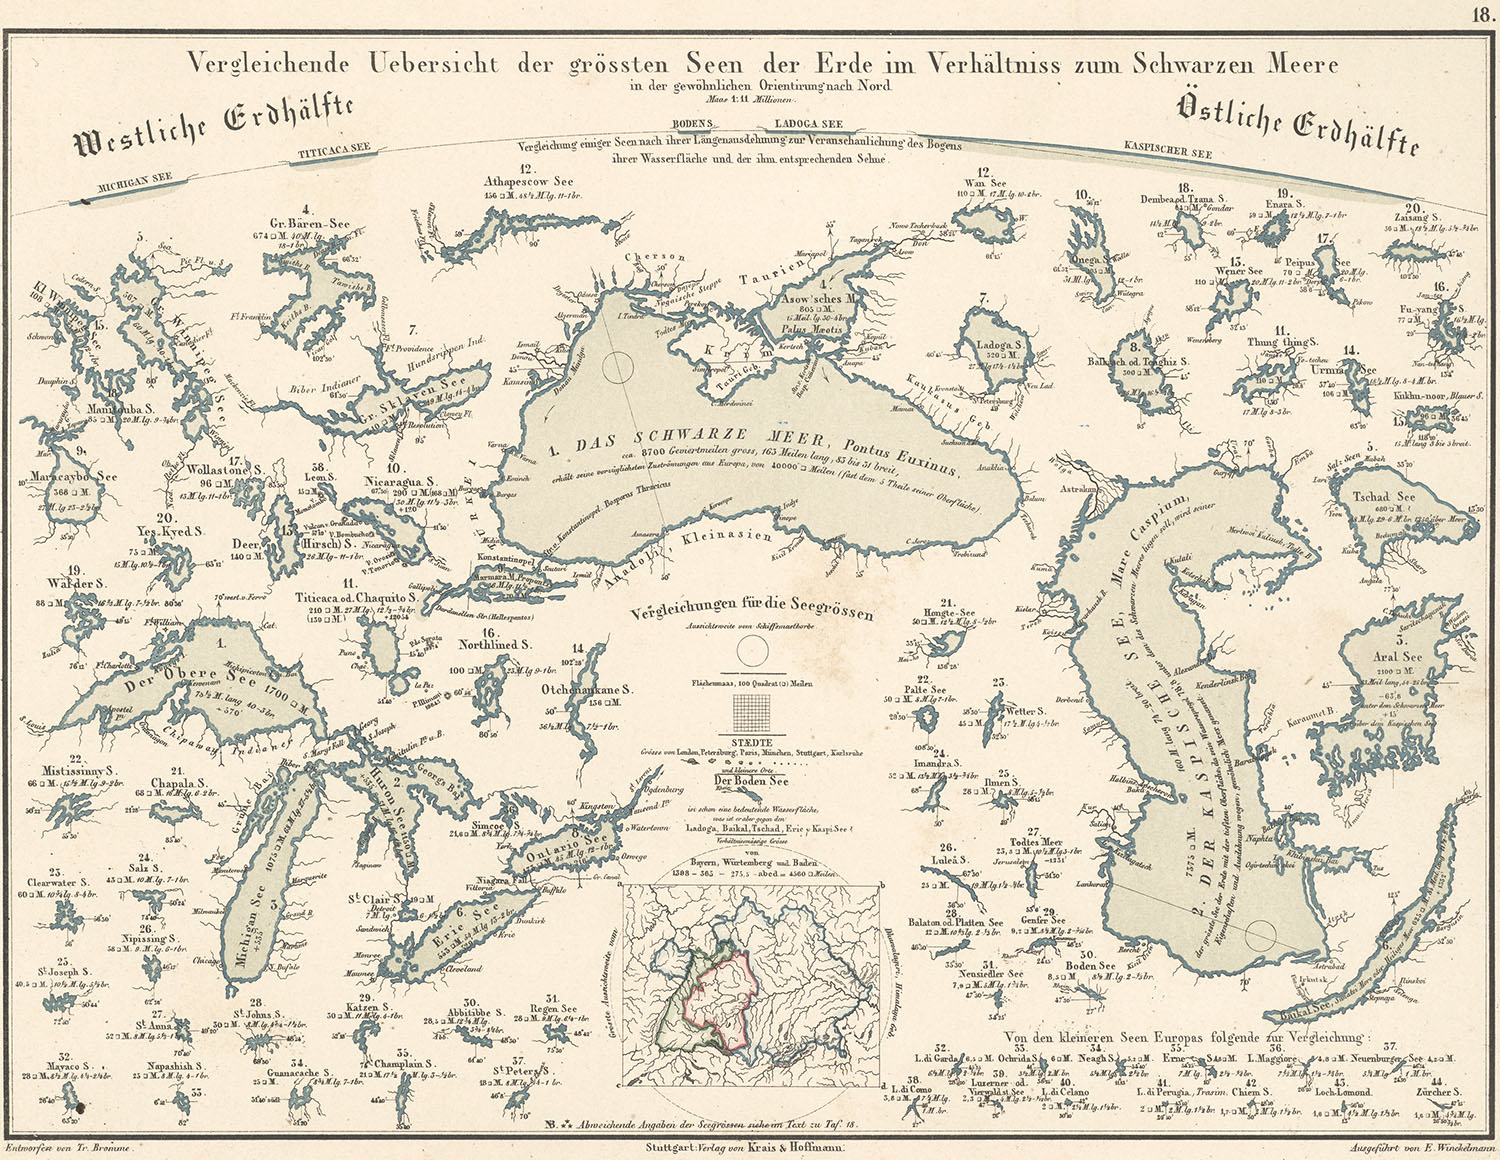
A comparative overview of the biggest lakes on Earth, in relation to the Black Sea.

“Each lake is precisely outlined, with its size in square miles, position above sea level, length and width, major inlets, and location so the interested reader can find it on any map. You could almost miss this, but the lakes carry small numbers, which rank them by size, and they are subdivided into Western and Eastern Hemispheres. A nice addition is the small circle, that appears several times, to indicate how far you would be able to see from a ship’s crow’s nest.

I don’t think the slow food movement results in great food all the time, but I do think that, on this occasion, a slow, and well-conceived, design and production process resulted in a wonderful atlas”.


See the full atlas here: http://www.e-rara.ch/zut/content/titleinfo/2551486

You can even download the whole book as a pdf from this site.


Michael teaches media theory and infographics at the Augsburg University of Applied Sciences, where he is head of the information design study track in the Department of Design. He has amassed a broad collection of historical information design, that is completely made up of original books, maps and posters. In the digital age, with images at all kinds of sizes all over the internet, he feels it is very important to go to the source and see historical infographics in their original context.

When infographic dinosaurs roamed the Earth

YES, THERE WERE SIGNS OF GRAPHIC LIFE BEFORE THE COMPUTER.

houses3
tomatoes_sneakers5
A very long time ago, I carried around a bag of technical pens, french curves, ellipse templates and shiny drawing instruments. And somehow I used them to make the examples shown here. All of my early work was produced in black and white. Sometimes I almost thought that the world was really monochrome.
bow2
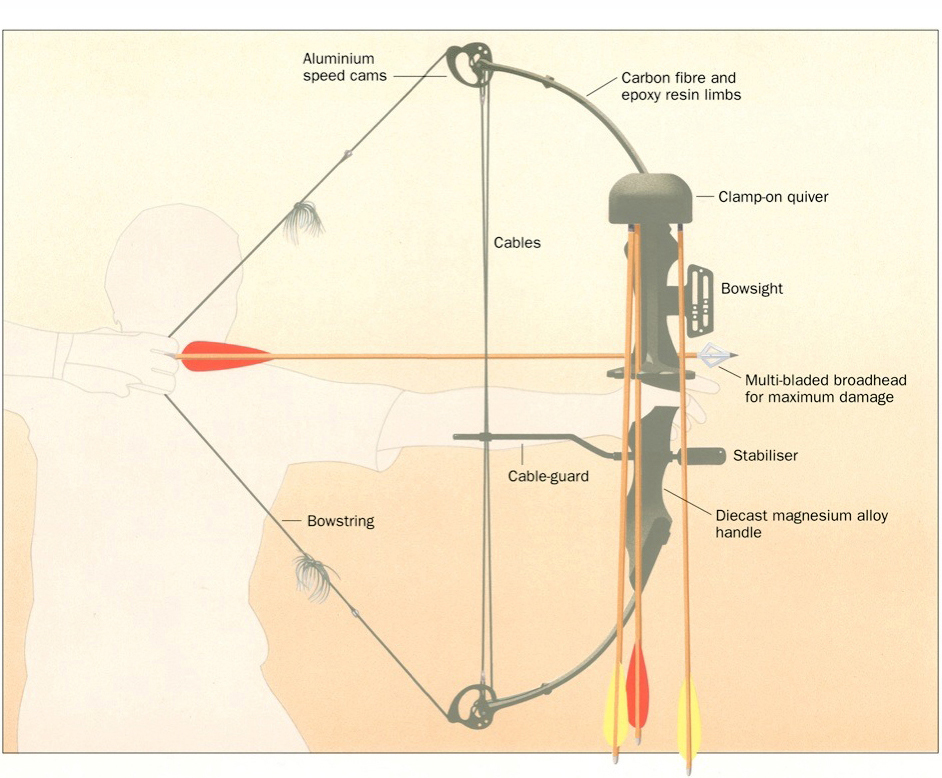
Then came color. Gouache and paintbrushes. The airbrush process (seen here) alternated between euphoria and misery (when the equipment suddenly malfunctioned). The outline of this archer was drawn on a film overlay with a technical pen.
overlays4

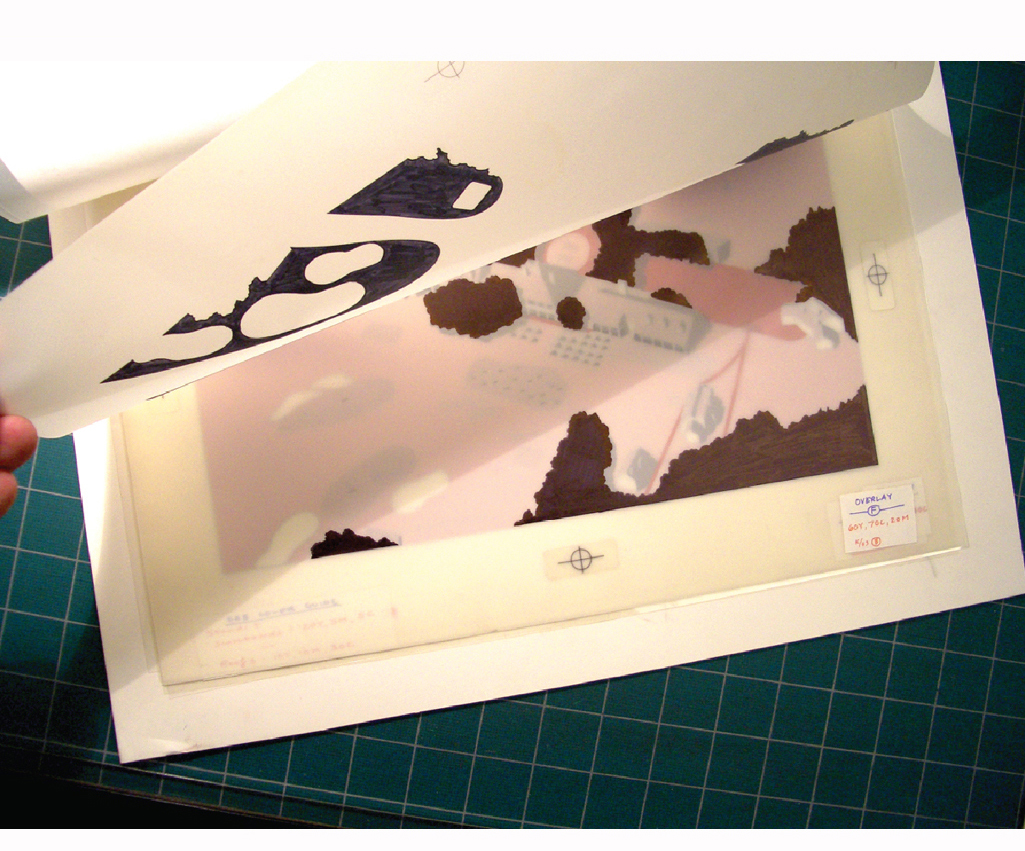
My next infographic phase involved producing “mechanicals.” Artwork that was made up of layers of film over a keyline base layer. Countless hours were spent cutting rubylith film with a sharp knife and peeling away the unwanted areas, or filling in areas with black ink. Adhesive registration marks kept it all aligned, and you needed a lot of them as there was often a substantial stack of layers. The last step was to make a mind-blowing guide for the print technician to piece it all together. Infographics people would impress each other with statements like, “That’s nothing. I did a map yesterday with twenty-two layers”.

markup2
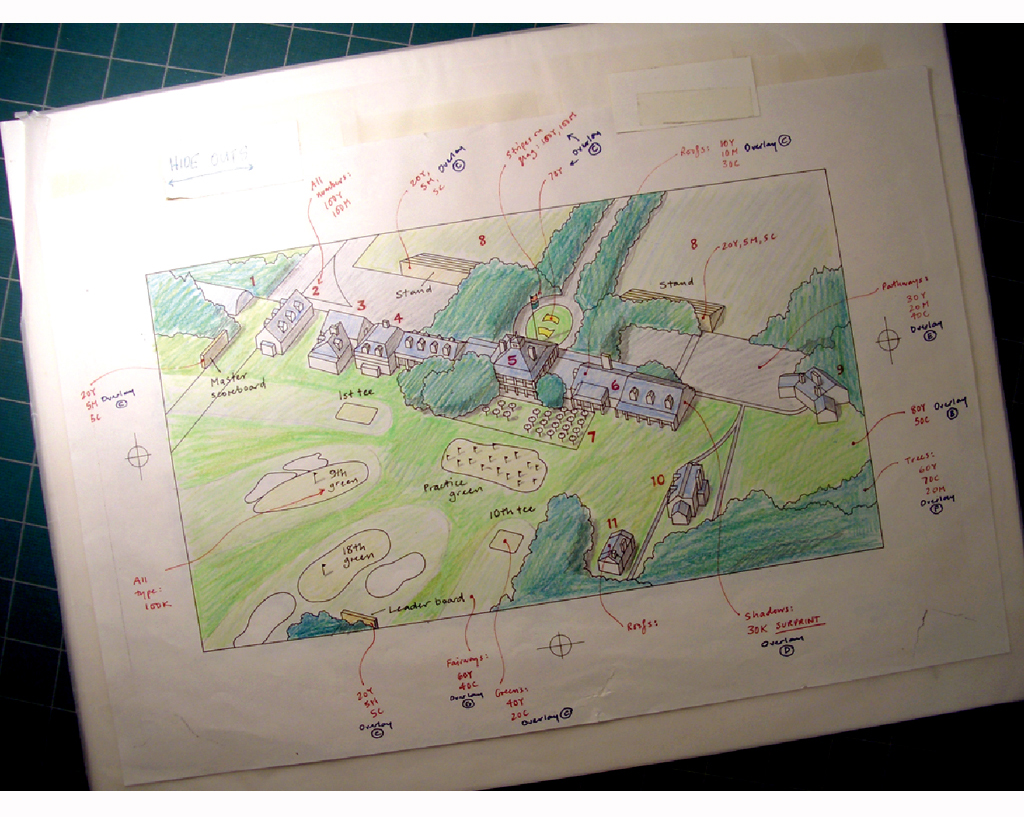
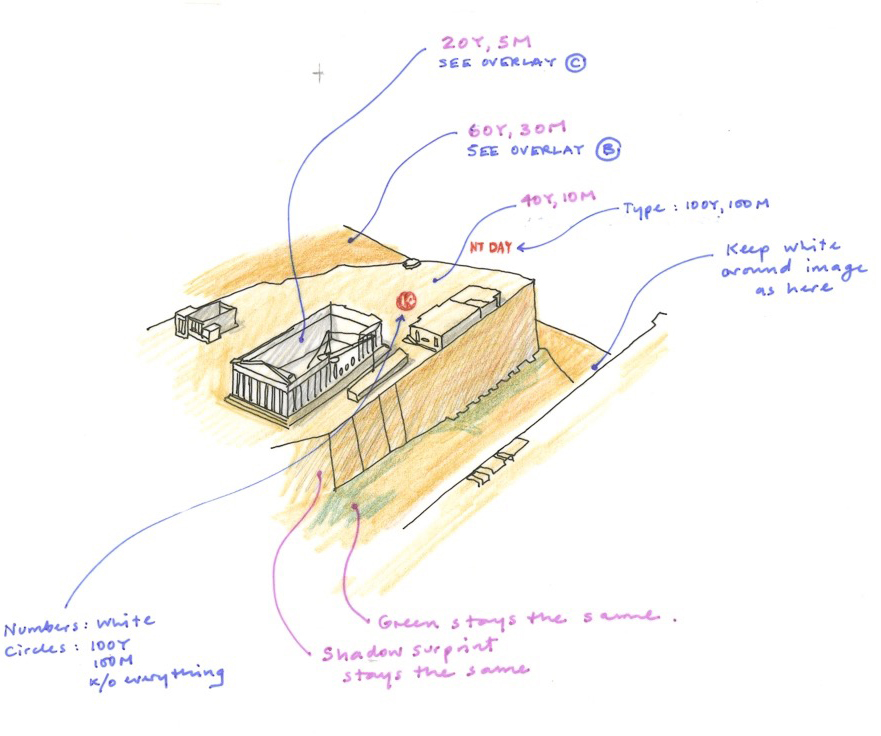
Here’s an example of a markup that would guide the technician who put together the color separations for printing. How it was done correctly always amazed me. I have a sense of wonder about it to this day. In a later era, but before I had a computer, I sat with the technician as the graphic was assembled on a computer monitor.
 parthenondec88_3
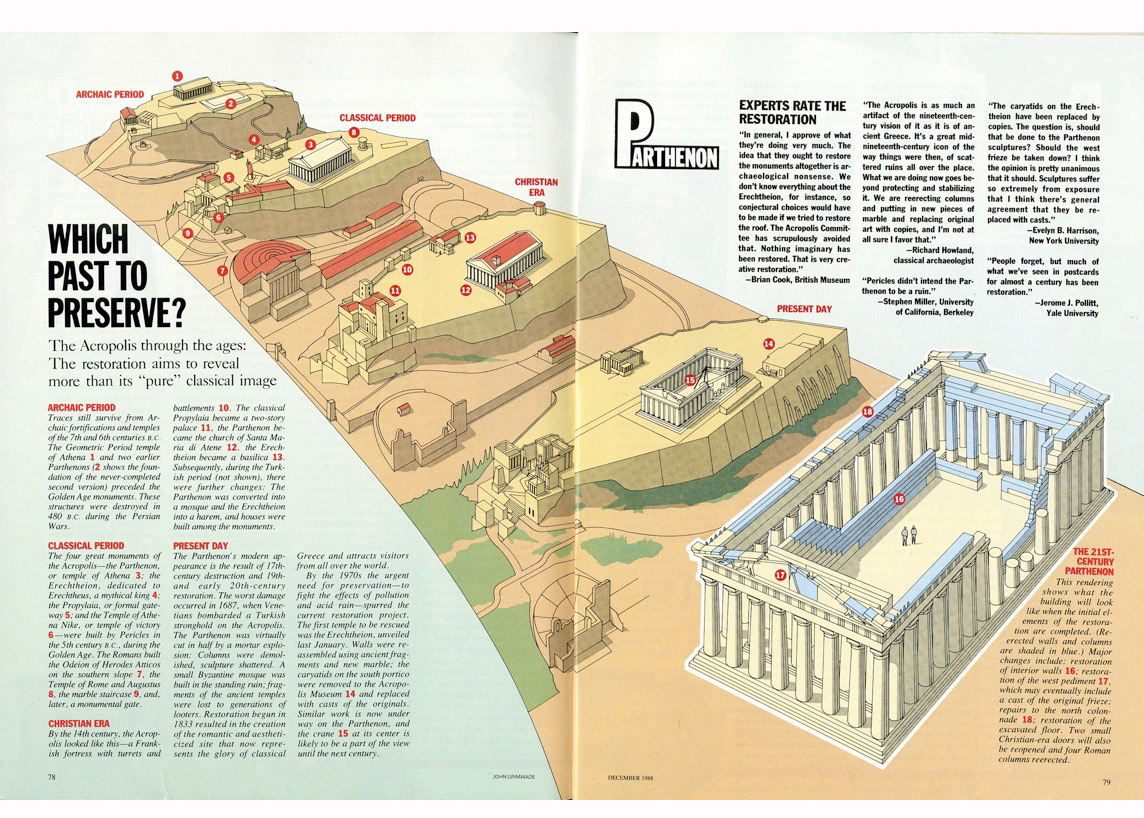
This 1988 spread from Condé Nast Traveler magazine was produced as a mechanical.
Below is a color guide used to revise the graphic after the first set of separations. It accompanied the proof version, which had overlays B and C attached to it.
colormarkup
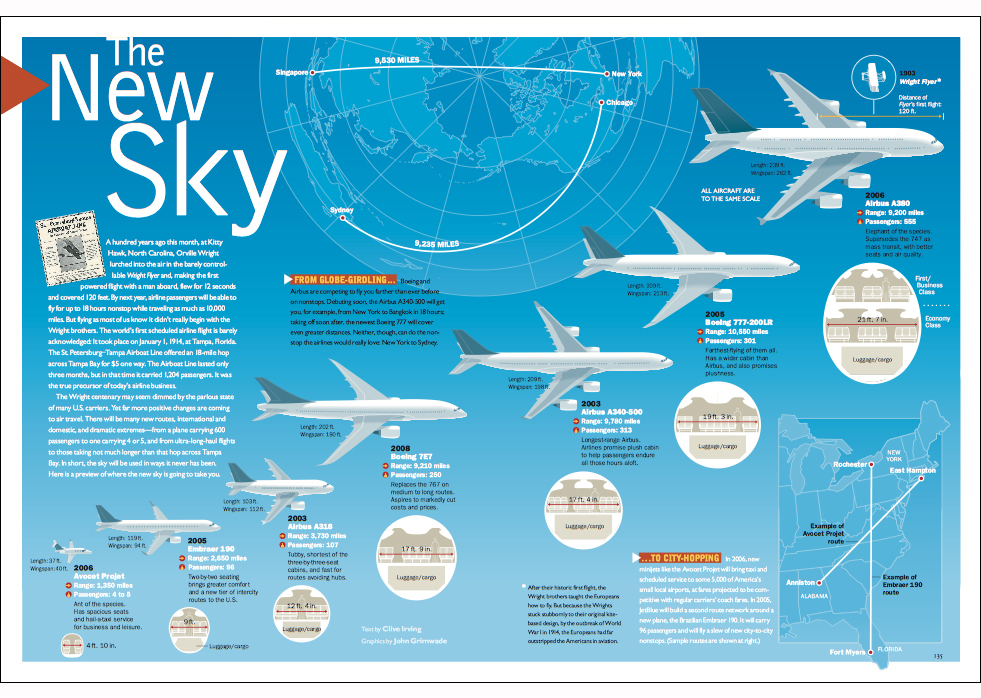
newsky_rough
newskyspread4
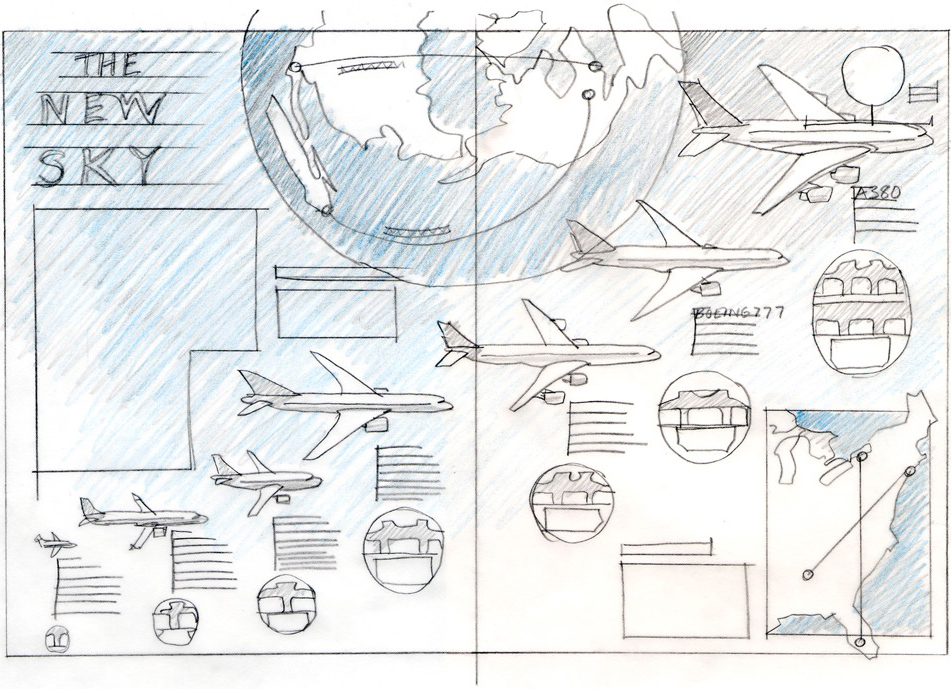
In the pre-computer era, you could not easily make changes once you were into the artwork phase, so you had to be sure you had a good plan. Or risk a nervous breakdown. The process of making a rough sketch carried over into my computer-generated world. The following statement is not a revelation (many designers much younger than me use this method), but drawings are a great way to both work out ideas, and get feedback from your editor or client, who knows the sketch is the language of a flexible idea.

A rough assembly in Illustrator (or InDesign or Photoshop), with real components, is not the same thing. People can feel intimidated about suggesting changes because you’re presenting something that looks like a finished item. At least, that’s my opinion.

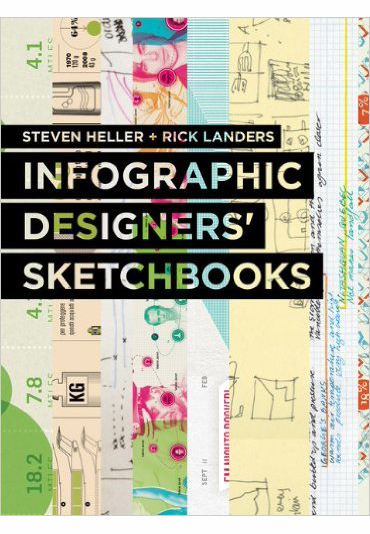
 infographic_designers_-sketchbooks2

The ultimate pencil

WOULD YOU PAY $75 FOR ONE?

EF602_box

The Eberhard Faber Blackwing 602 is considered by many people to be the last word in pencils. Nothing else compares. The trouble is, it went out of production in 1998. You can find one (or a box like this) on eBay. But watch out, it can cost as much as $75 for each pencil. Apparently, there are Hollywood screenwriters who cannot function at all without this pencil. “There is no way I’m writing that screenplay without a Blackwing 602,” they scream. And it has to be the original (alternate shown below), or they’re going home.

Palomino602

I’m happy with the modern version, the Palomino Blackwing 602, which has been around since 2008. I’m not too freaked out by the change in the eraser color either. But some people…


Mega-globes

FORGET THE TABLE-TOP SIZE ONES, THESE ARE THE REAL STATEMENT PIECES.


Unisphere_jg_1

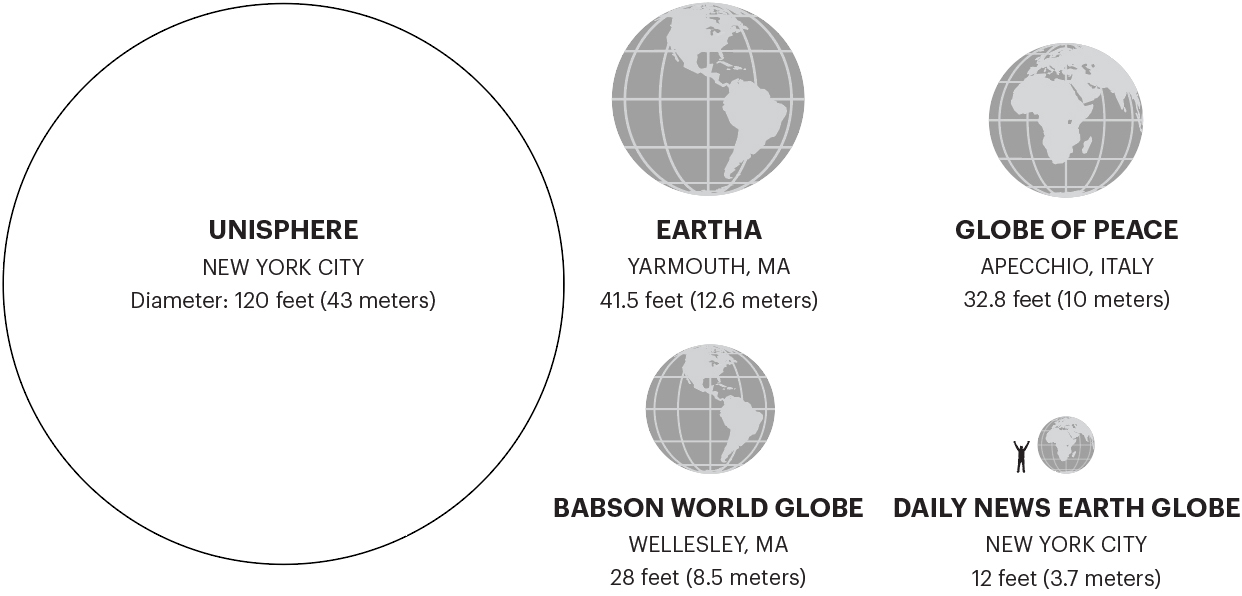
The Unisphere was the centerpiece of the 1964/65 New York World’s Fair, and remains the world’s biggest globe. That’s me underneath it, to give a sense of the scale. Michael Stoll* (who took the photo), later sent me some information about other big globes. And to see how they all compare, I made the simple graphic below. Unlike the massive stainless steel Unisphere, which weighs 700,000 lbs (320,000 kilos), and never moved, they all rotate, or once did. (*Examples from his superb collection of historic infographics will be featured in future posts.)

Globe_comparison_a

Some additional information about the Unisphere and it’s rivals:

Unisphere

The three rings represent the orbits of the first satellites. The globe suffered considerable (but fictional) damage in the movie Men in Black when a downed alien spaceship crashed into it. The real Unisphere was restored in the 1990s.

Eartha

At the headquarters of DeLorme, the GPS and mapping company. Installed in 1998. The largest rotating globe in the world.

Globe of Peace

A wooden framework covered with a fiberglass skin. It can hold about 600 people on three floors, and contains information about every country in the world. Shares the name of a totally unrelated (and considerably smaller) globe in Star Wars, which is a revered relic of the Naboo people.

Babson World Globe

Dedicated in 1955, but fell into disrepair by the 1980s. Restored in 1993, although it no longer rotates.

Daily News Earth Globe

The Daily News lobby was featured in the 1978 movie Superman as the lobby of the Daily Planet. The globe was installed in 1930.


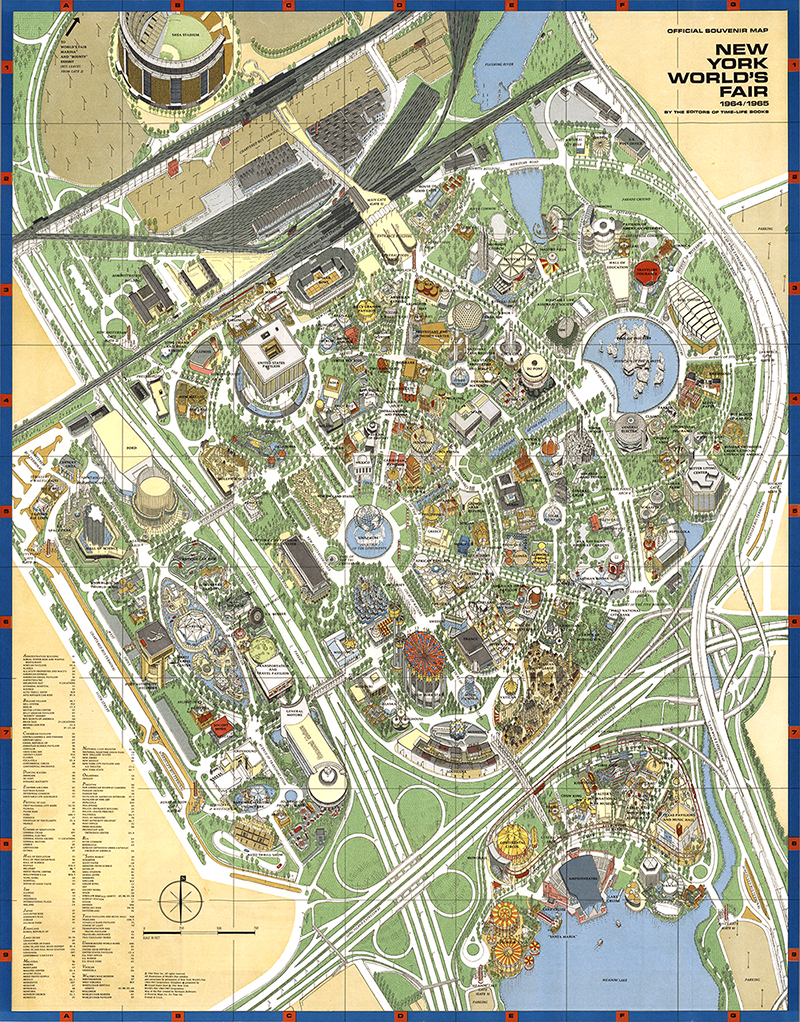
This map of the 1965 New York World’s Fair site, with the Unisphere at it’s center, is on the wall of my office. It was produced by the master cartographer, Hermann Bollmann.

BollmanNYWF


NYWF65detail

It was a gift from Michael Stoll and some of his students at the University of Augsburg. I love it.

This blog started 35,000 years ago

FROM CAVE TO SUPERCOMPUTER: INFOGRAPHICS HAVE ALWAYS BEEN ALONG FOR THE RIDE. HERE’S A (BRIEF) HISTORY OF INFORMATION DESIGN.

VallortaCave

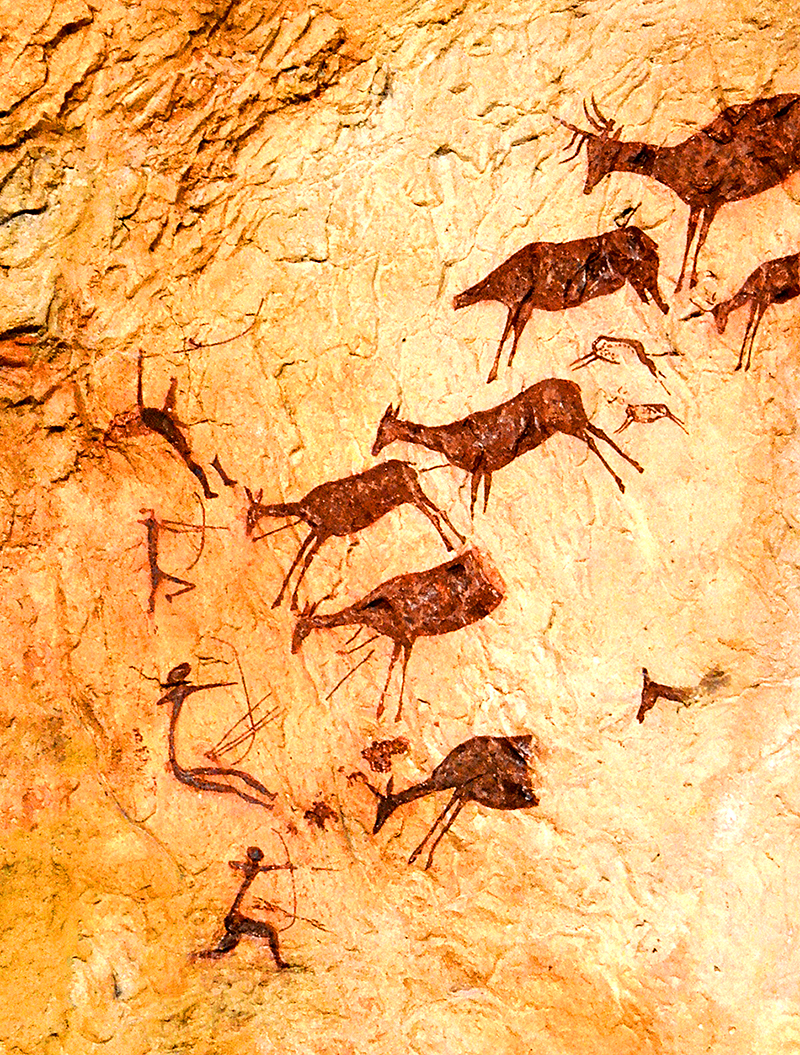
Cave infographics It all began at least 35,000 years ago. Visual communication was off and running. Perhaps even before the spoken word, although that statement is the subject of considerable debate. I’m guessing that if the cave painters could speak to each other, they probably didn’t use the word “infographic.”  (This example is from Valltorta, Spain.)

Egypt2

Pyramid Schemes Jump forward 28,000 years or so, to a written language based on pictograms. Modern decoding didn’t begin until 1899, with the discovery of the Rosetta Stone (dating from 196 BC), which displays the same passage of text in hieroglyphs, Demotic script, and Greek. It was the key to understanding the exact meaning of the symbols.

Illuminated2

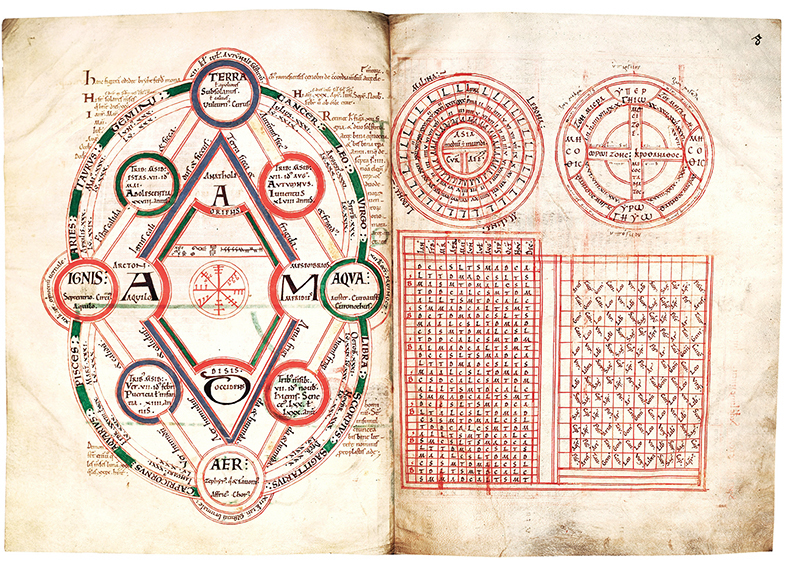
Illuminations Illuminated manuscripts were produced mainly in monasteries during the early Middle Ages. By the 14th-Century, they were mostly produced by commercial scriptoria. Exquisitely decorated, sometimes with gold and silver (hence illuminated), and worth shocking amounts of money today. They contained plenty of diagrams. The development of printing signaled the end of these masterpieces.

VitruvianMan

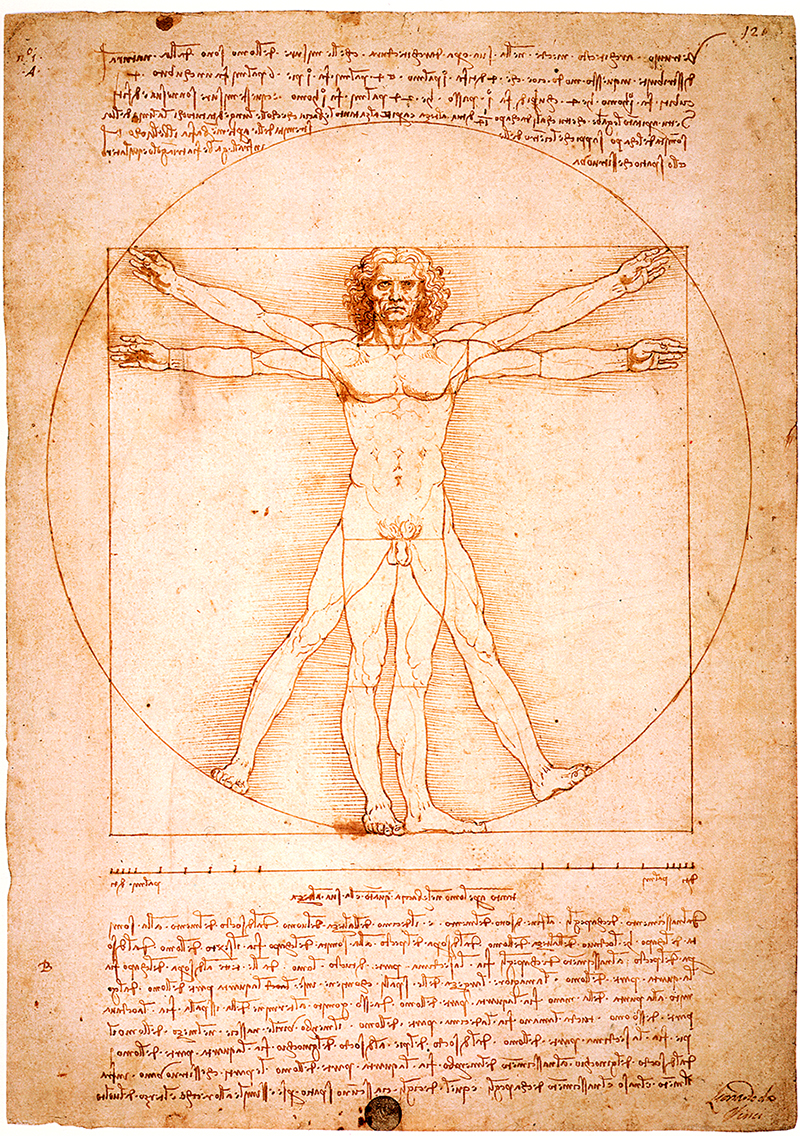
1490: Leonardo Who? A Florence-based infographics director set the bar for the next 526 years. The Vitruvian Man is based on the ideal human proportions as described by the Roman architect Vitruvius, who specified them as the principal source of the proportions used in classical architecture

Copernicus

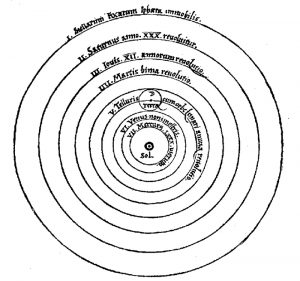
1543: The Earth is Apparently Not the Center of the Universe Nicolaus Copernicus figured out that the planets orbit the Sun, and made this diagram to demonstrate it. The book that contained it, Dē revolutionibus orbium coelestium, was not published until just before his death. To say it was a controversial viewpoint is somewhat of an understatement. A Catholic Church ban, that started in 1616, lasted 219 years.

Ortelius

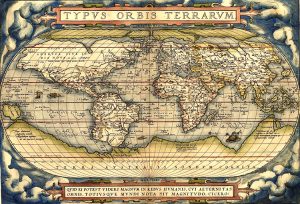
1570: Location, Location, Location Abraham Ortelius published the first modern atlas: Theatrum Orbis Terrarum (Theatre of the World). A collection of 53 maps by various cartographers.

NewtonPinkFloyd

1704: From Newton to Pink Floyd Issac Newton’s diagram in Opticks explained the spectrum of light. 269 years later, a variation of this idea became famous as the cover of Pink Floyd’s mega-selling album Dark Side of the Moon. Curiously, Newton would have looked at home as a member of the band.

Playfair

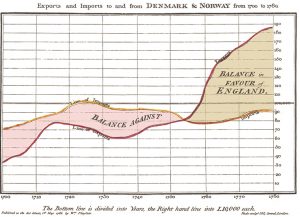
1786: “Honey, I just invented the fever chart!” William Playfair gave us the bar chart and fever chart, and the curse of boardroom presentations, the pie chart (in 1801). An internet search for “pie chart“ reveals endless scary examples. Try it.

John Snow's cholera map of Soho

1854: Disease Control Dr. John Snow located a water pump as the source of a cholera epidemic in London, by mapping the locations of deaths from the disease.

Darwin

1859: Tree of Life The only illustration in the first edition of Charles Darwin’s On the Origin of the Species was an infographic that outlined the process of natural selection.

Minard

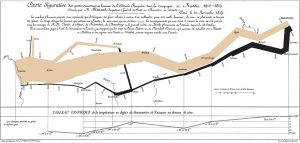
1869: Chart of Death Napoleon’s disastrous 1812 trek to Moscow and back was powerfully visualized by Charles Minard. The width of the path represents the number of surviving troops. It’s considered an infographic classic, especially by academics.

Beck

1931: Underground Diagram The style for every subway map in the world is directly descended from the work of a British technical draughtsman, Harry Beck.

Isotype

1935: Pictogram Pioneer Otto Neurath’s system of pictograms, Isotype  (International System of Typographic Picture Education), has had a profound influence on graphic design, and still looks surprisingly modern today. (Founded in 1935.)

Crick

1953: Double Helix The first diagram of DNA, published in the scientific journal, Nature. Infographics don’t get much more important than this. Michael Crick and James Watson discovered the DNA model. (The discovery of DNA itself occurred much earlier.) The first visualizations were drawn by Michael Crick’s wife, Odile.

PioneerPlaque

1972: Infographics for Aliens If extraterrestrials ever get to see any of our infographics, this will probably be the first one. Carried on two Pioneer spacecraft (launched in 1972 and 1973), it shows some basic details about the human race and plots our location. Pioneer 10 is currently at least 11 billion miles out into space.

MacClassic

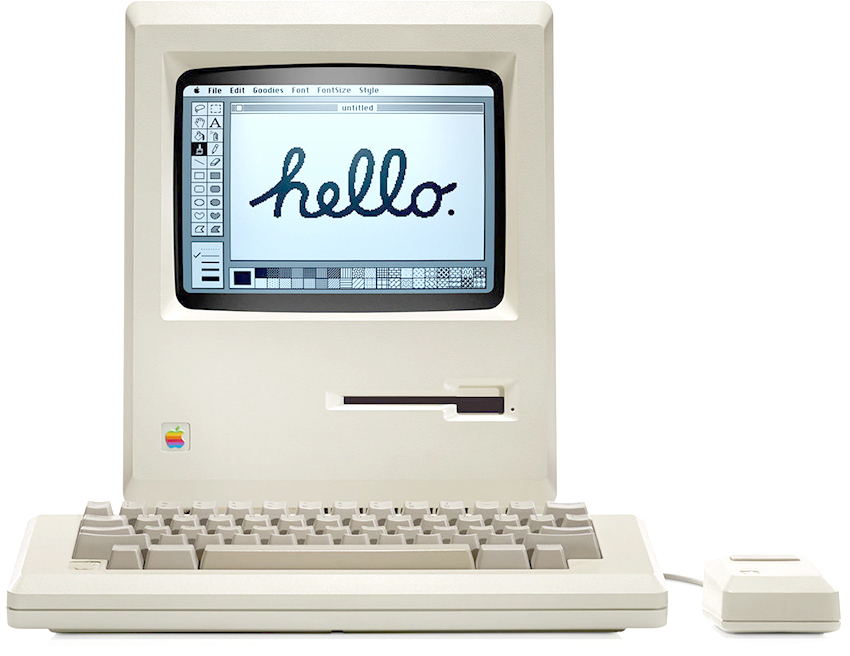
1980s/90s: OK, Computer Infographics went digital, and the tools changed dramatically. MacDraw, MacPaint, Illustrator, Photoshop. It was all happening.

LutzHuman

GuardianHousePrices

http://www.theguardian.com/society/ng-interactive/2015/sep/02/unaffordable-country-where-can-you-afford-to-buy-a-house

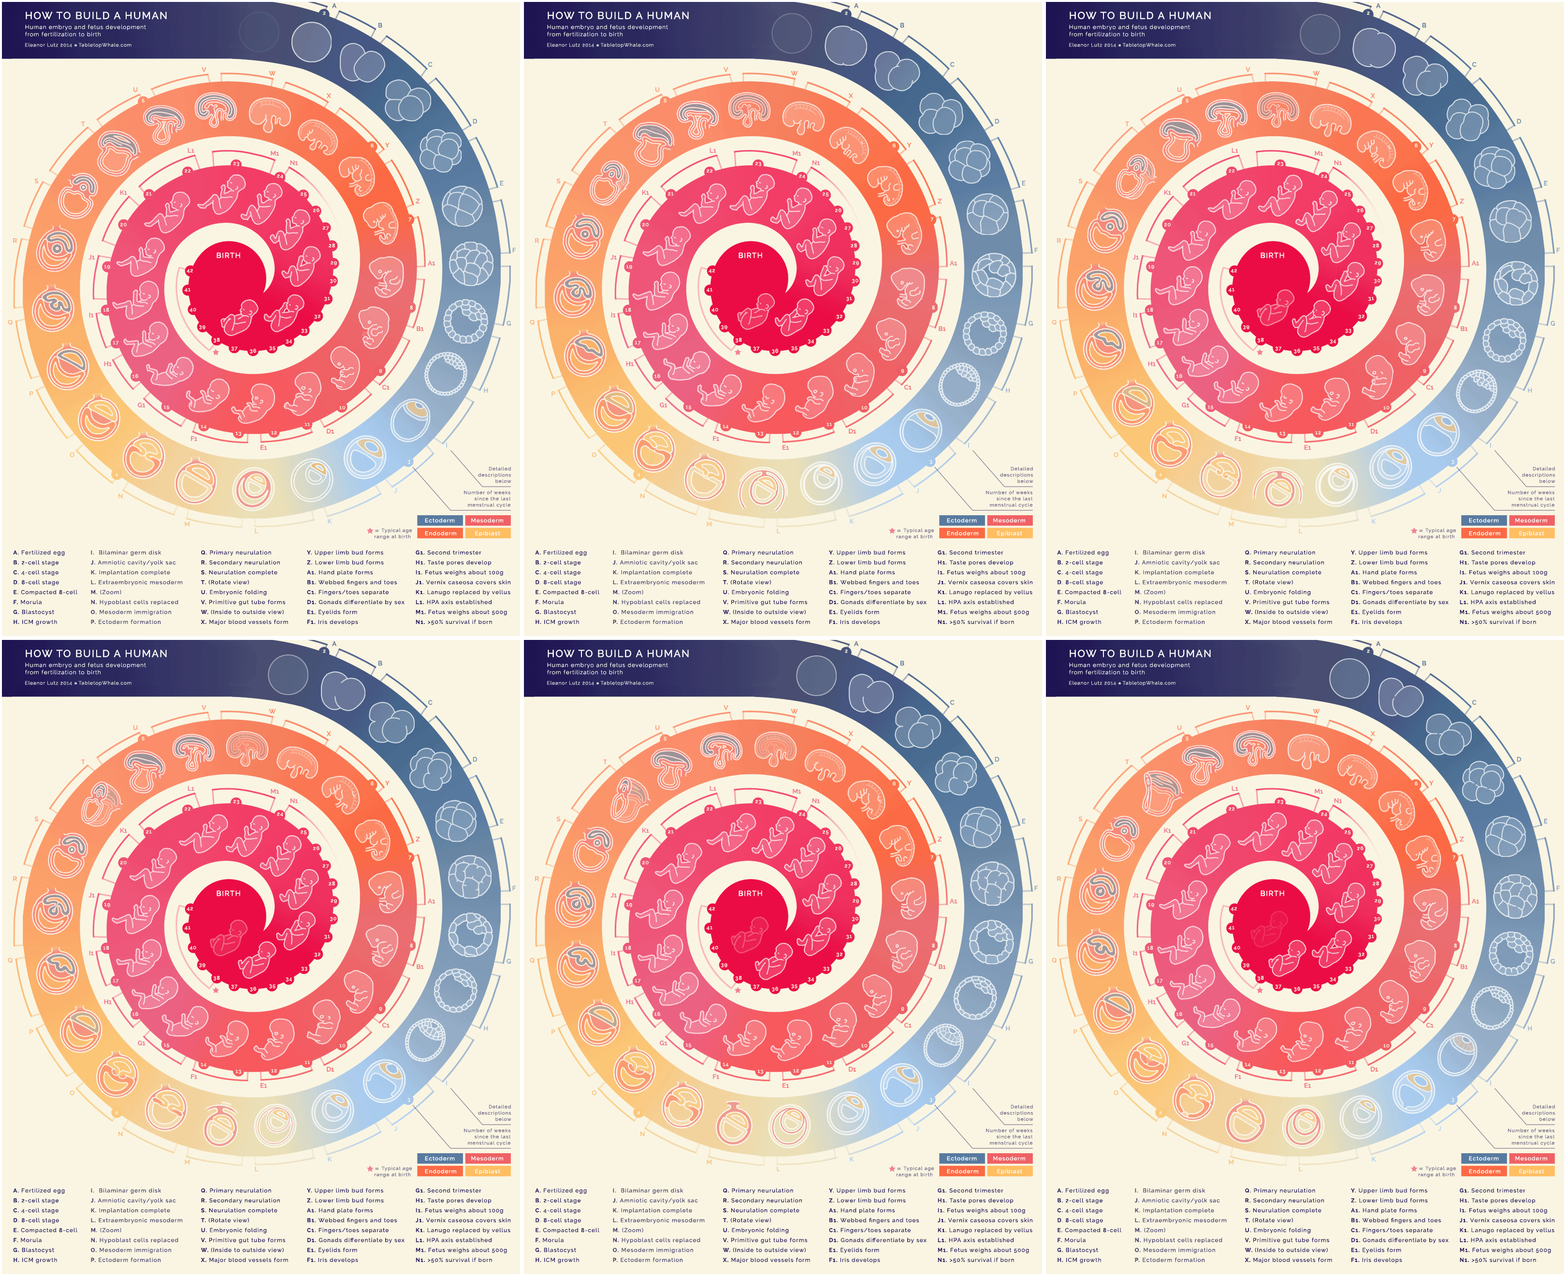
Now: Multi-Platform/Big Data There’s a crazy number of presentation options, so infographics need to work effectively in multiple digital formats. “Mobile-first” is the mantra of many organizations. And then there’s Big Data. Intriguing data sets are everywhere, and everyone is looking for ways to find the truths within them, then present those revelations visually. That’s the challenge, and it will frequently be the subject of this blog.