Category: Infographics

The dawn of digital

COMPUTER INFOGRAPHICS ARRIVE ON THE SCENE.

A guest post by a digital news graphics pioneer, Karl Gude, who is now a professor in the College of Communication Arts and Sciences at Michigan State University. Karl is Director of the Media Sandbox.
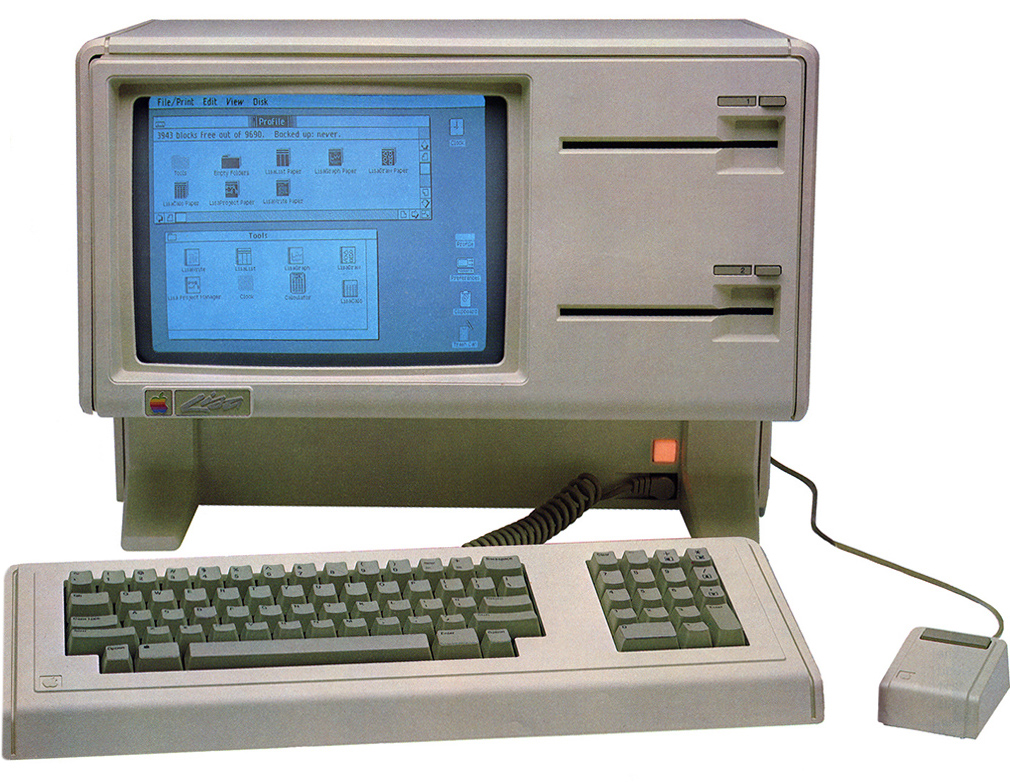
(Above: State-of-the-art in 1985, the Apple Lisa. It cost $24,000 in today’s money.)

Apple to the rescue

Grrrr… As a news artist working in the late 1970s and early 1980s, I hated plotting graphs by hand, like the ones below, (my boss wanted me to make charts like “Nigel Holmes in Time!”), and I made a lot of them. My fingers were black with ink and nicked by X-Acto blades. But by the mid ‘80s, there was a bright light on the horizon: Apple was making computers that could plot a graph with the click of a mouse.
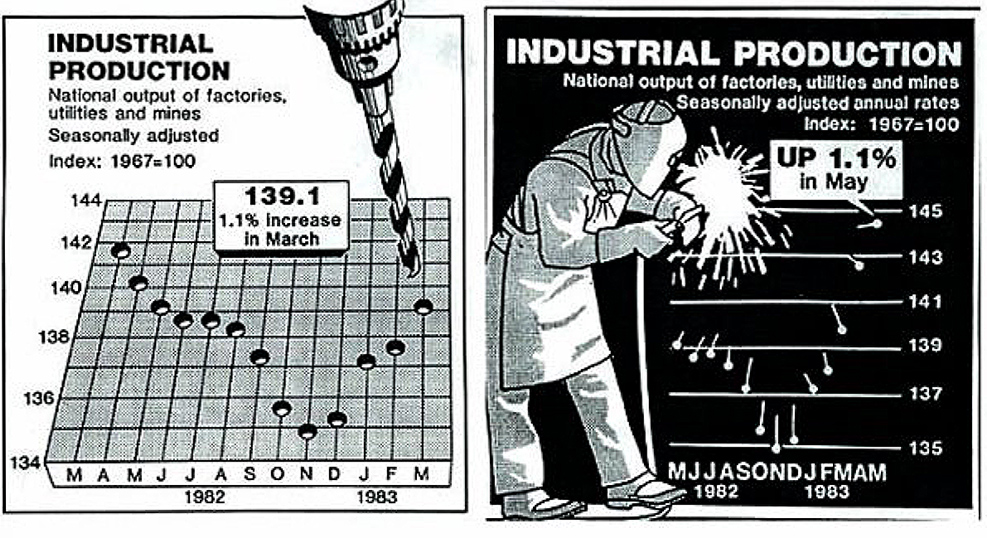
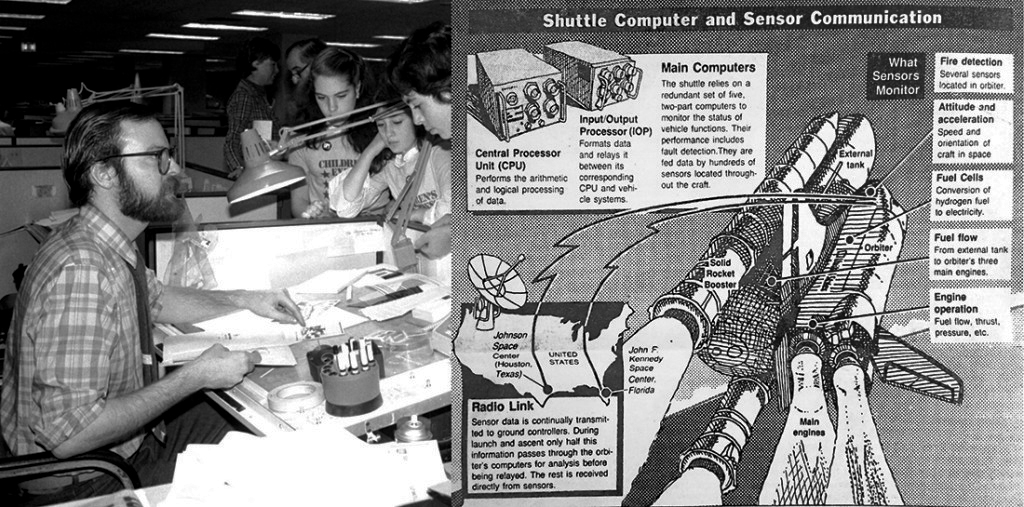
United Press International in the 1980s. All news graphics were drawn by hand.

Life with Lisa

In 1985, I was working for the news agency, UPI, in Washington, D.C., which sold infographics to newspaper clients. We purchased two Apple Lisa computers which could generate simple maps and charts. Apple flew executives out to help us set them up, including Apple iconographer and designer Susan Kare (http://kare.com). Her icons for the operating system are shown below. Apple was excited that the news industry was interested in their products, and if UPI used their equipment, our 1,600 newspaper and TV clients would also have to use it to edit our graphics, if only to delete the byline!

Back to analog

I moved to the New York Daily News as their News Graphics Director in 1986. Unfortunately, it was back to the drafting table, and the old ways of doing things, but not for long. The editor was against spending money on graphics technology, but he agreed to allow me to rent one Apple Macintosh, or Mac (a bit better than the Lisa for graphics), to create infographics for a special series we were doing on transit in New York. The Mac was a crowd-pleaser, and when the editor saw what it could do he allowed me to purchase six of them. Out went the art tables, and in came the complaints. Most of the staff didn’t like this new way of making graphics and drawing, but before I could see how it all turned out, I moved to the Associated Press.

The Associated Press goes digital

Again, drawing tables! But, AP was already considering Macs, and the transition from drawing tables to computers happened quickly. I felt sad though, at the sight of about 12 battle weary, ink-stained and cut up drawing tables lining a long hallway waiting to be shipped to a warehouse. They were replaced with flat desks with Macs sitting atop 20-megabyte (!) hard drives.
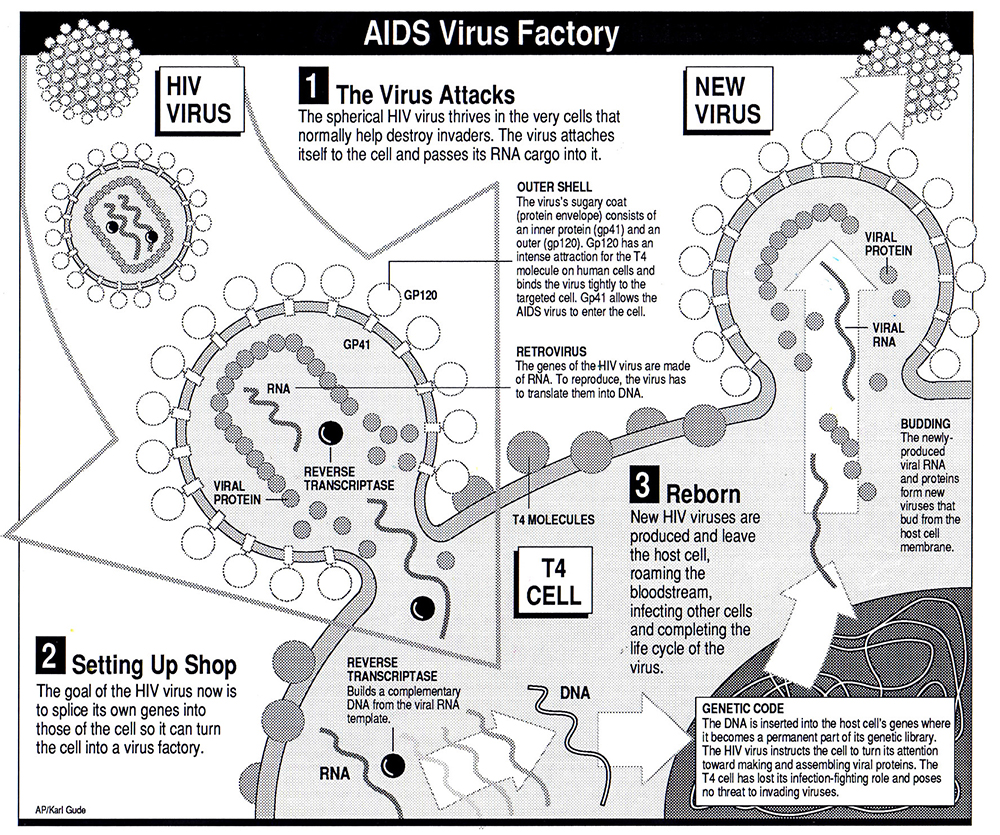
One of my early Mac graphics drawn in Claris MacDraw 1.9.6, March 1988.
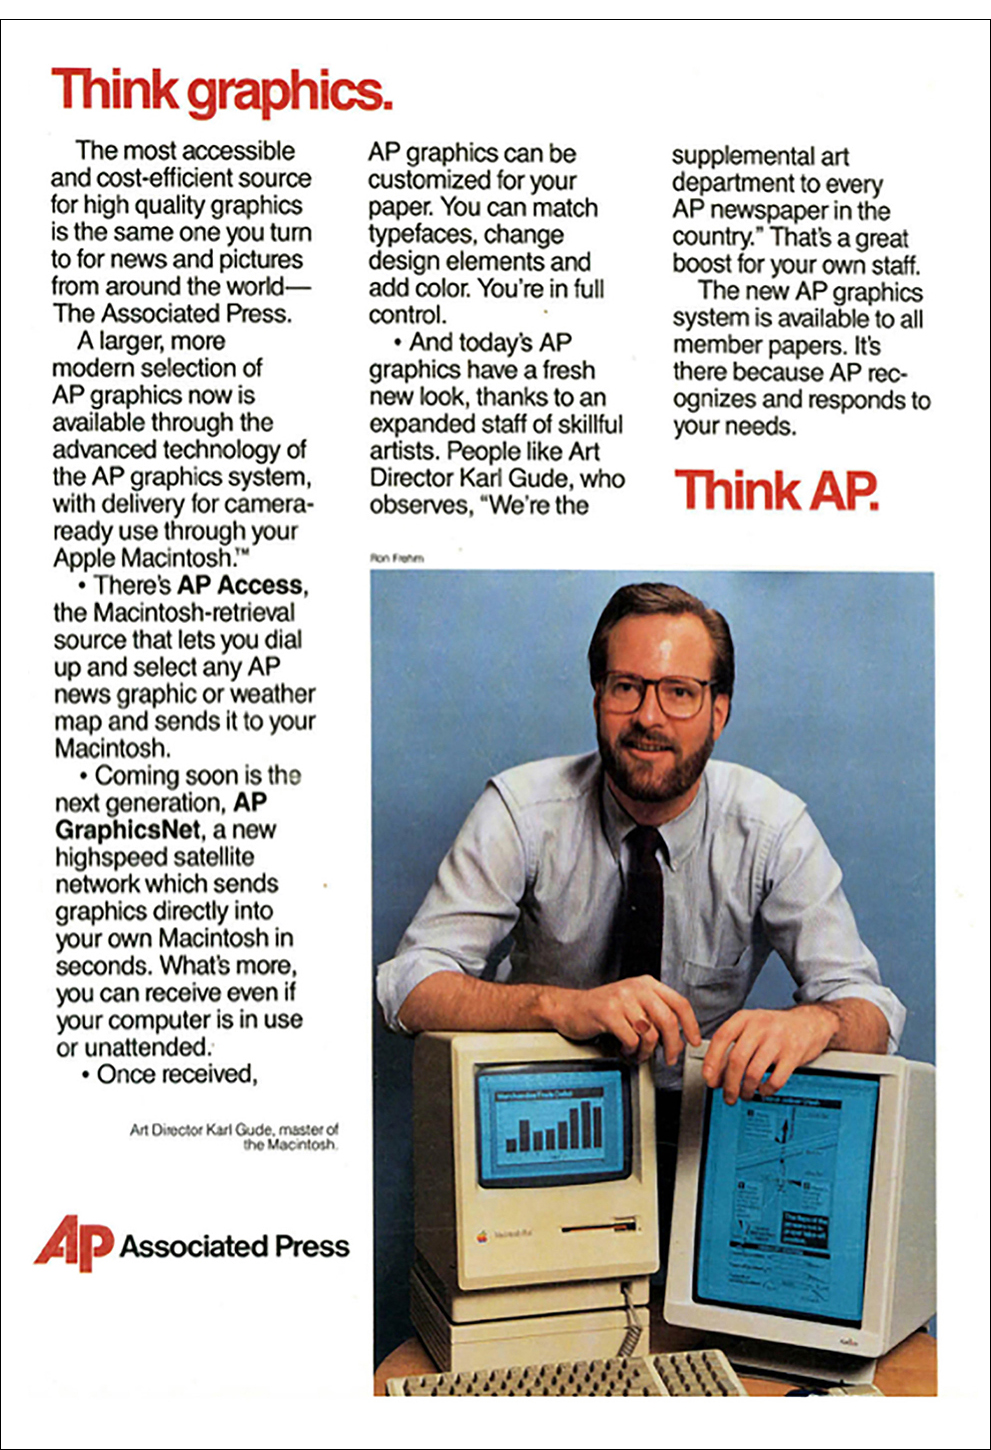
AP leads the way. (Editor’s note: Notice that Karl is “master of the Macintosh”. You can’t beat that.)

The first portable Mac


If you were to shrink every tool on a cluttered drawing table and cram them into a tiny little box, you would have the Macintosh Plus.  Because the computer was so light and portable, Apple designed a backpack so that it could be easily taken places, which was a dream for me back in 1987. As a news artist, it was hard to visit the scene of a breaking news event and cover it live in the same way a photographer could with a camera. The best I could do was to go there and make sketches (visual notes) to use as reference for a drawing that I would complete back at the office.
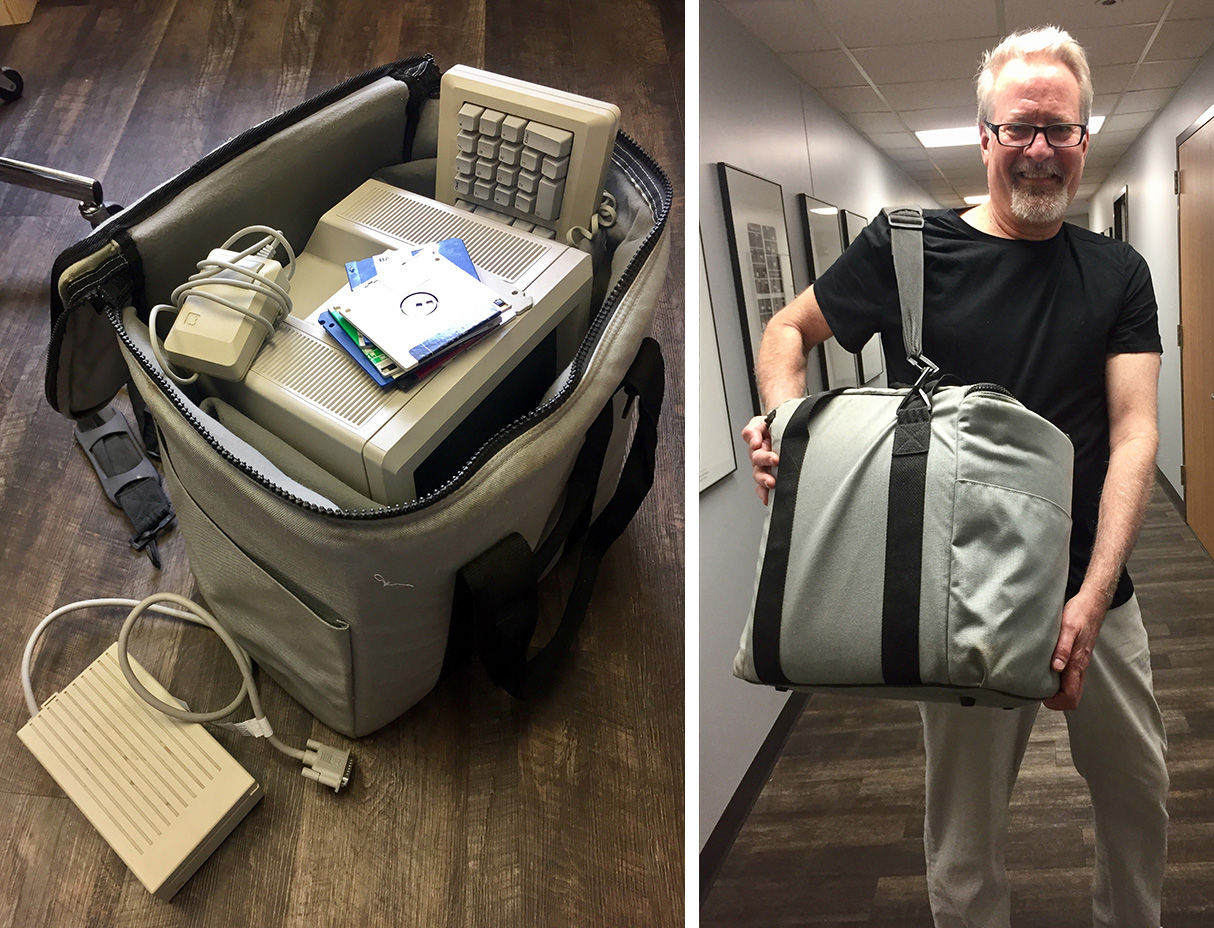
The traveling computer. Just a little larger than an iPad! Karl holding the bag a few days ago.

Before Apple’s swanky backpack existed, I used a cardboard box. There was a terrible accident where a building under construction collapsed killing a number of workmen in Bridgeport, Connecticut, which was about 35 miles from the AP offices in New York, As was the usual drill, I found myself explaining to a photographer, who was rushing to the scene, which photos I needed him to take for me as possible reference for a diagram. It was then I realized that I could go with him! No longer tied down to a drawing table, I threw my Macintosh into a cardboard box, and hopped in the car with him. The Connecticut Post was nice enough to give me a desk to work on (thanks Rick Sayers!), and my Mac was the first one they had seen in action. The diagram I made that night, explaining the process workers were using to build the doomed building (called “lift-slab construction”), was transmitted over a phone modem directly from the Post to AP in New York, who then routed it to hundreds of newspapers and TV stations around the country. Hours were saved in the making of the graphic, which made our subscribers very happy.


Drawing programs: vector or postscript?

In the early days, before scanners came along, drawing on Macs was heavy going. We used the vector-based MacDraw program, which was easy, cheap, and already in every newsroom. Because we were a news agency that supplied graphics to 2,000+ frugal news organizations, we had to stick with MacDraw much longer than we had wanted.

We would sketch out our drawings on paper, and in order to get them into the Mac to finalize them, we followed this process:

  1. Size the drawing (or photo reference) on a copy machine to about the size of the tiny Mac screen.
  2. Trace the drawing (or photo reference) with a marker pen onto clear acetate.
  3. Tape the acetate to the Mac over the screen.
  4. Trace the image with the mouse (much like drawing with a bar of soap) by clicking around the acetate drawing without moving your head (otherwise, your drawing would be distorted).
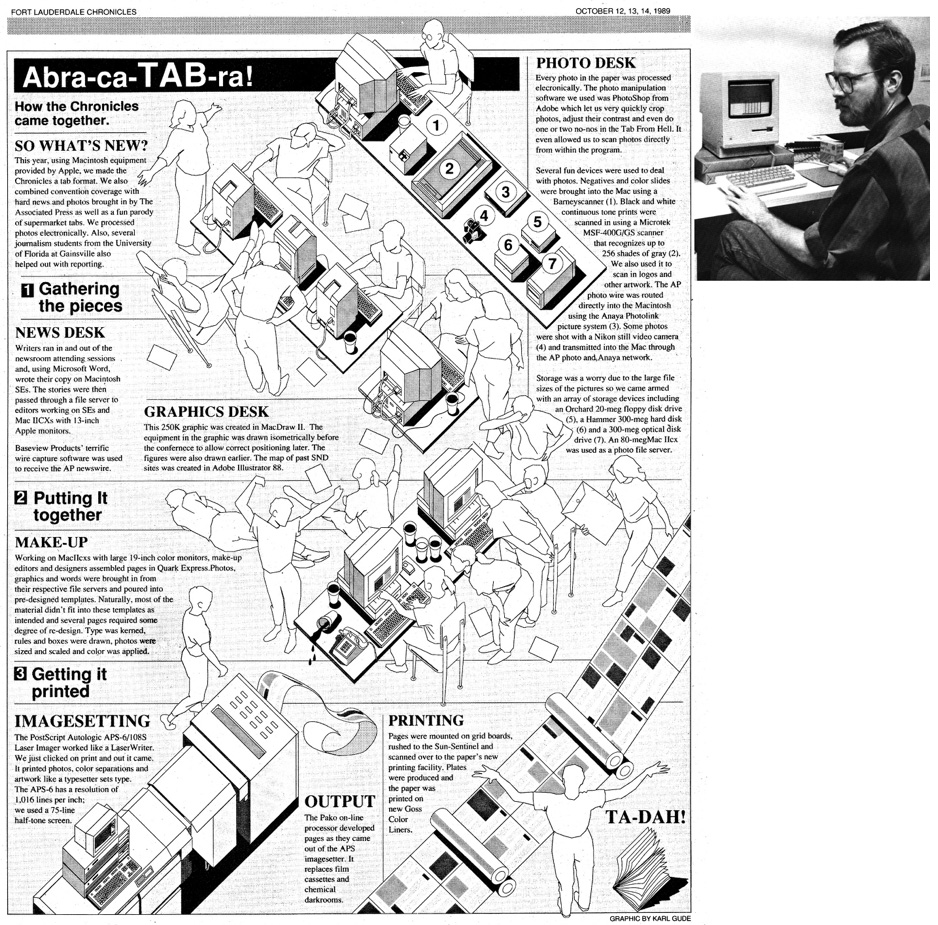
The equipment in this illustration was drawn directly in the Mac SE using MacDraw II, but the people, which my wife posed for, were drawn using the method detailed above.

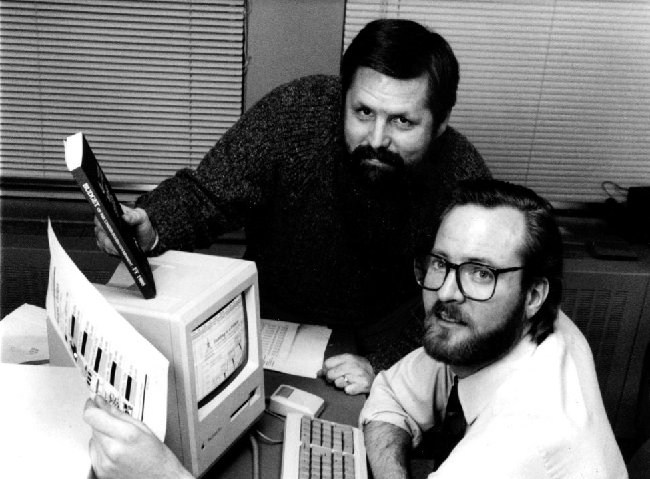
Covering elections with the Mac meant sending graphics directly to papers through Mac-to-Mac- dial-up instead of over a slow, bogged down photo network. Here I am in D.C. with AP’s Brian Horton to cover the 1988 elections.
1989 MacDraw graphic, one of my last with that software.

Superior postscript drawing programs like Adobe Illustrator and Aldus Freehand had come out, but for the Associated Press to switch to one of those meant getting all of our news members to purchase and learn it, and most of the smaller papers resisted this expense of time and money. Also, postscript programs couldn’t read vector images, so entire databases of maps and images would be useless. Eventually, though, we had to make the move. We asked both Adobe and Aldus if they could build into their next version the ability to open and edit vector-based images. Adobe said, “That’s against our religion. No.” But Aldus said, “How soon do you need it?” So, we announced to the newspaper world that AP would be switching to Freehand, and that we could get if for them at a discount. I heard that the Adobe guy who made the “religion” comment was fired for lack of vision.
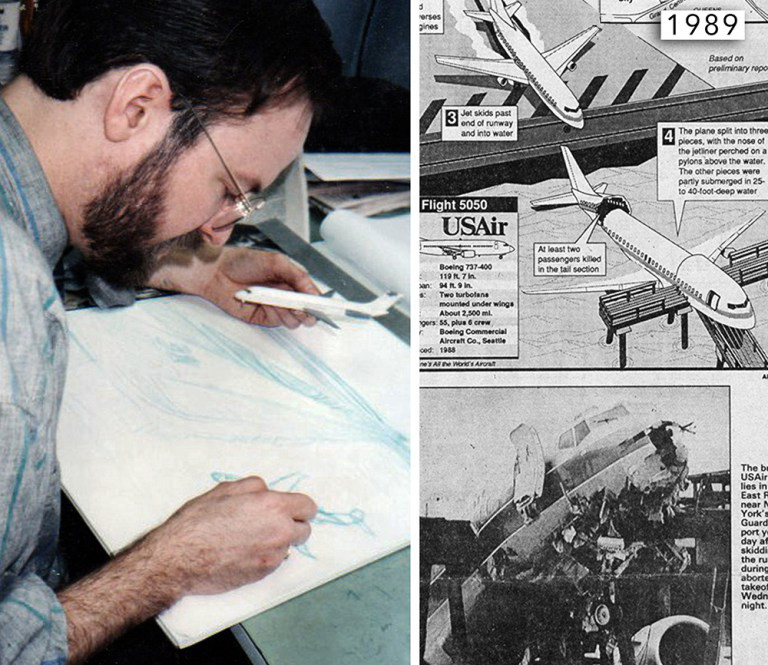
Sketching out a plane crash graphic before drawing it in the Mac. We built lots of aircraft models for reference.

Still, despite all of the awkward limitations, drawing on the Mac still was better than drawing with an ink pen, and pasting a layout with melted wax onto boards before having them photographed and printed. The Mac allowed you to edit your lines and fills, change text easily, move elements around into different layouts, and create databases of elements, like maps, that you could reuse another time. It was heaven.
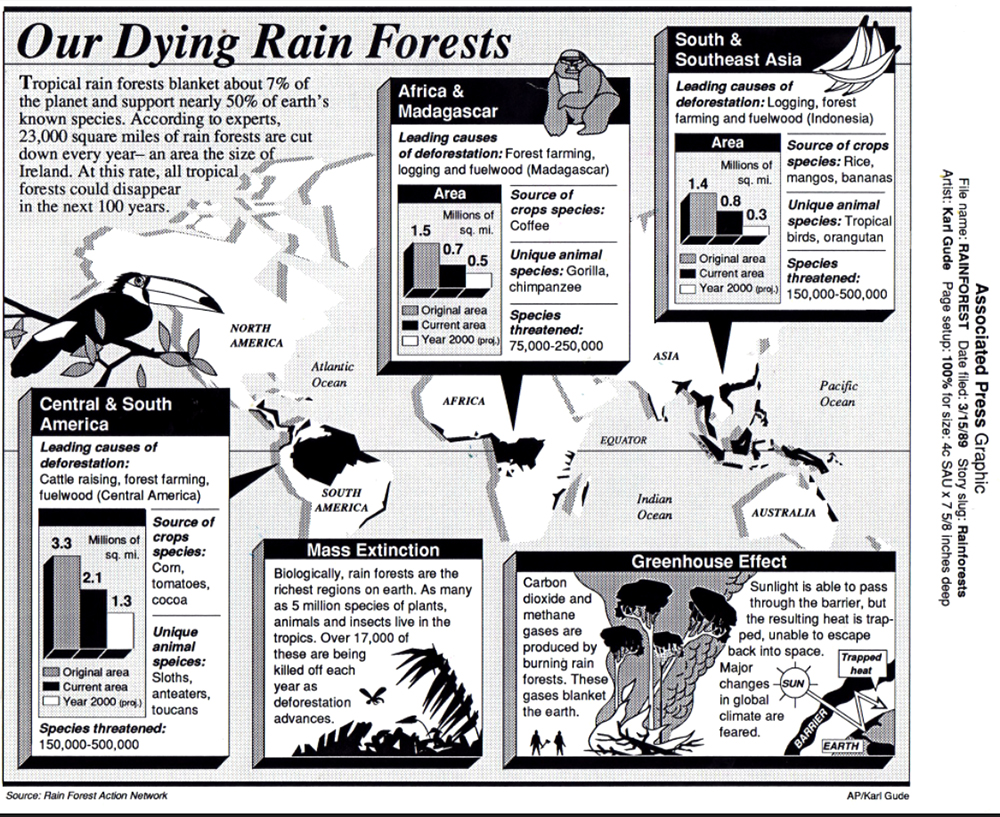
An early Aldus Freehand drawing, 1989. The thick 3D boxes were a bit much. Hey, so were shoulder pads in jackets!
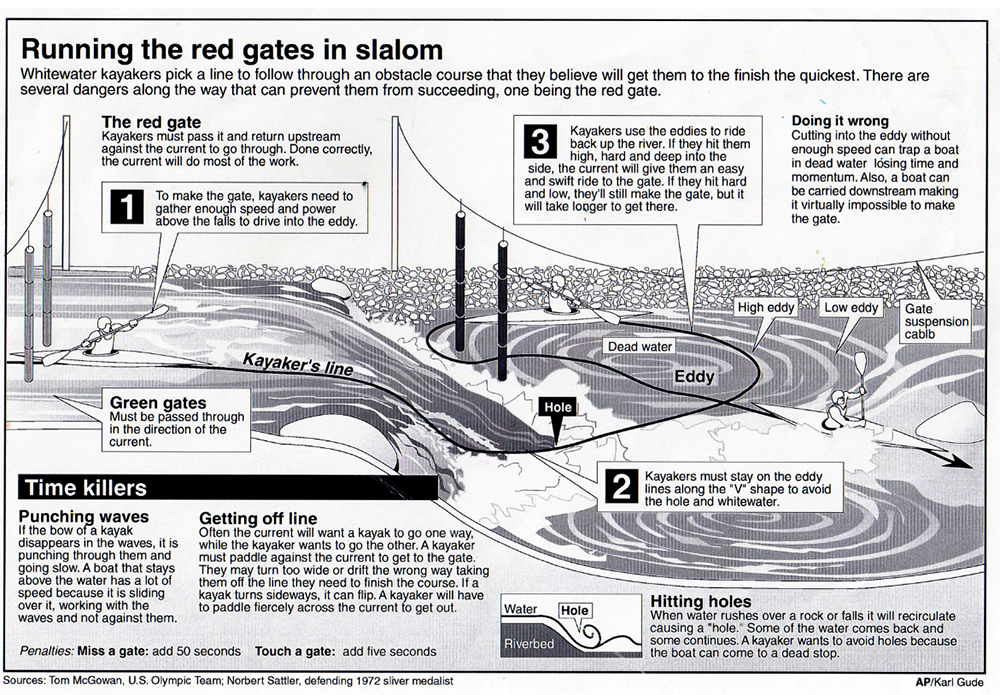
By the early 90s, the Mac and Postscript software, predominantly Adobe Illustrator, had stuck and both were here to stay.

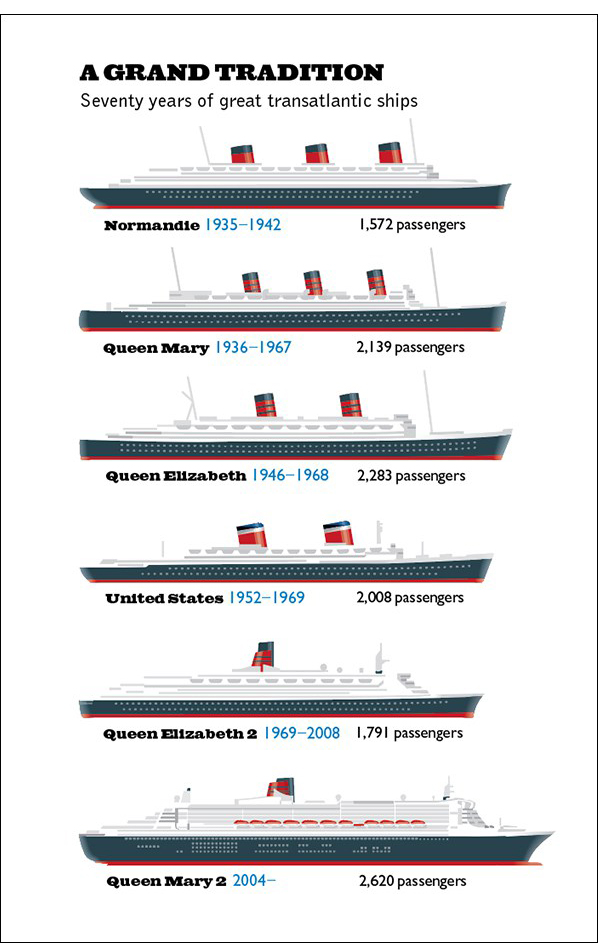
Over-complex

SIMPLER MIGHT SOMETIMES BE BETTER.

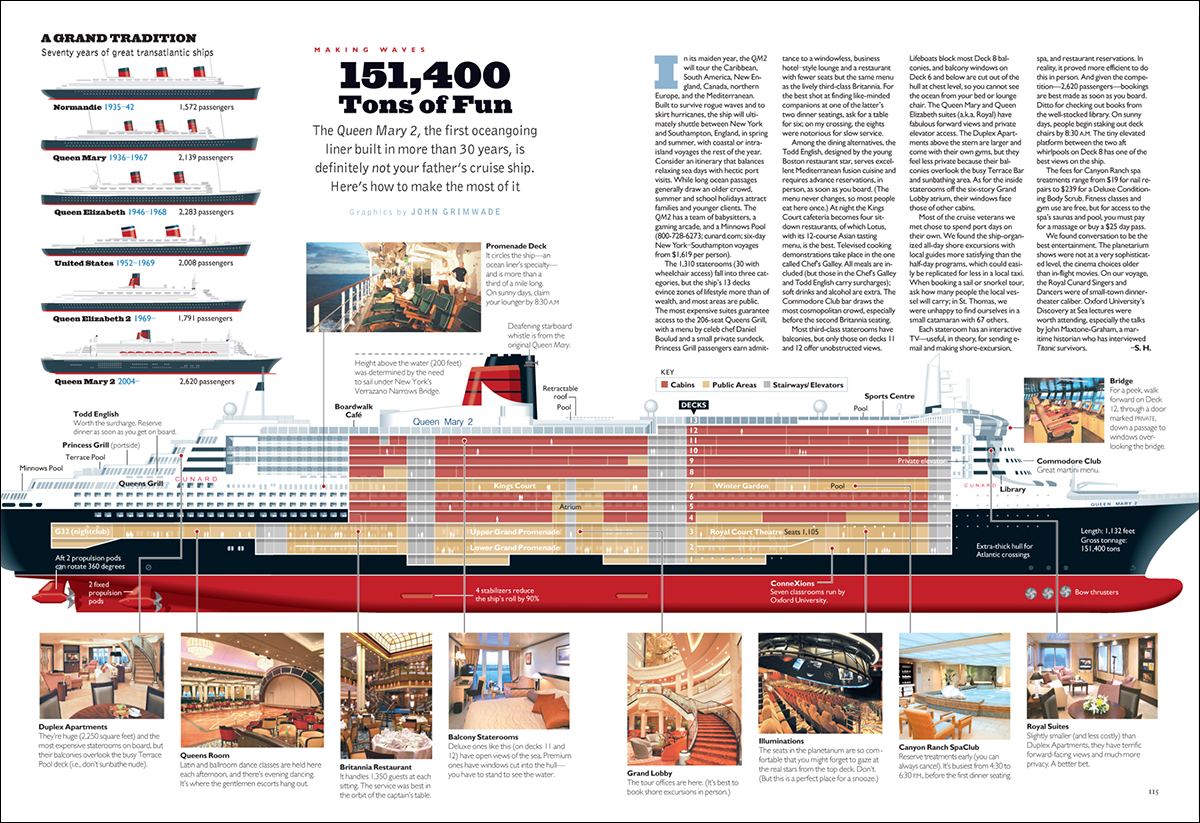
I didn’t make this ocean liner comparison as a free-standing graphic. It was part of a big, and much too complicated, display about the Queen Mary 2 (shown lower down this post). I’m now thinking that this historical timeline captured the main point of the feature. (The ships are drawn to the same scale.) It was interesting to know where the QM2 was sailing on it’s maiden voyage, and the globe addresses that aspect. (It ran on another page of the feature.) These two small graphics would probably have been enough, but I was a graphics director, and I wanted to make a statement.

So… I wonder how many times I’ve made infographics that are more dense than they need to be? I collected a lot of information for the graphic below, but I didn’t have to use it. The lower section of the spread looks like it might be from a cruise brochure. And apart from the overcrowding, an elevation view doesn’t give enough of an idea about the interior spaces of the ship. That’s obviously why this type of rendering is usually a three-quarter view. (Which is a hell of a lot harder to create!)

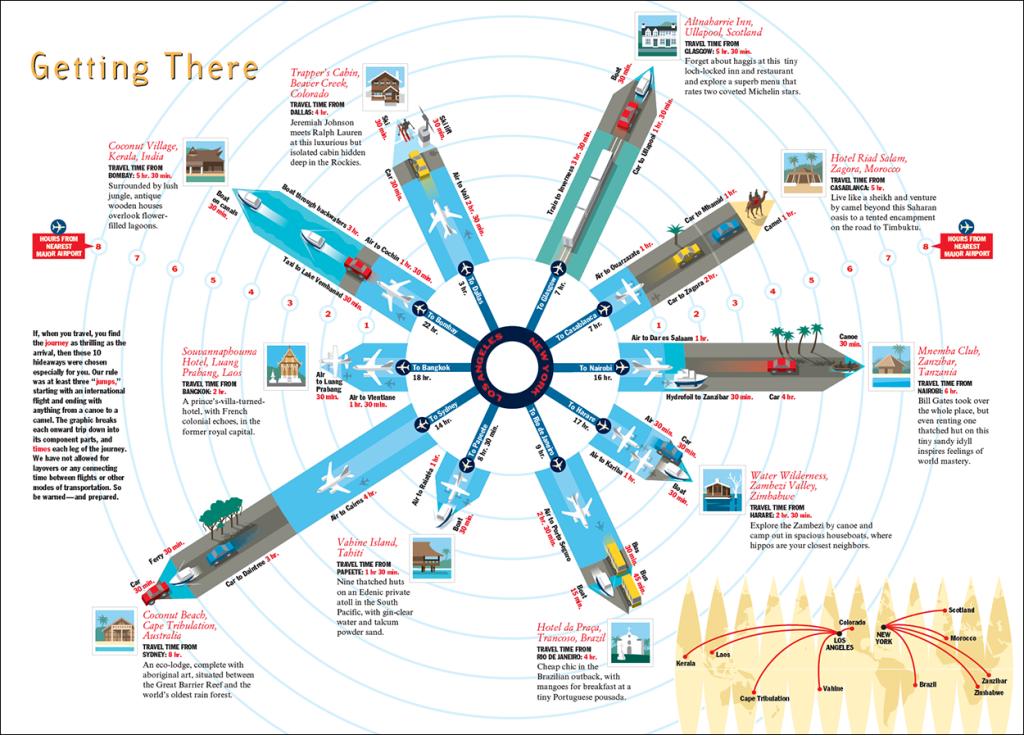
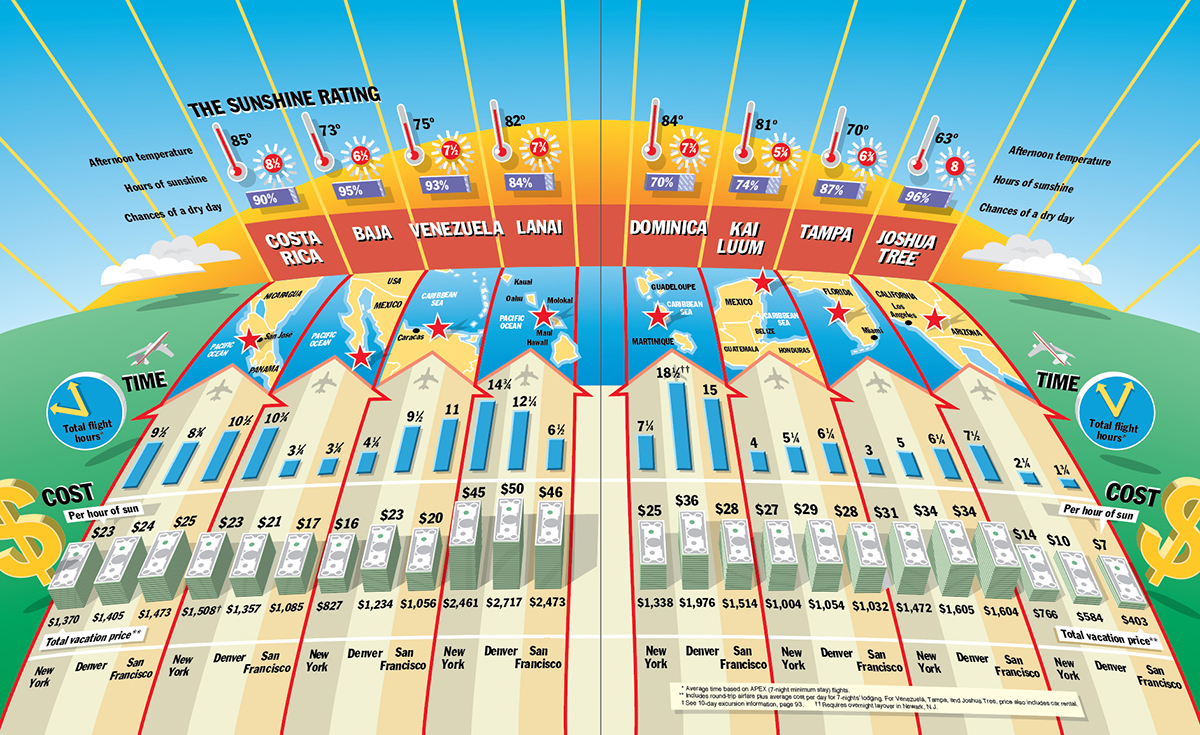
This travel graphic is another example of too much information. I meant well, but I was carried away by the enthusiasm of wanting to show everything. I worry that presentations like this might alienate readers, to whom it could seem like too much hard work.

CMYK

ASSIGNING COLOR TO “MECHANICAL” ARTWORK.

This follows on from my post last week about mechanical art: https://www.johngrimwade.com/blog/2017/02/09/mechanical/

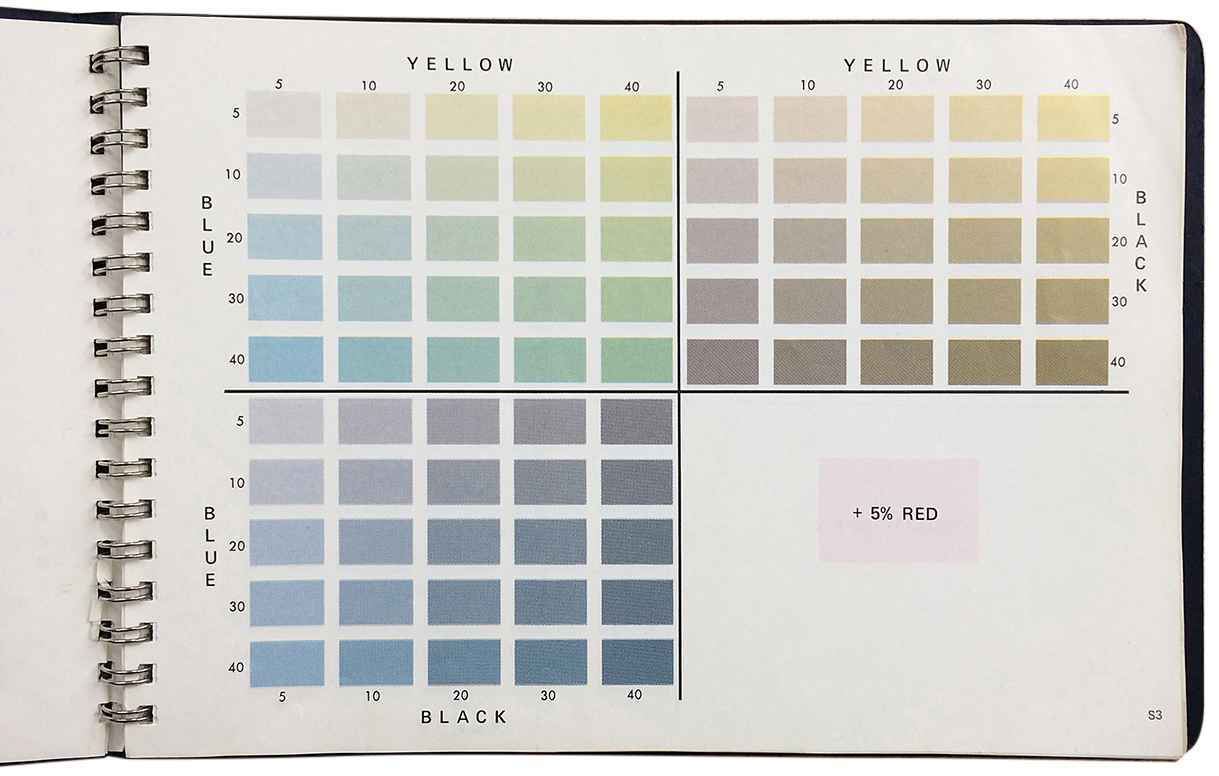
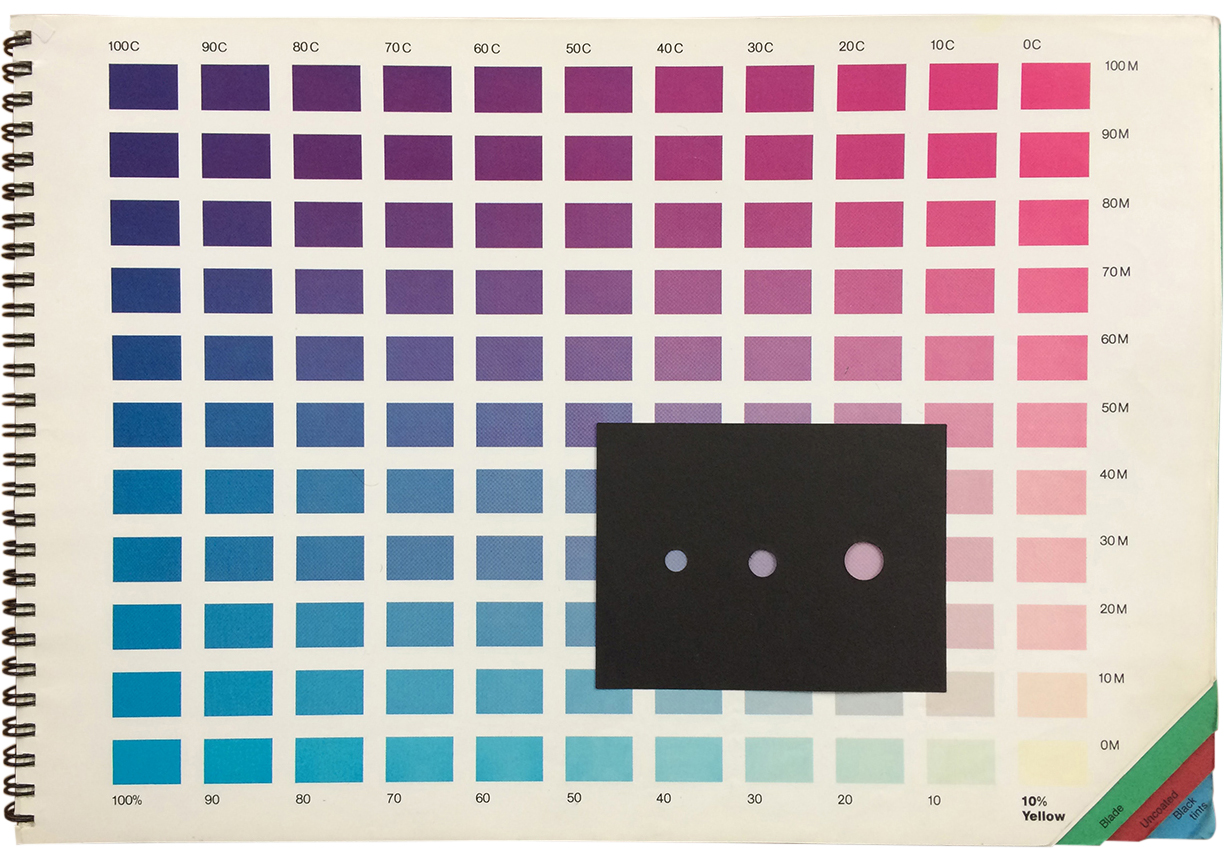
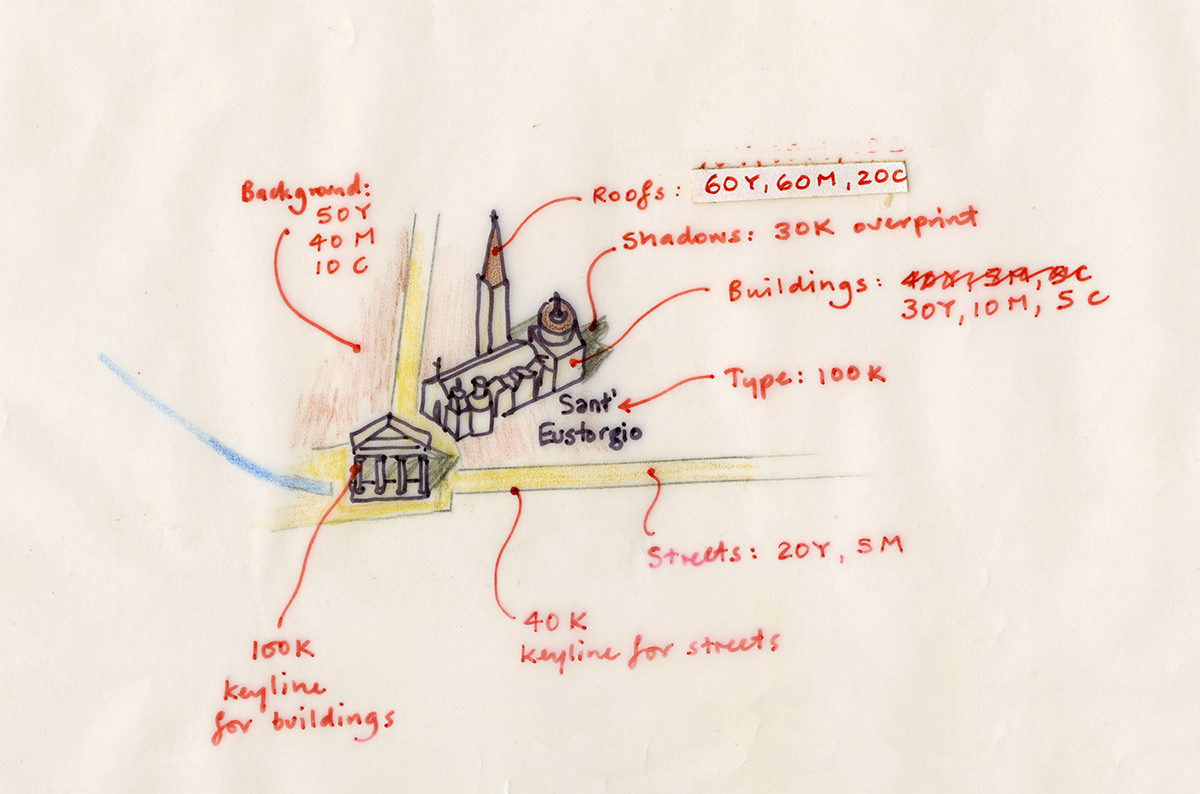
It obviously wasn’t just a matter of making overlays with pens and black ink, or cutting shapes in Rubylith film. You had to pick the CMYK colors, and try and visualize the final result. I used two process color books that displayed a huge range of possible color combinations.

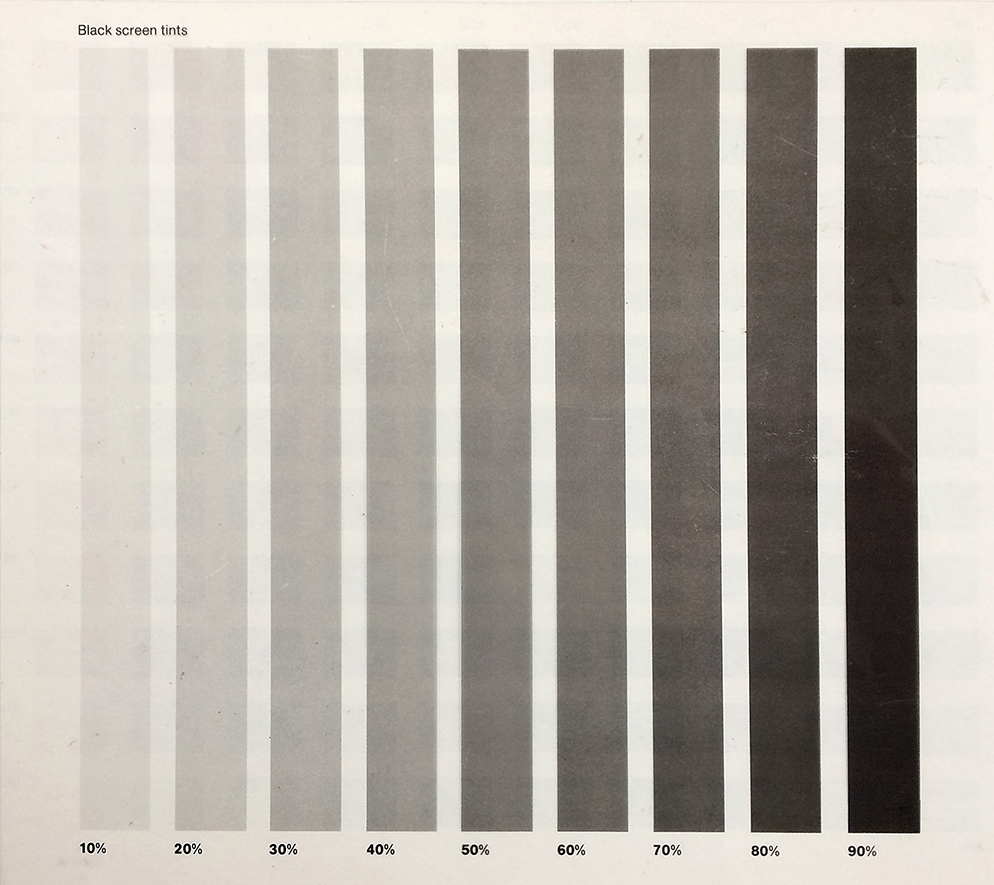
One book has black cards with cutouts to isolate colors, and a transparent sheet of black tints to estimate surprints.

Of course, you could refer to previous proofs and build up a vocabulary of color values that you knew would work. But it was not an exact science, and there were sometimes interesting results. Either I had marked up the overlays incorrectly, or there was a mistake at the pre-press company. (How they could ever get it right amazed me.) Sometimes I had selected a color, that when put next to another color, looked downright awful.

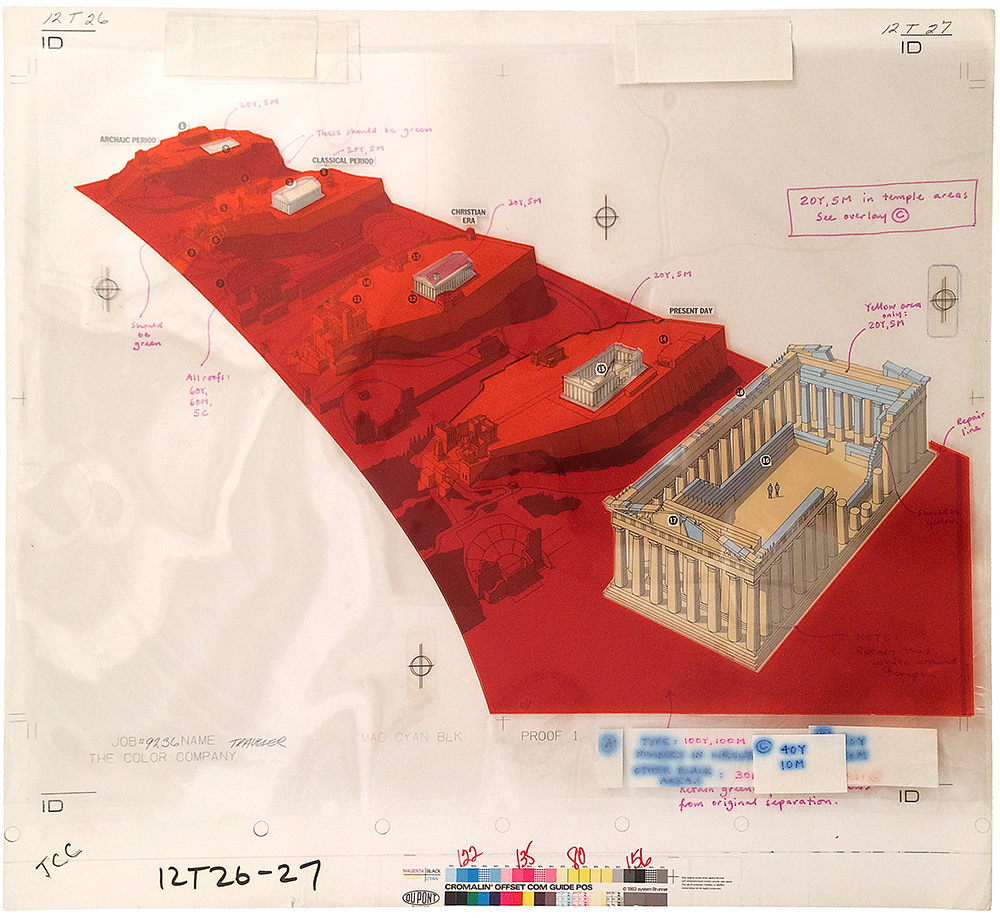
But mostly it worked. In the case of this Parthenon artwork (from 1988), I applied several layers to the first “Chromalin” proof to correct my miscalculations. I’ve shown the printed result before in a post about the pre-computer era: https://www.johngrimwade.com/blog/2016/09/26/when-infographic-dinosaurs-roamed-the-earth/

Time has taken it’s toll on this mechanical. The layers have shrunk or expanded, which is why they don’t register correctly, and the blue-inked instructions have spread out, but it still gives an good idea of the process of working with overlays.

This artwork is heading to Munich! It‘s part of an exhibition of my work. From March 9 to 11, at the EDCH and INCH conferences.
I will also be giving one of the keynote presentations at INCH, and running an information graphics workshop.

Design conference: http://www.edch-conference.com

Infographics conferencehttp://www.inch-conference.com

Infographic workshop: http://www.inch-conference.com/en/workshops

The Isotype revolution

OTTO NEURATH AND THE MODERN PICTOGRAM.

This is the second post in a series about the search for a pictorial language, by Nigel Holmes.

Excuse me where’s the restroom? Moments later, I see the familiar icon of a man and a woman. Ah, relief. Most people don’t know that the grandfather of these welcoming little people is Gerd Arntz. (They probably don’t care much either, when nature calls.) Gerd Arntz’s boss was Otto Neurath.

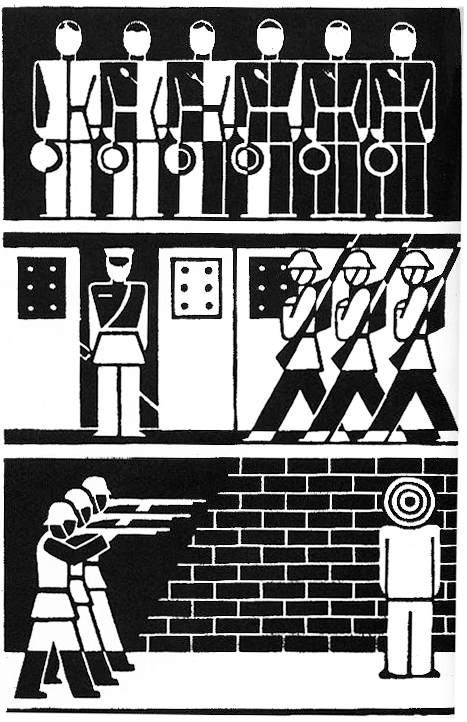
Mention Neurath to anyone who knows the name, and the kind of illustration that will come to mind was probably created by his brilliant collaborator (and toilet-icon grandfather) Arntz—an artist who made mostly black and white wood- and lino-cuts, and whose work still looks modern though he started working 90 years ago. (He died in 1988.)

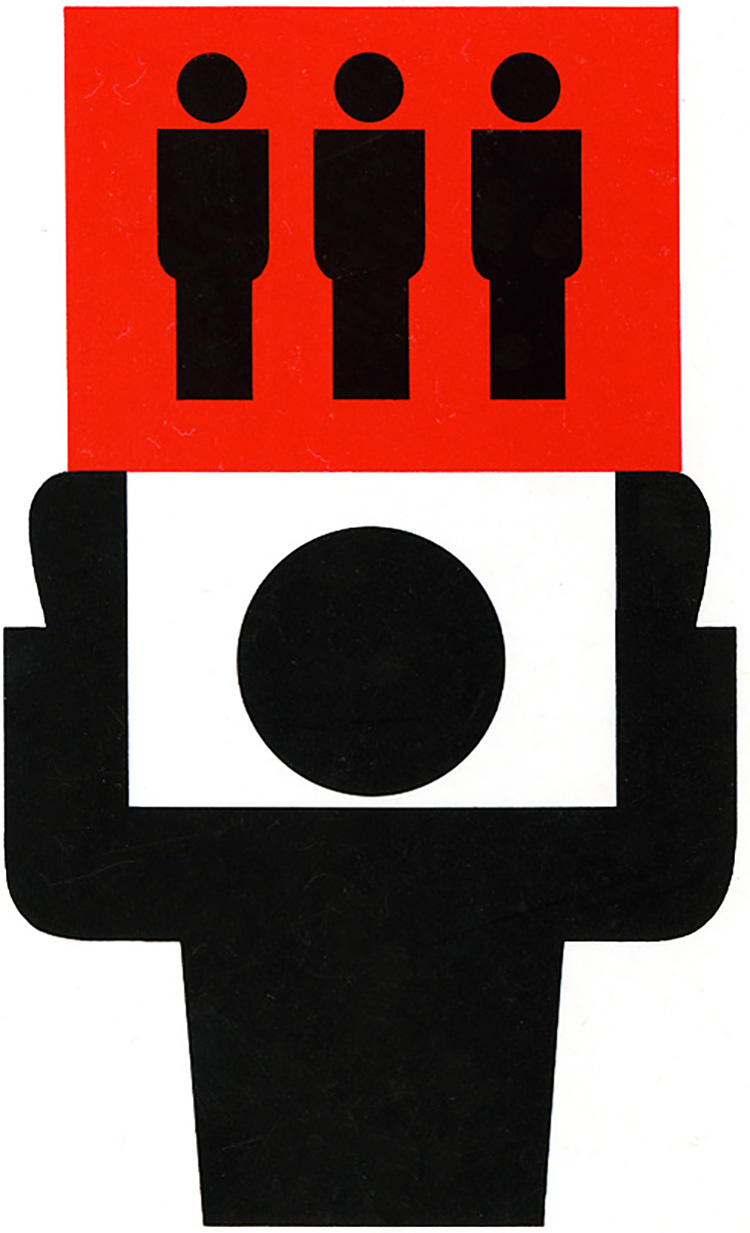
But it’s Otto Neurath (1882–1945) who was the force behind the graphic information movement called ISOTYPE (International System of TYpographic Picture Education). It’s still a huge influence on information graphics and data visualization. Below is the well-known logo.

Neurath was a social scientist, not a graphic designer. True to the idea of this blog, he made “Infographics for the People”—the people of Vienna, in his case. In 1925, he founded the Gesellschaft und Wirtschaftsmuseum (Social and Economics Museum), and his exhibitions about social conditions in Vienna consisted of large hand-made charts and diagrams, and models. He understood that it was tiring for museum visitors to stand around studying dense abstract graphics about housing or industrial production. So he developed a way of announcing what his charts were about by adding pictorial elements, while at the same time presenting the statistics in them. Neurath’s effort to make his charts “statistically accountable” was prescient, and should be remembered today by anyone (including me) who includes recognizable pictorial elements in their information graphics. Neurath didn’t want anyone to think he was just making pretty pictures, although he was deliberately using pictures to attract the public’s interest.

In 1925, Marie Reidemeister joined Isotype as the research link between Neurath’s broad-brush ideas and the artists who actually made the end products, most notably Gerd Arntz, who became part of the team in 1928. Marie was the team’s “transformer”—the person who researched and edited the data to best express the stories that Neurath wanted to show his audience.

The Italian archeologist Emmanuel Anati (b.1930) has proposed that early humans learned to identify animal and human tracks in snow. He argued that they learned to “read” before they could write. Neurath used a similar approach when he said that the best way to draw icons of things was to use silhouettes, or profile—side views—of the things being depicted. In the beginning, he even suggested making images by cutting them out of black paper. This forced the artists to keep their images simple. And silhouettes were like footprints, or shadows—“reflections” of reality—documentary evidence, left by the real thing.

Apart from encouraging simplicity when drawing or cutting icons, there were graphic guidelines for the statistical arrangement of the museum’s charts. Today it’s often the surface look of Arntz’s work that’s copied (relentlessly!), while the original principles behind the work is forgotten. (Personally, I think Arntz’s beautiful and humanistic work is a major reason for Isotype remaining influential today, and I completely respect Neurath’s rules for the pictorial arrangement of statistics.)

The guidelines are detailed in Neurath’s “International Picture Language,” published in 1936. The book is written in Basic English. This is a list of 850 words (an average dictionary has about 25,000) and rules for using them, compiled by C.K. Ogden, published in 1930. Basic was intended to simplify English and teach the language to non-speakers. Both Neurath and Ogden were on the same track: ease of communication across all languages.

The main Isotype guidelines

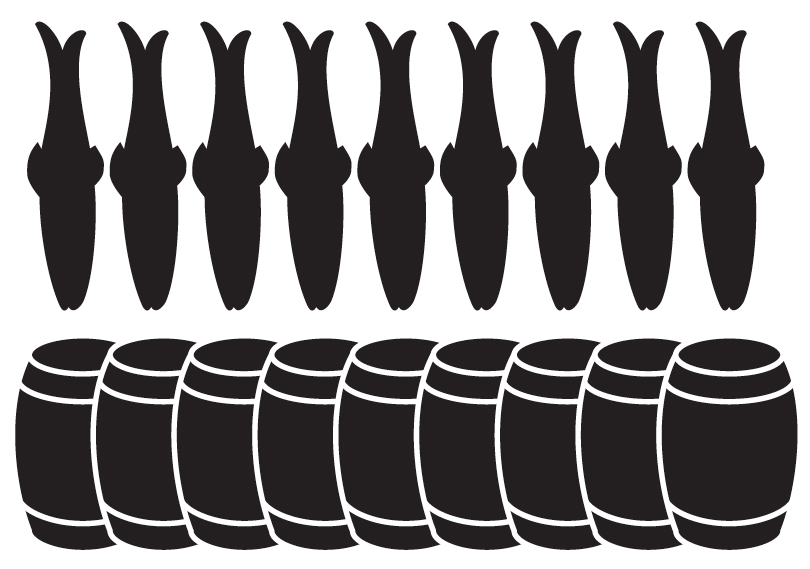
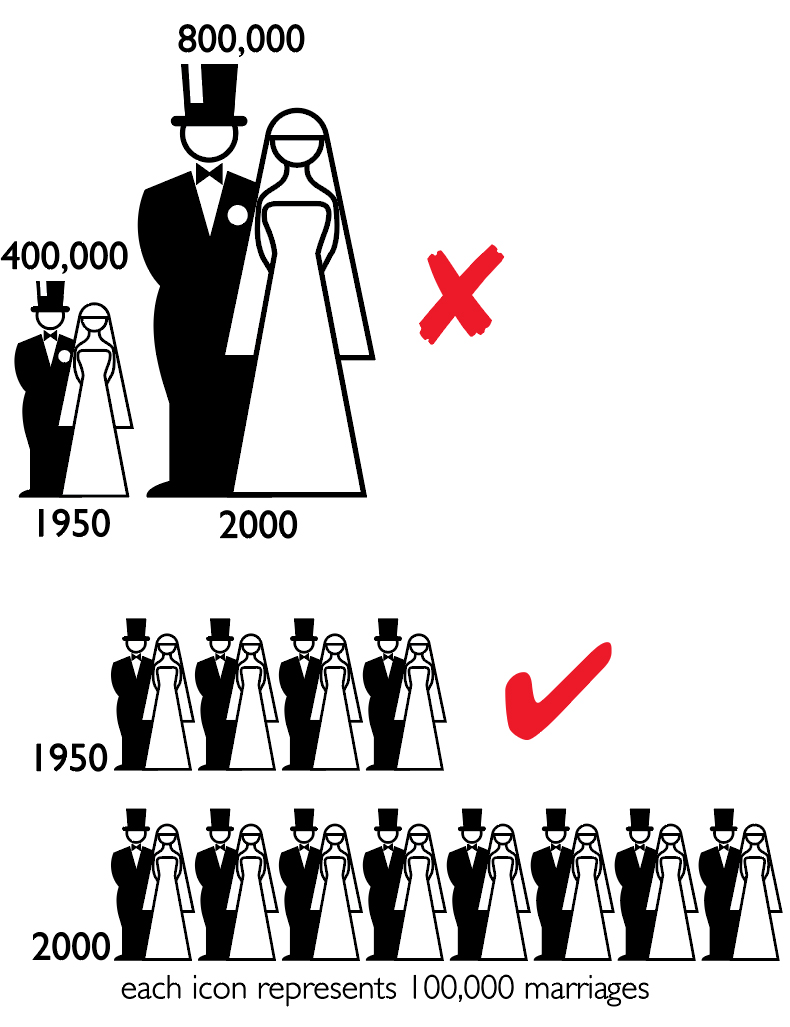
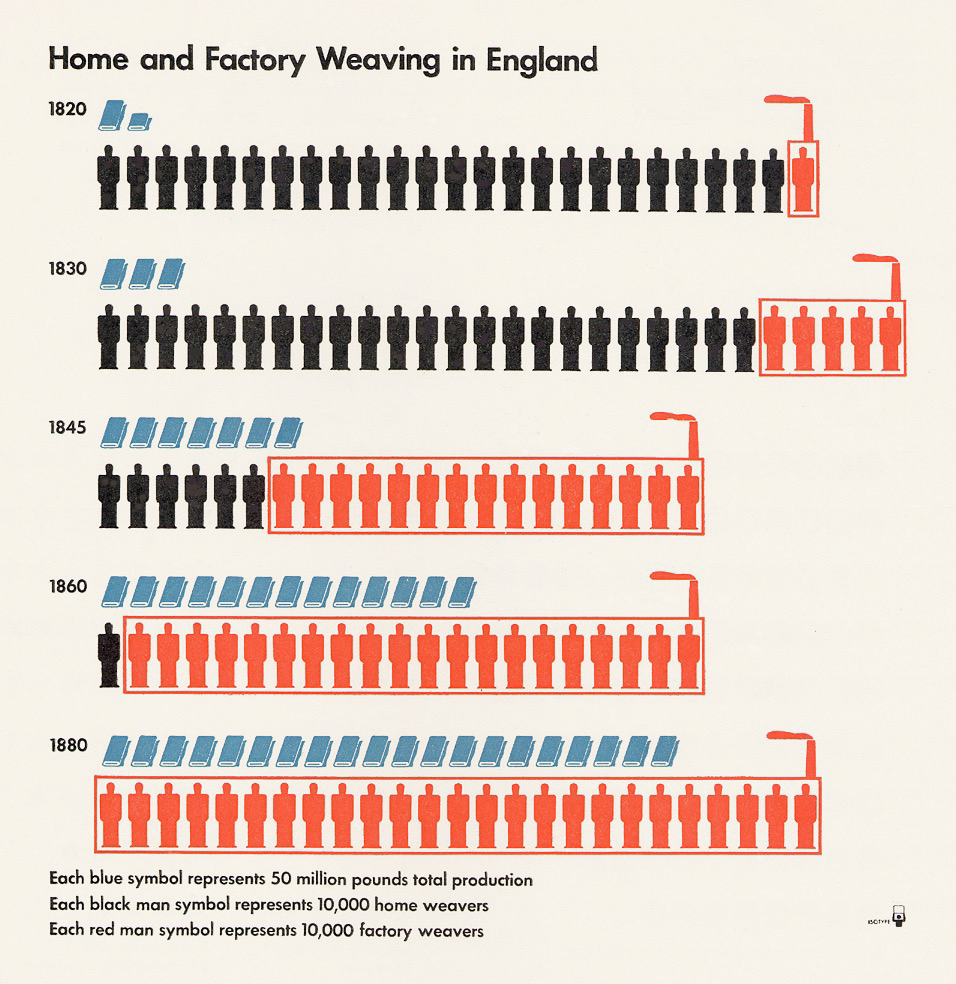
  • Instead of using the length of abstract bars to denote quantities, Neurath used small pictorial icons of the commodities (or people) being charted. All icons in a chart, whatever they were depicting, were drawn to be the same height and width (and visual weight), so that when lined up in rows, one row of icons does not visually outweigh the others. Neurath’s desire to make his charts “statisically accountable” meant that you can not only see the subject of the charts (by seeing the pictorial icons), but you could count the icons and know the quantity indicated. All the icons had to be visually balanced so that your eye didn’t “favor” one row over the others.

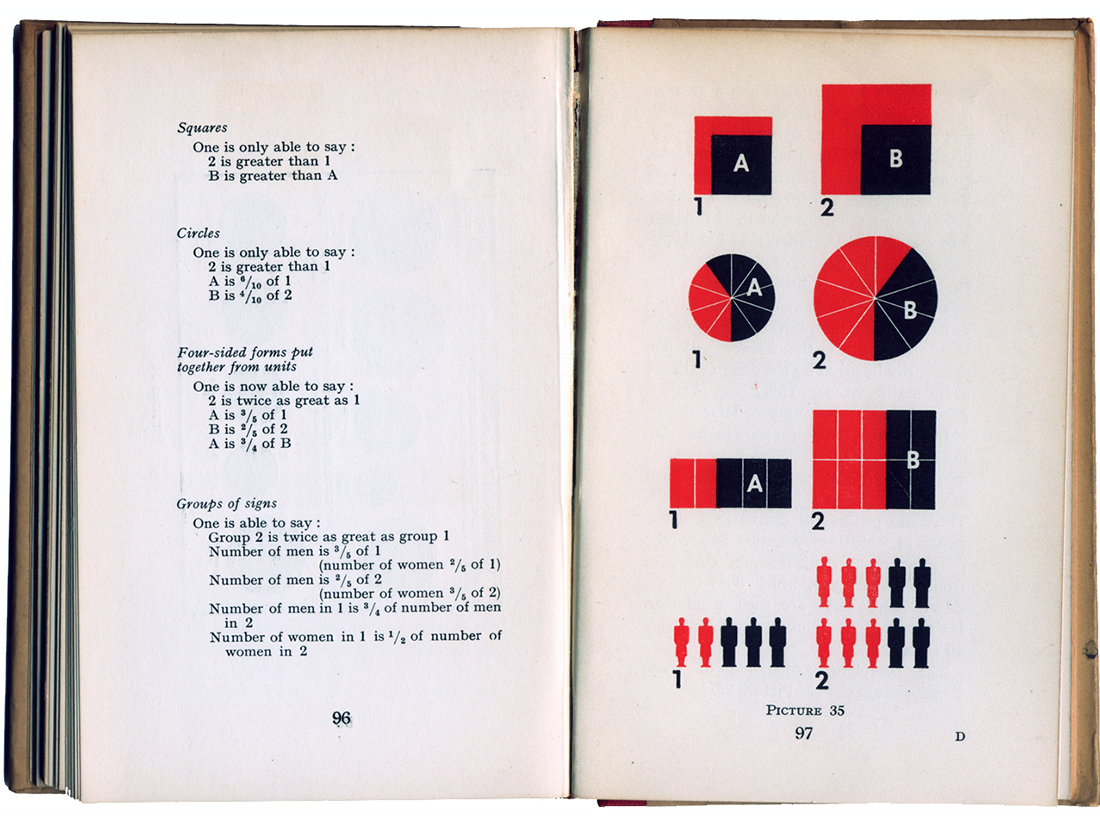
  • Perhaps the most important guideline is that a greater quantity of something (traditionally shown by a longer bar) should be represented by a greater number of icons, not by enlarging them.

  • For very large numbers, one icon could stand for many. Thus, if the legend on a chart said “one sign stands for 1 million,” then two icons represented 2 million, and so on. (Neurath, limited by Basic English, had to use the word “sign” for “icon.”)

  • Where possible, use a horizontal arrangement of icons rather than a vertical one.
  • Circles of different sizes are not good ways to show different quantities.

  • Many line, or fever, charts contain information that is useless, or misleading: the slopes between the plot points are just joining up the points, but contain no information. Bar charts are a truer representation of the data.
  • Other guidelines were about the use of color. Neurath advised a severely restricted use. (During his working life, he often had to do this for many projects, because only black and red were available.) It’s still good advice today, at least at the start of a project, even if there’s no limit to the colors ultimately available. For Neurath, color was strictly used for information, not decoration.

Robin Kinross, author (together with Marie Neurath, who died in 1986) of “The transformer: principles of making Isotope charts” (2009), notes that Isotype guidelines really were guidelines more than rules, and that the team approached each job with them in mind, and that “the principles were continually affected by the challenge of new tasks.” Kinross adds that the overall point of Otto Neurath’s Isotype was “to make something intelligible and interesting.” That’s a principle that should drive all information graphics and data visualizations.

Worth reading:

“International Picture Language,” by Otto Neurath. 1936

“Modern Man in the Making. 1939

“From Heiroglyphics to Isotype, a visual autobiography,” 2010 (Left unpublished at Neurath’s death in 1945.)

“The transformer: principles of making Isotype charts,” by Marie Neurath and Robin Kinross. 2009

“Gerd Arntz, graphic designer,” by Ed Annink and Max Bruisma. 2010


Next Monday, the final part of this series: Emojis and beyond.

Mechanical

FROM OVERLAYS TO COLOR.

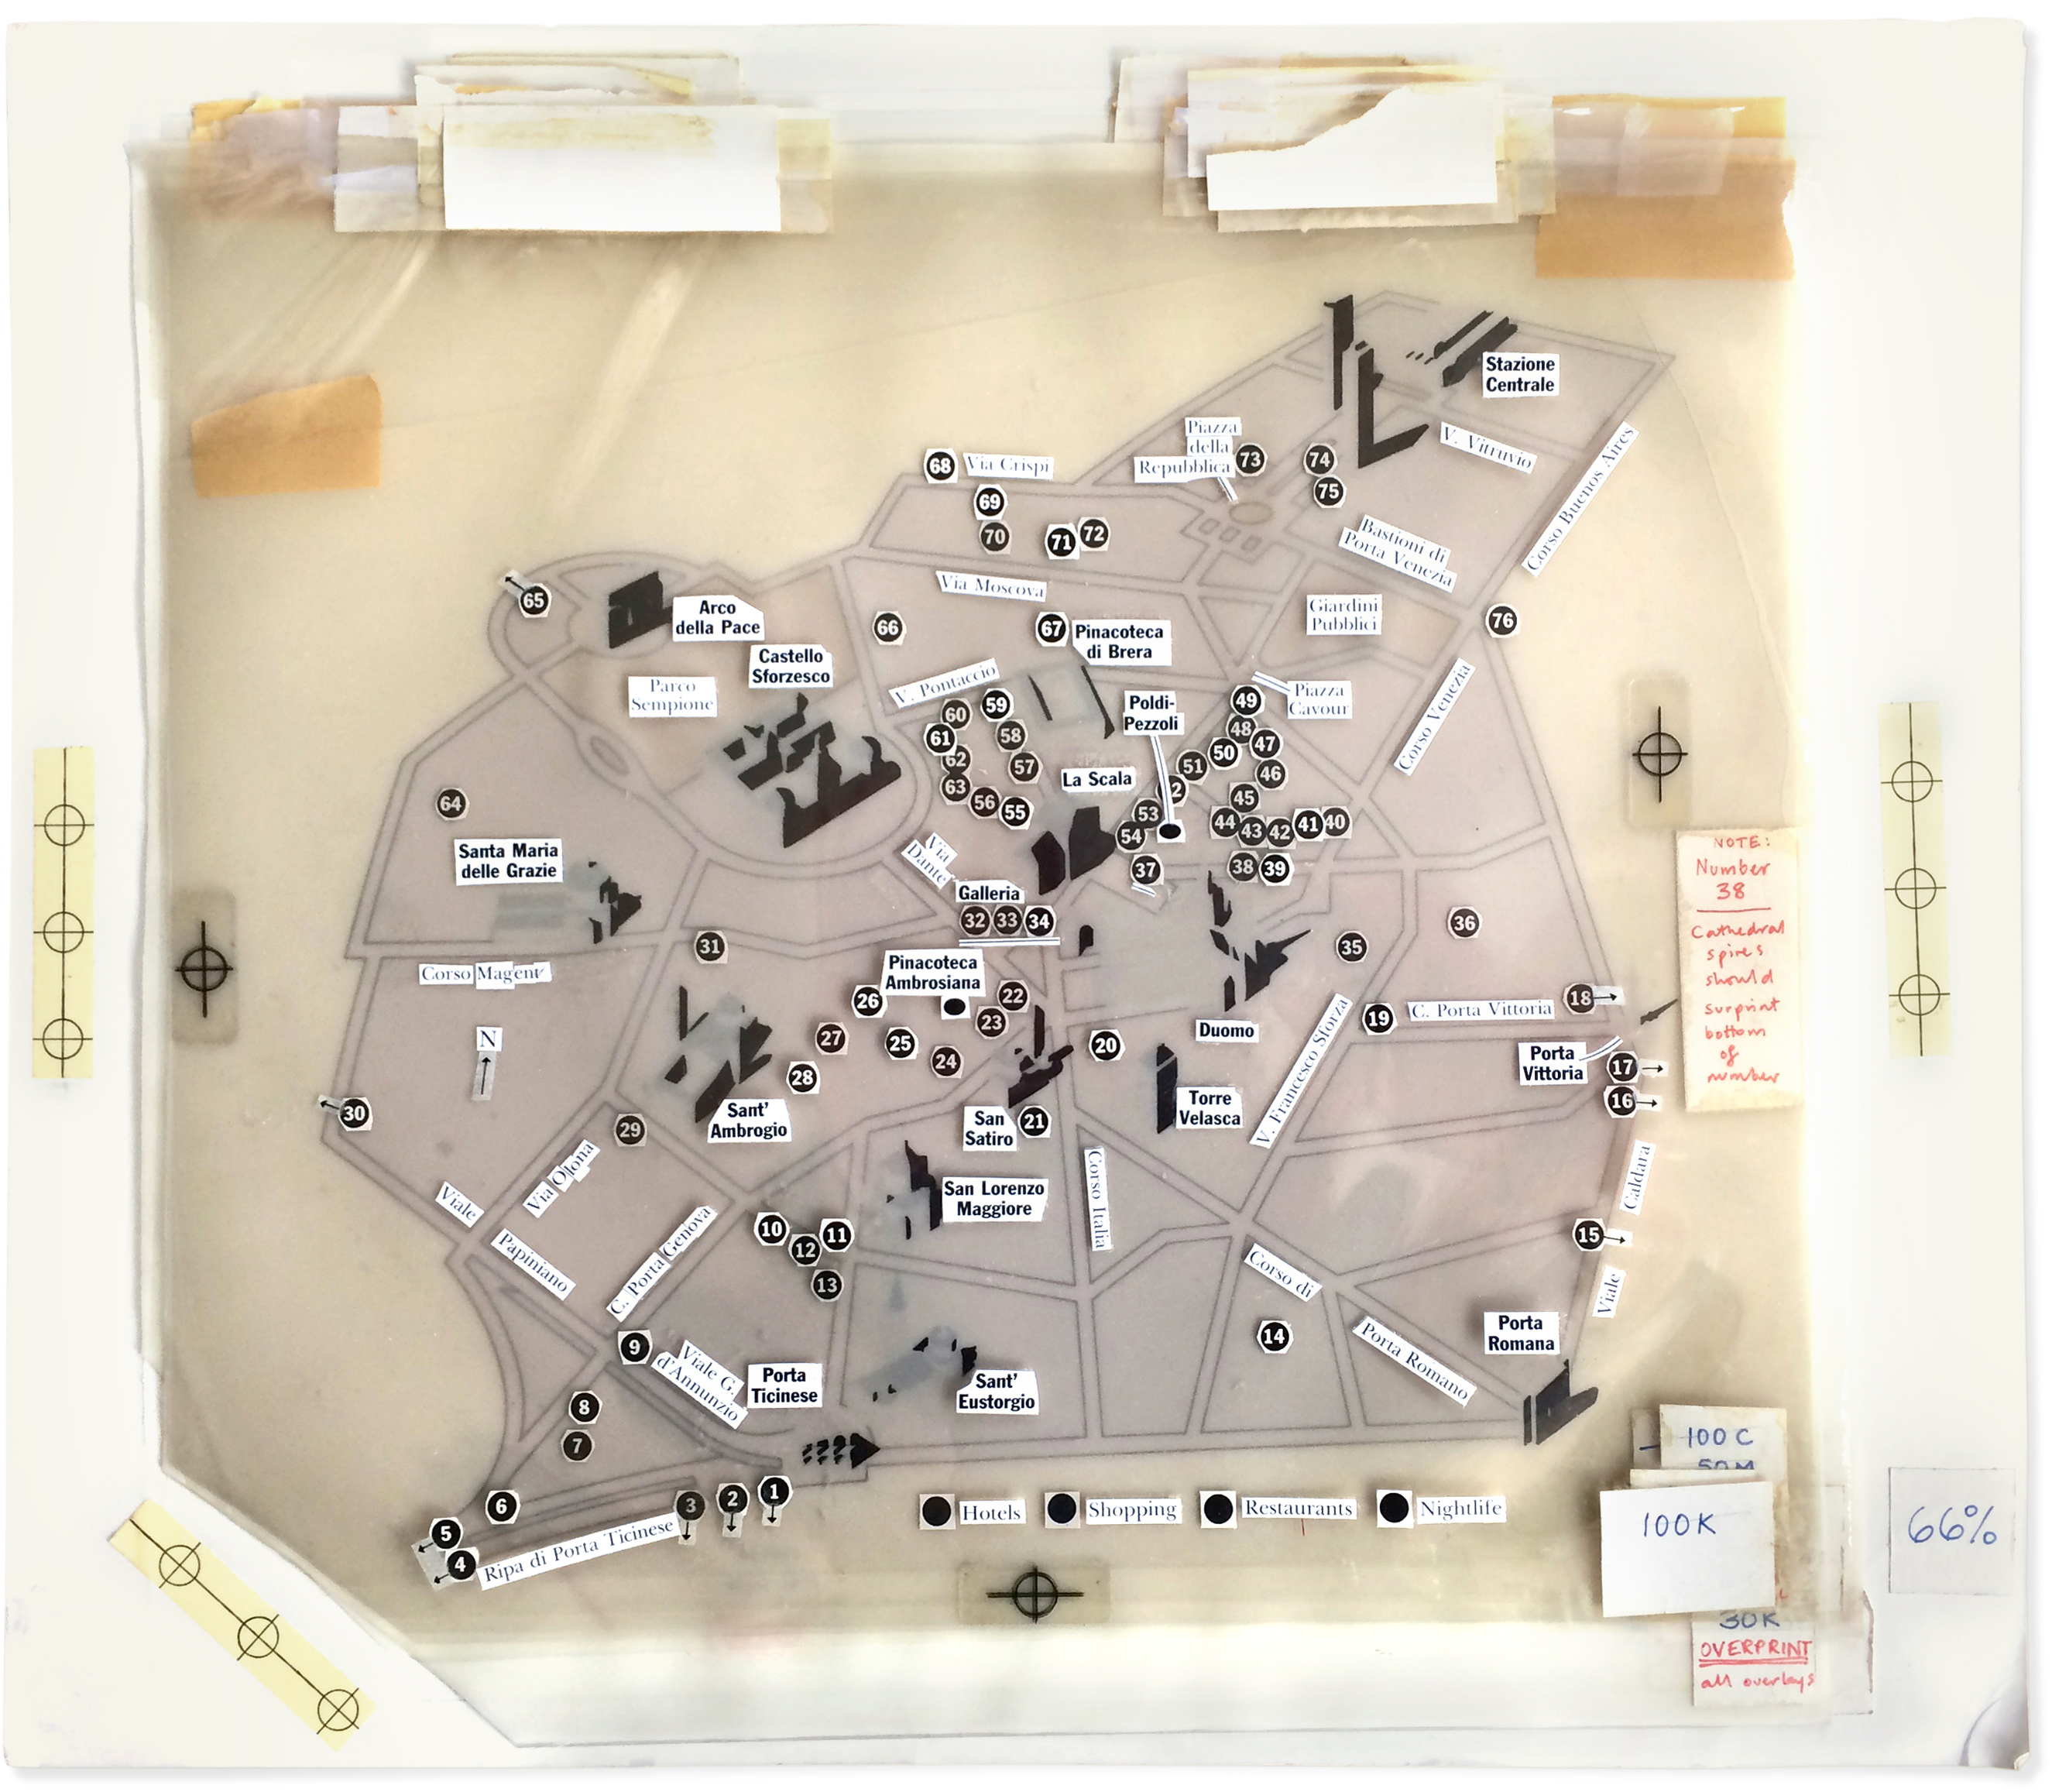
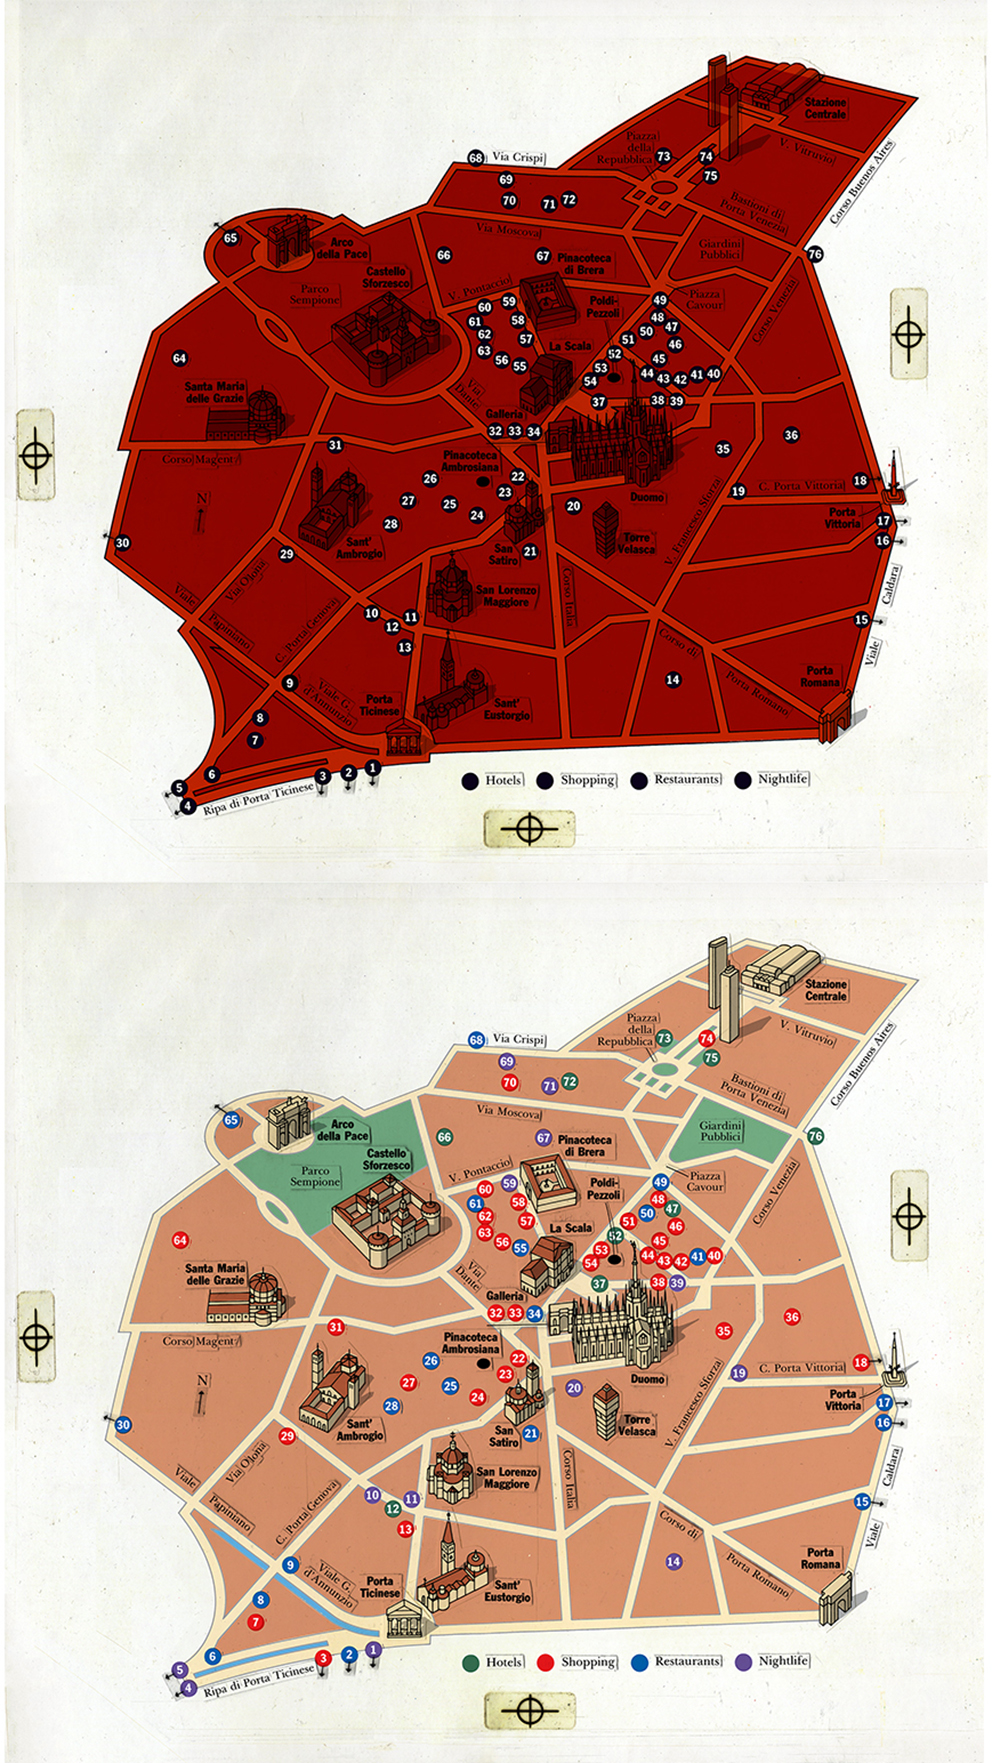
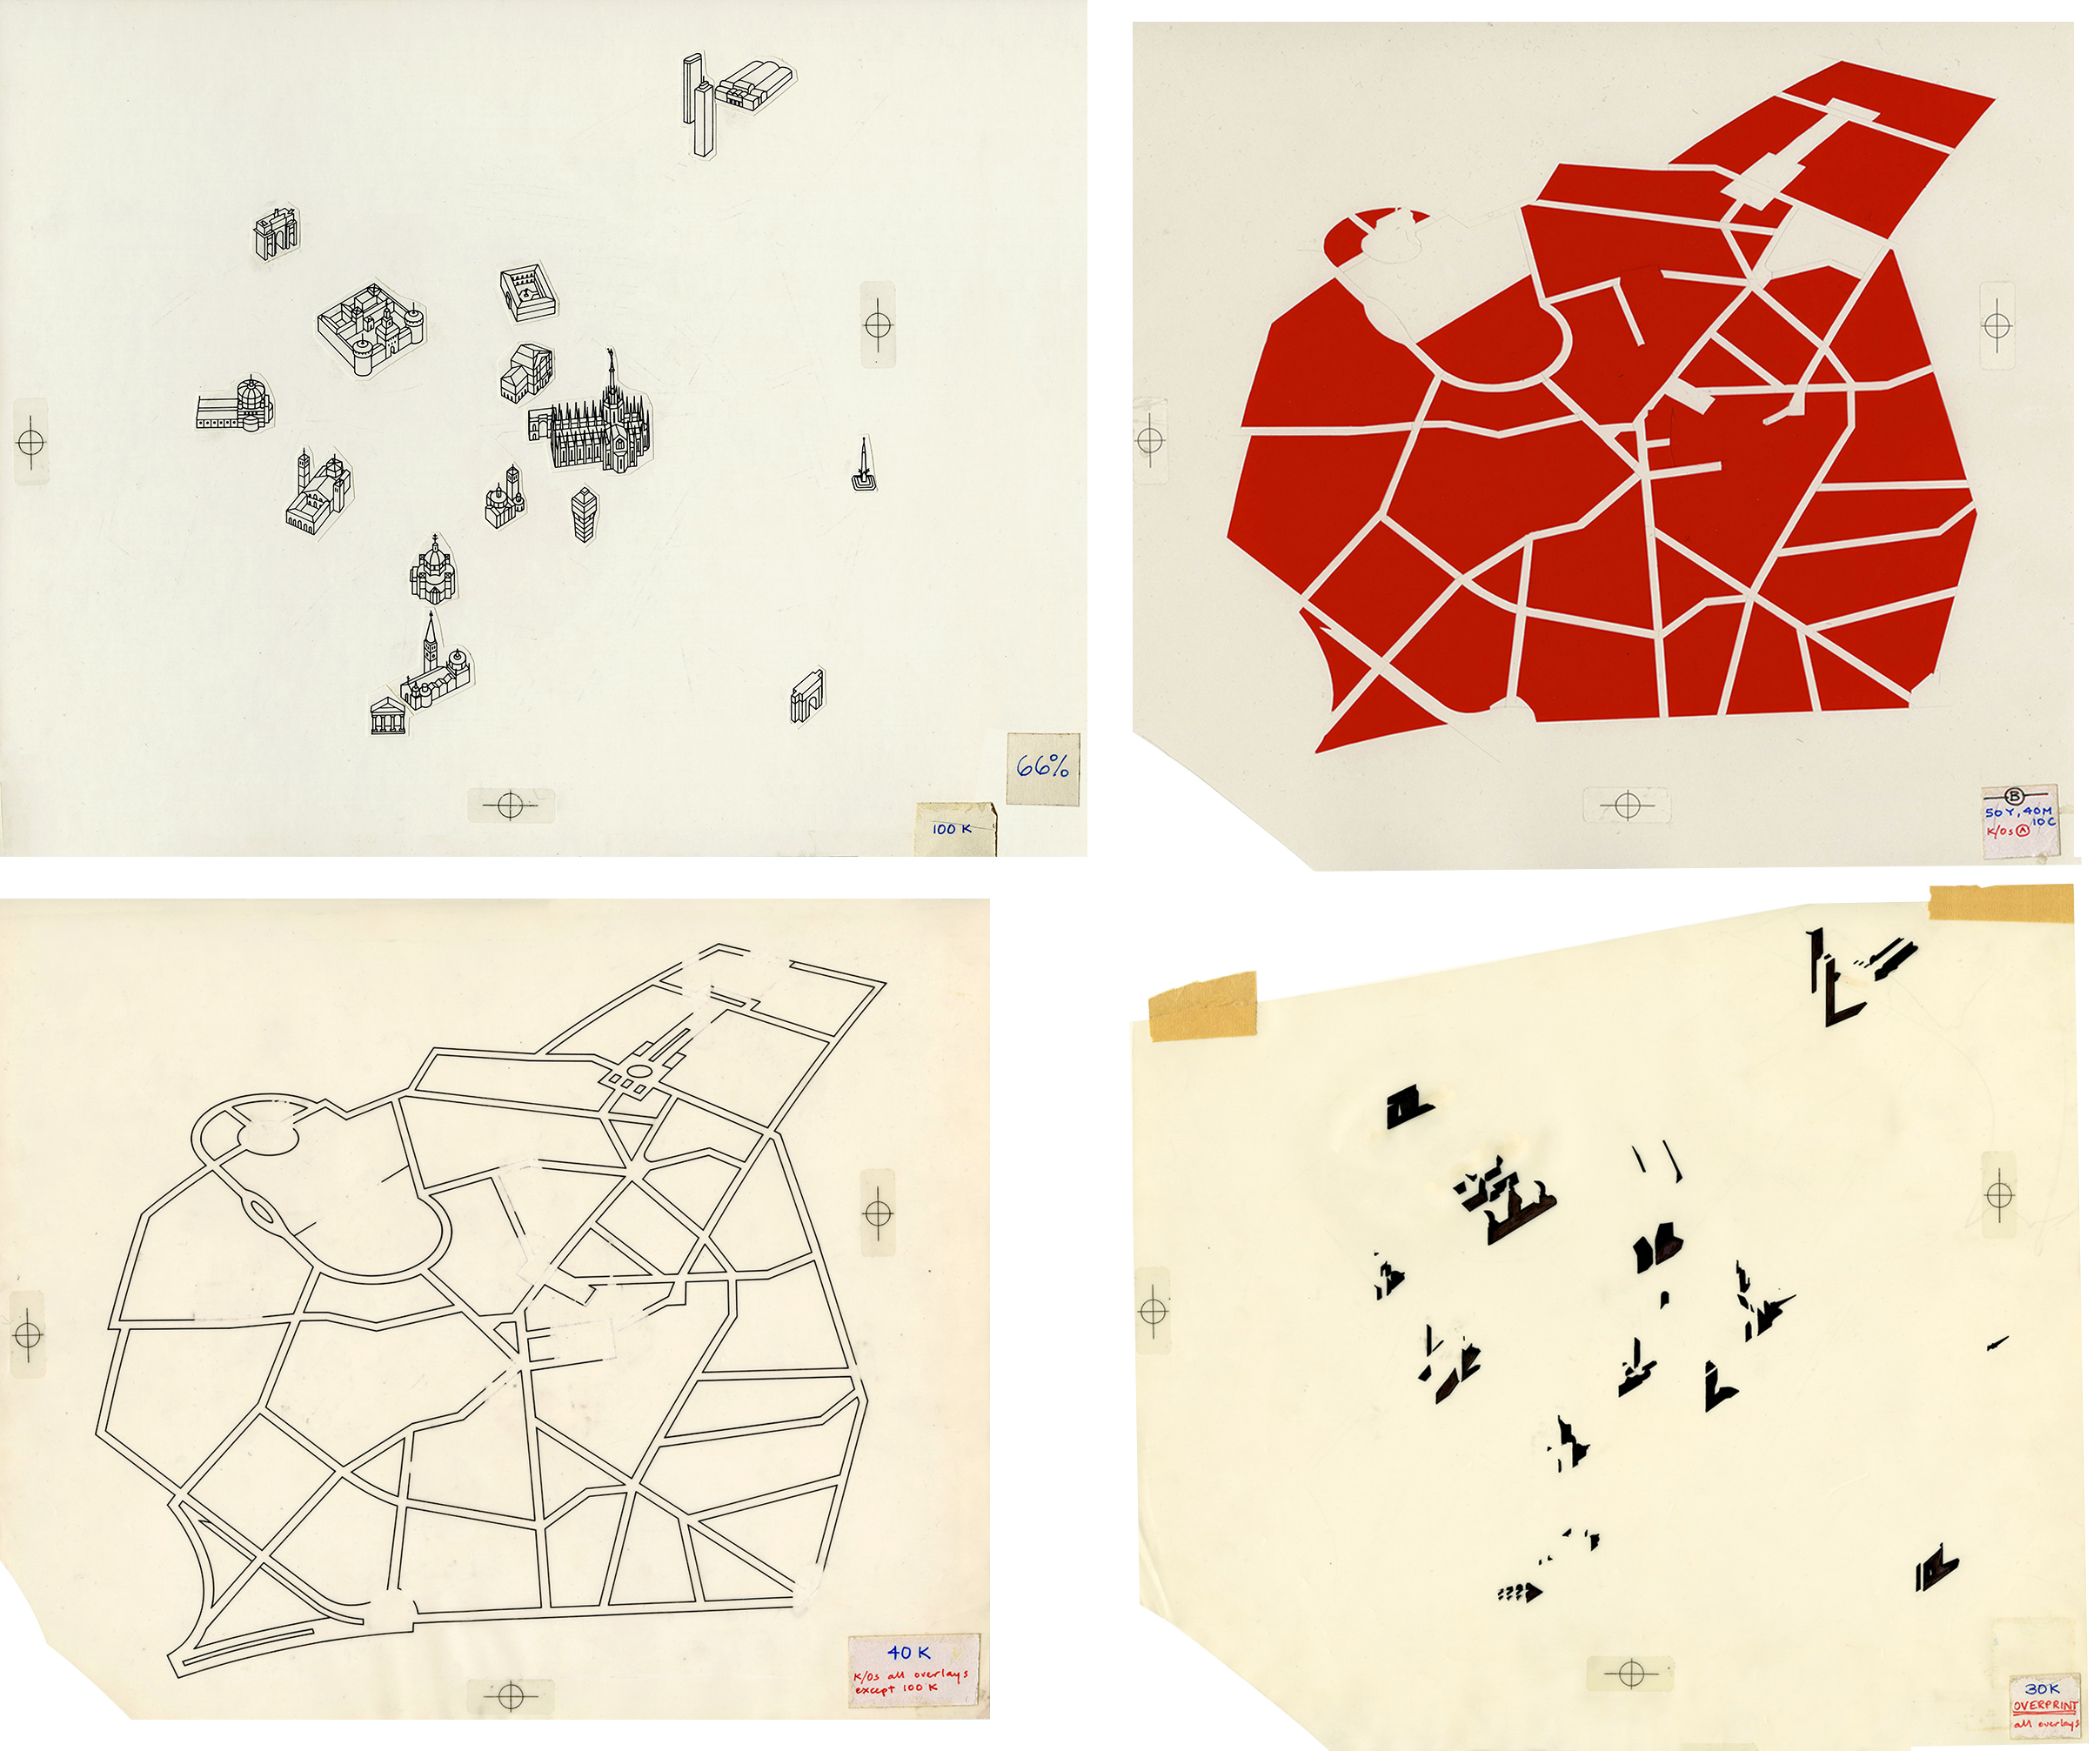
I’ve been looking at this somewhat battered (and not very attractive) Milan artwork of 1988 vintage. It’s going to be in my exhibition next month. (More about that event below.) This is what was known as a “mechanical.” An assembled piece of artwork that would be photographed and converted to a color separation. On top of the line art base, there are twelve overlays, plus a color pencil guide for the pre-press technician. Some layers are inked, some are cut from Rubylith film, with multiple knock outs and surprints. How this all came together to make four printing plates is one of the mysteries of the universe.

When I moved to the U.S in 1987, I was amazed that magazines would spend the money to go through this elaborate process. I mentioned mechanicals in a previous post: https://www.johngrimwade.com/blog/2016/09/26/when-infographic…roamed-the-earth/

Below is a composite scan of the mechanical layers, and the CMYK result after a lot of pre-press work. And I mean a lot.

Some of the layers, and the color guide.

It all worked somehow. From thirteen layers to the printed page. The presentation below might fit into the “gratuitous animation” category. If it does, apologies for that. I was just trying something.

See it in Munich A lot of my pre-computer artwork will be on show in Munich from March 9 to 11, at the EDCH and INCH conferences. I will also be giving one of the keynote presentations, and running a workshop.

Design conference: http://www.edch-conference.com

Infographics conferencehttp://www.inch-conference.com

Infographic workshop: http://www.inch-conference.com/en/workshops

Animated

INFOGRAPHIC GIFS.

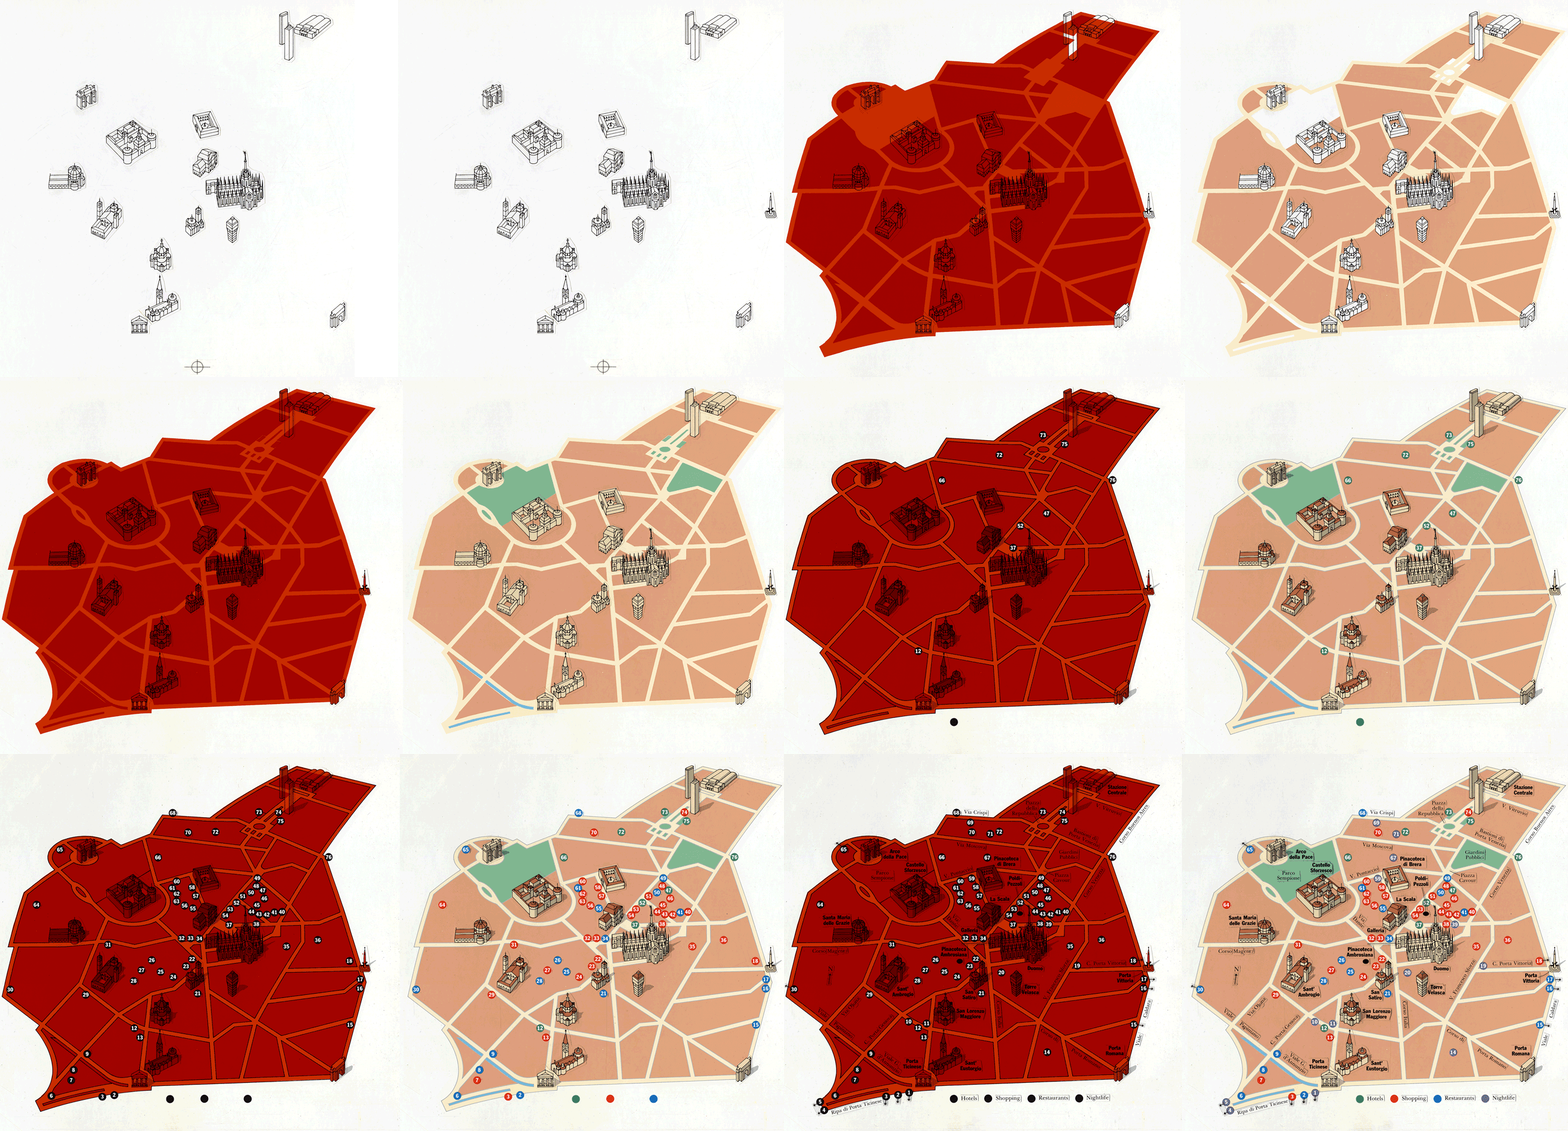
Although gratuitous motion in infographics has come in for a lot of criticism, it’s still true that animation can be very effective in a visual explanation. Here are a few examples that succeed in terms of grabbing our attention, and explaining something.

Engage our audience. Fun, humor, a little showbiz. I’m fine with all that, as long as we are clearly communicating some information.

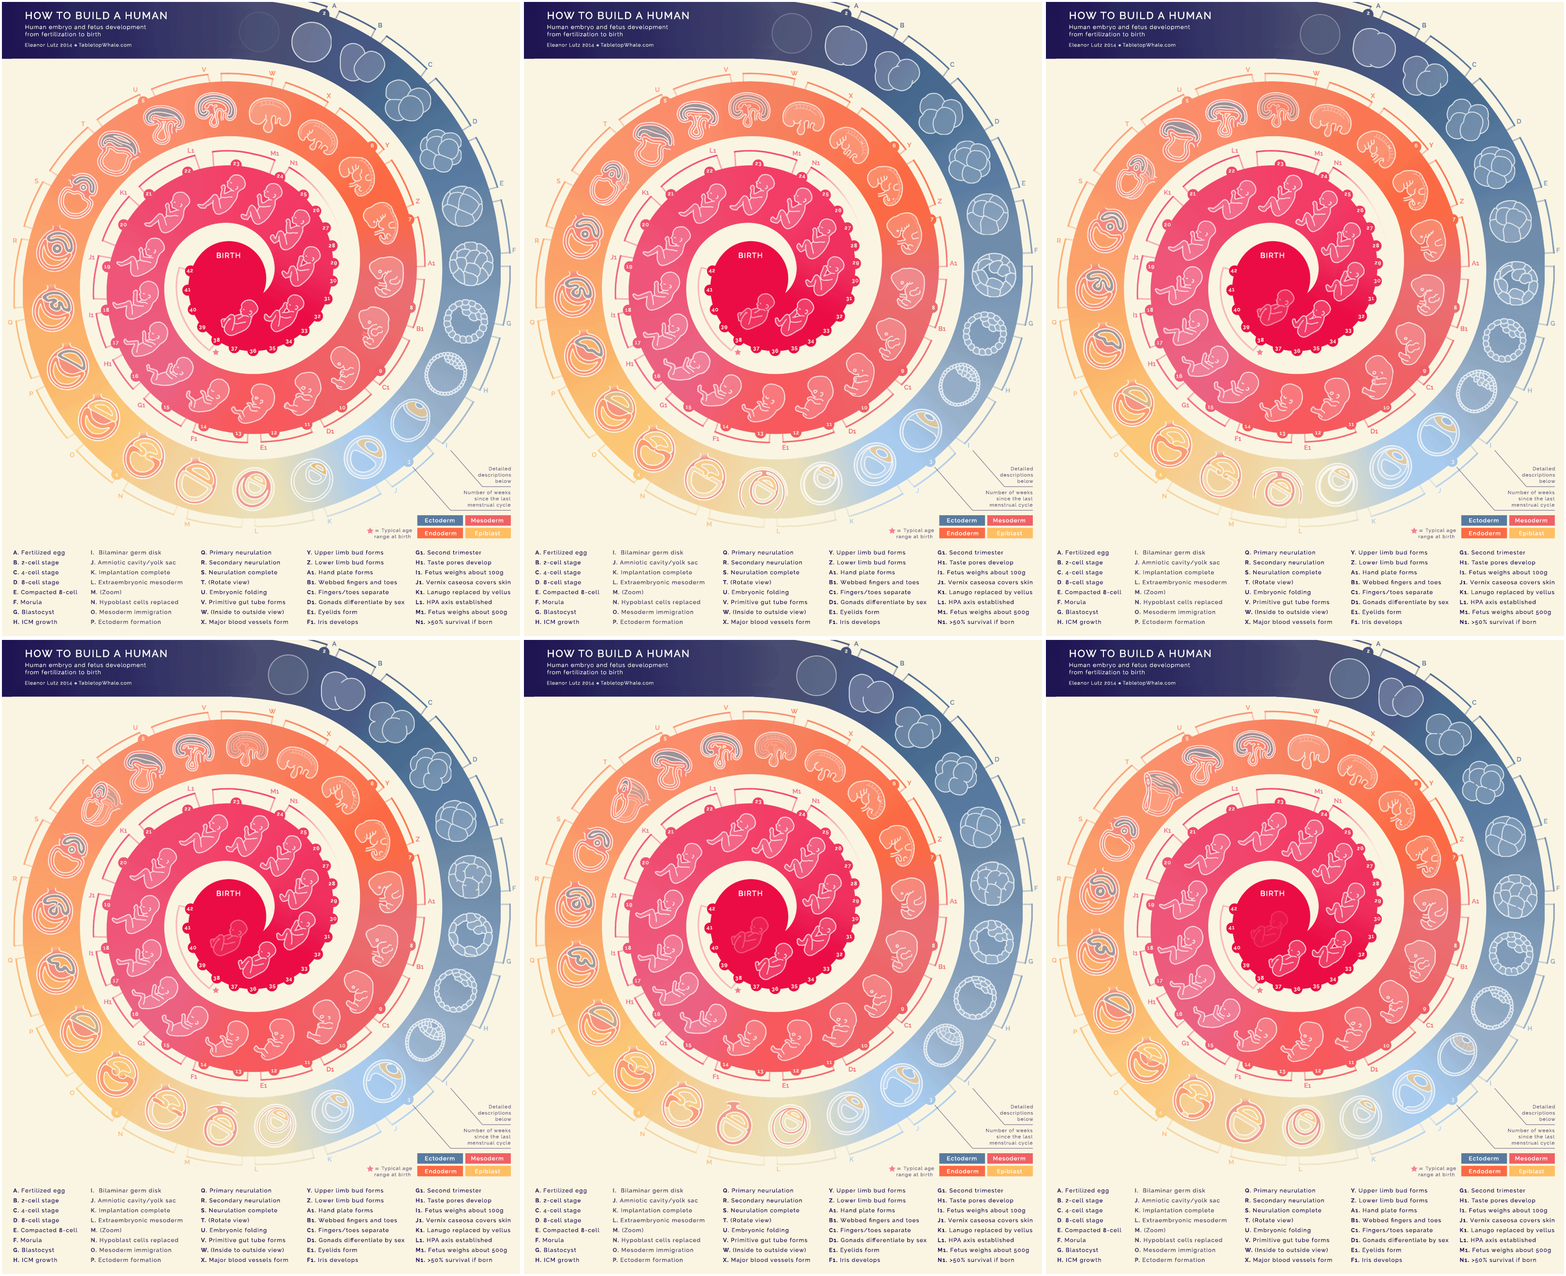
Above: From egg to baby, by Eleanor Lutz. (There are only nine frames in this file.) This was in my very first post, about the history of infographics, as an example of the current era. (https://www.johngrimwade.com/blog/2016/08/22/this-blog-started-35000-years-ago/)

See more of Eleanor’s work here: http://tabletopwhale.com

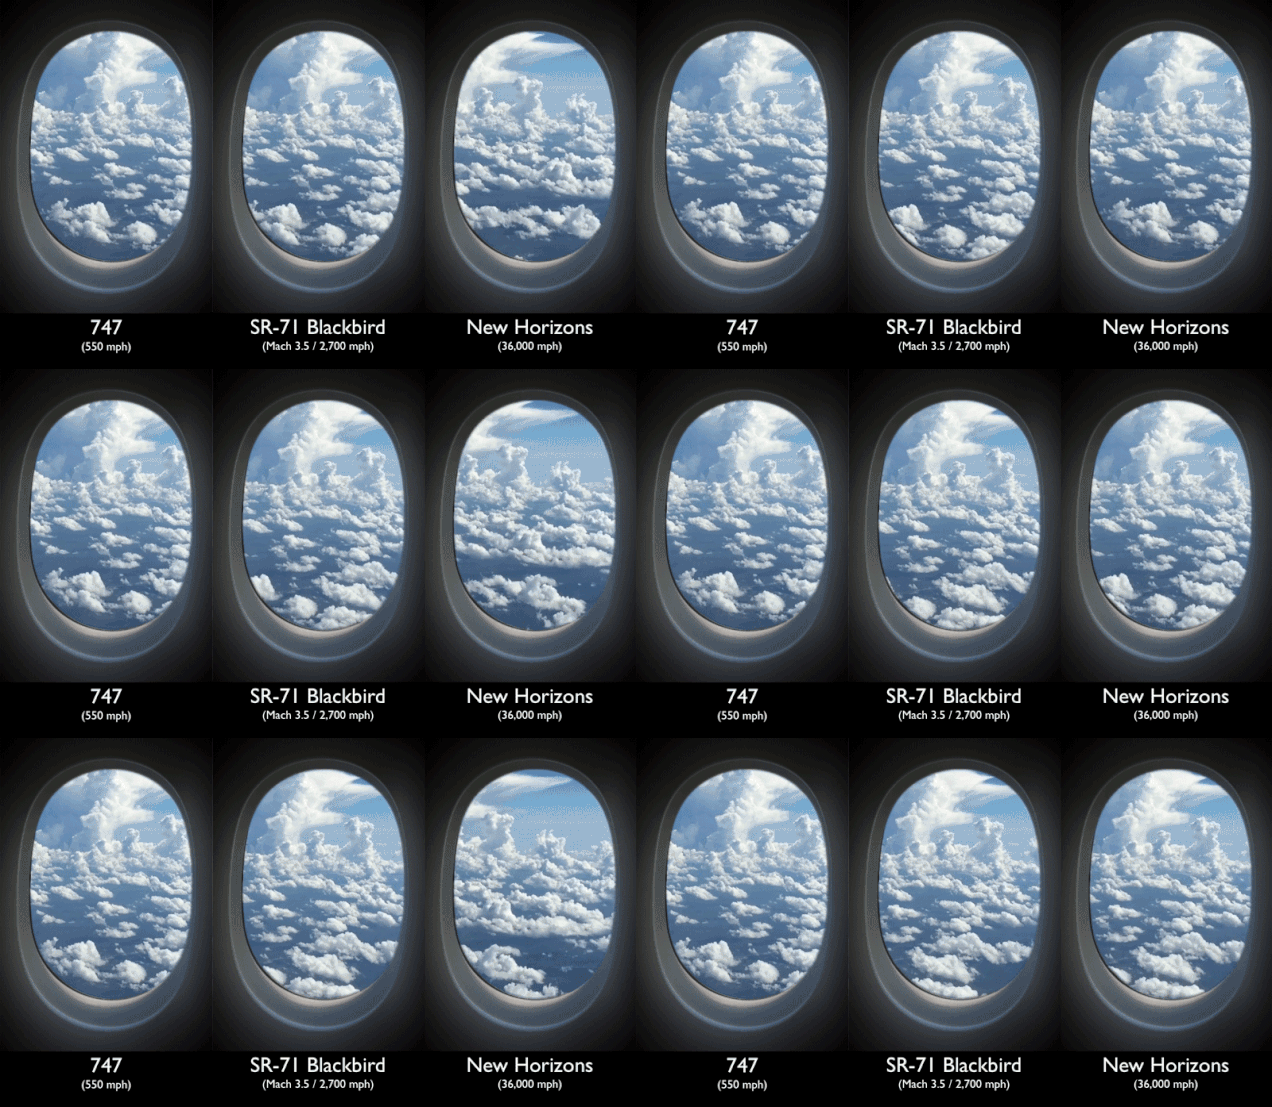
Below: How fast does a spacecraft travel? Clay Bavor puts that incredible speed into a context that works for us all.

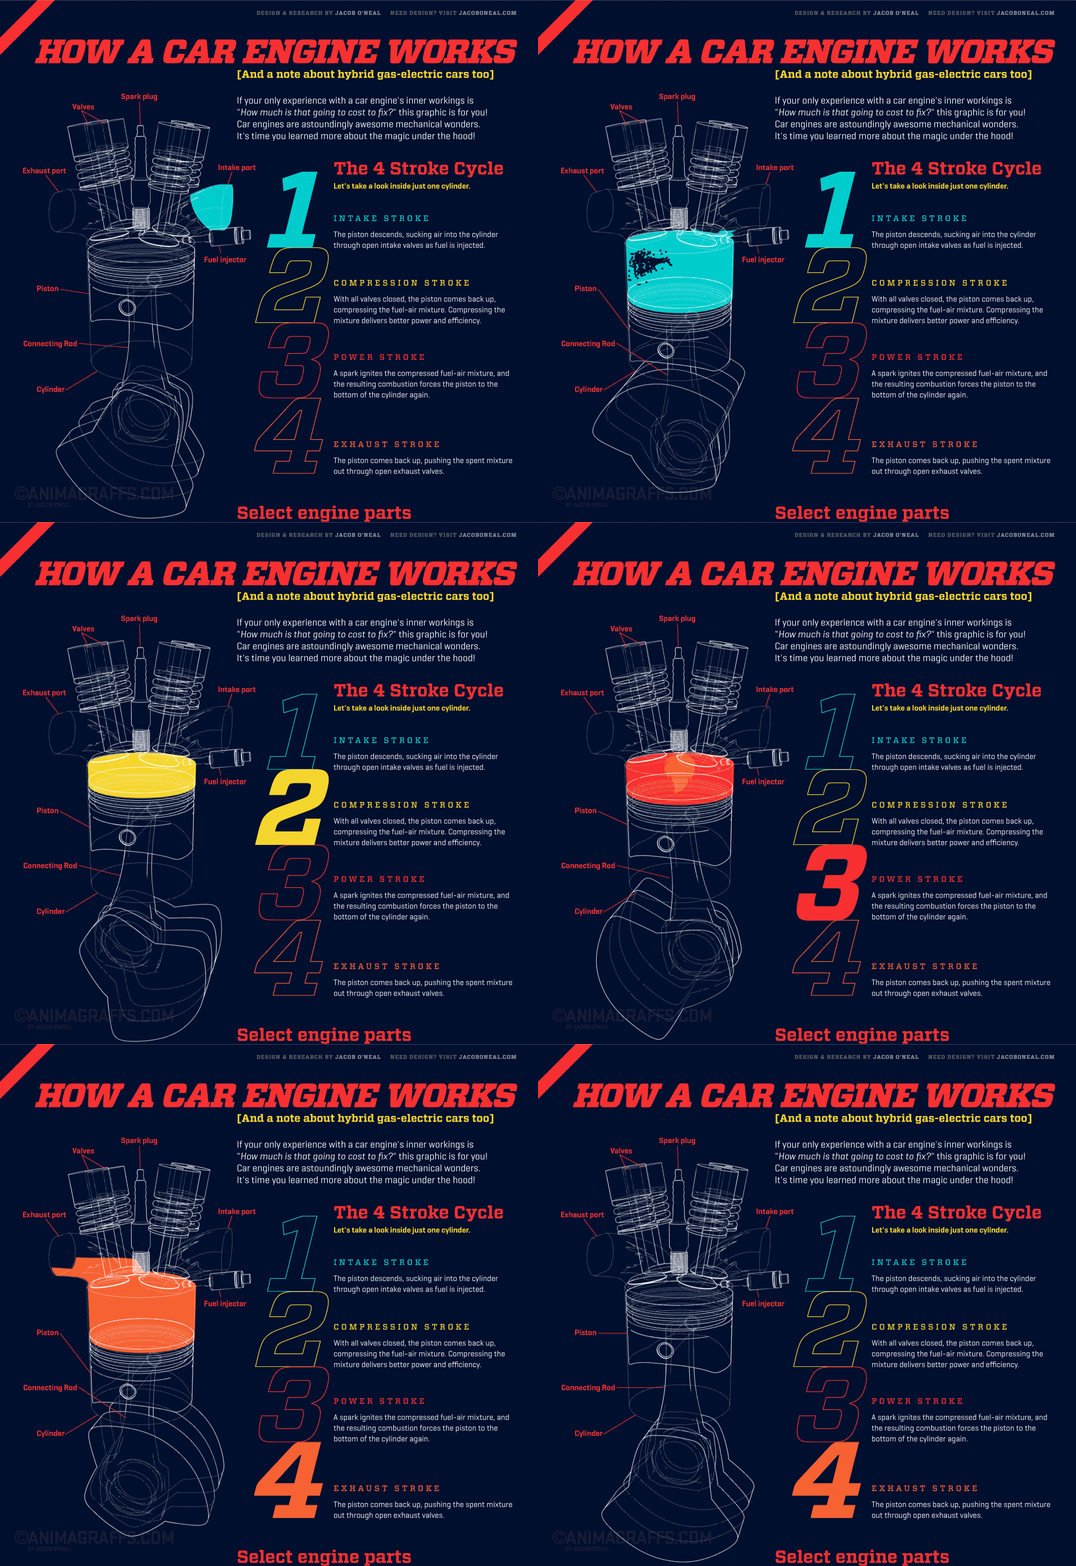
Engine combustion by Jacob O’Neill. See the whole graphic here: http://animagraffs.com/how-a-car-engine-works/

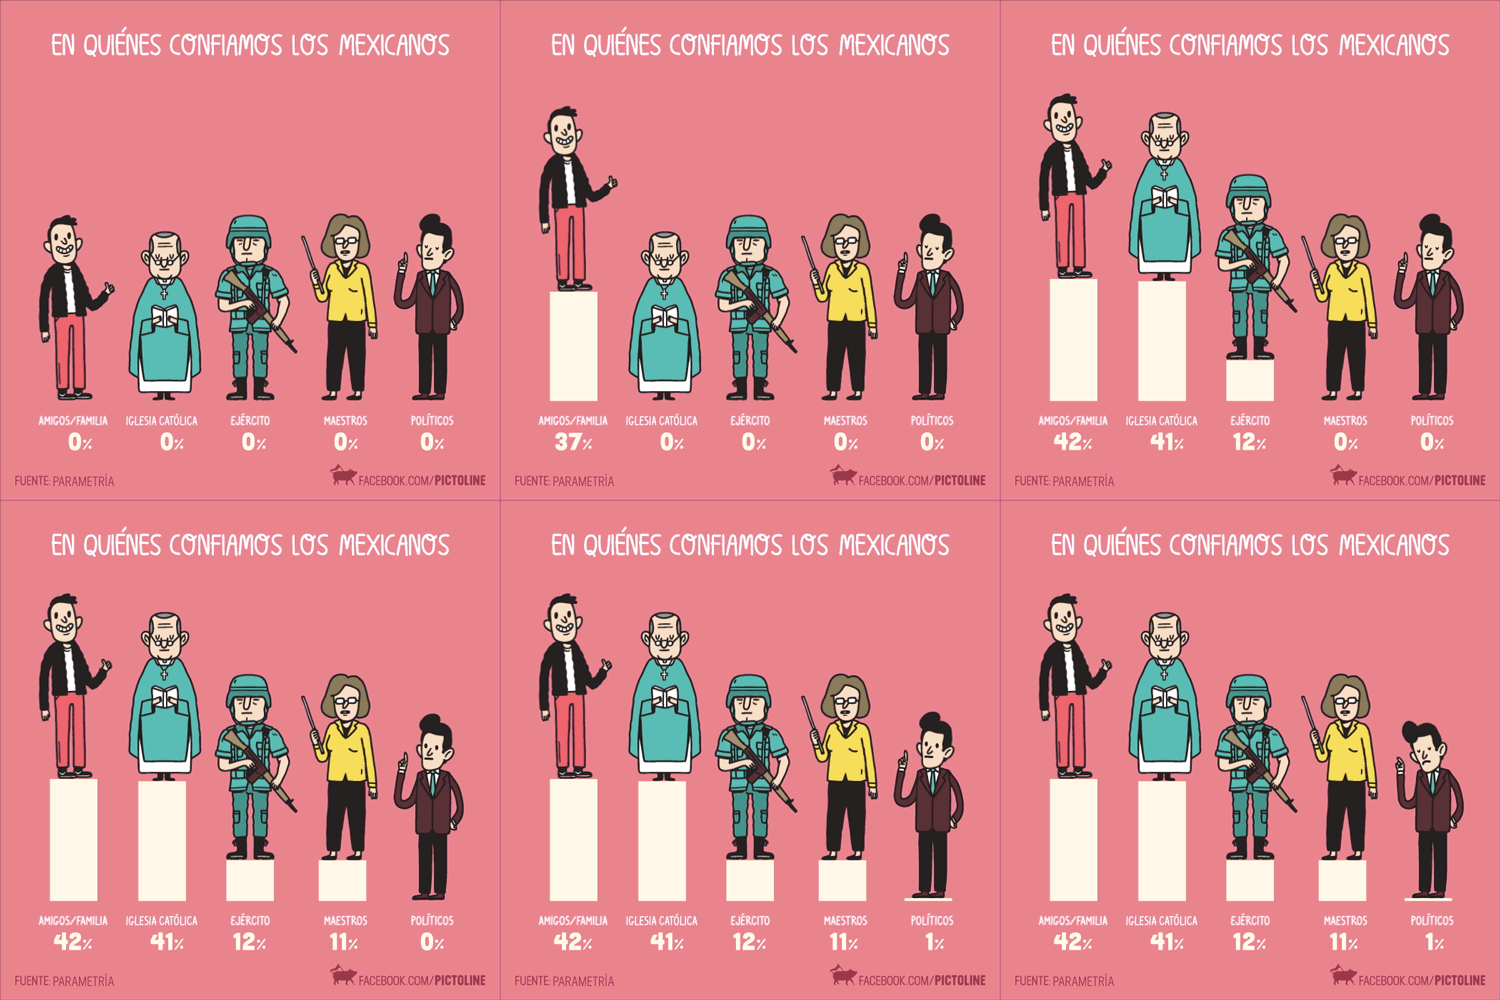
Who do Mexicans trust? By Pictoline: http://pictoline.com

Dot pattern

THE LETRATONE ERA.

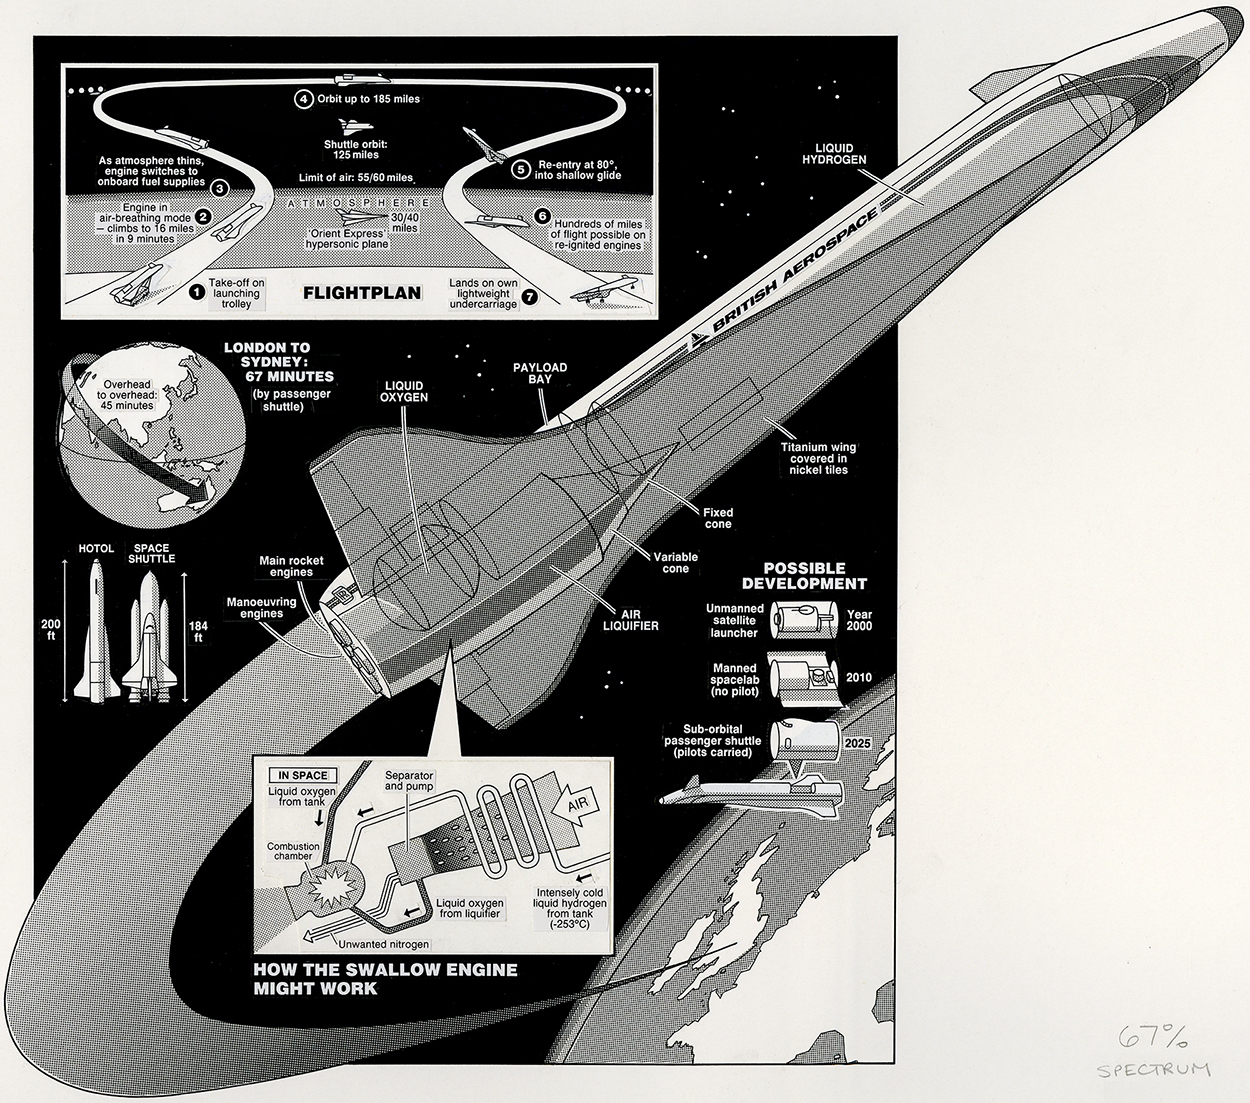
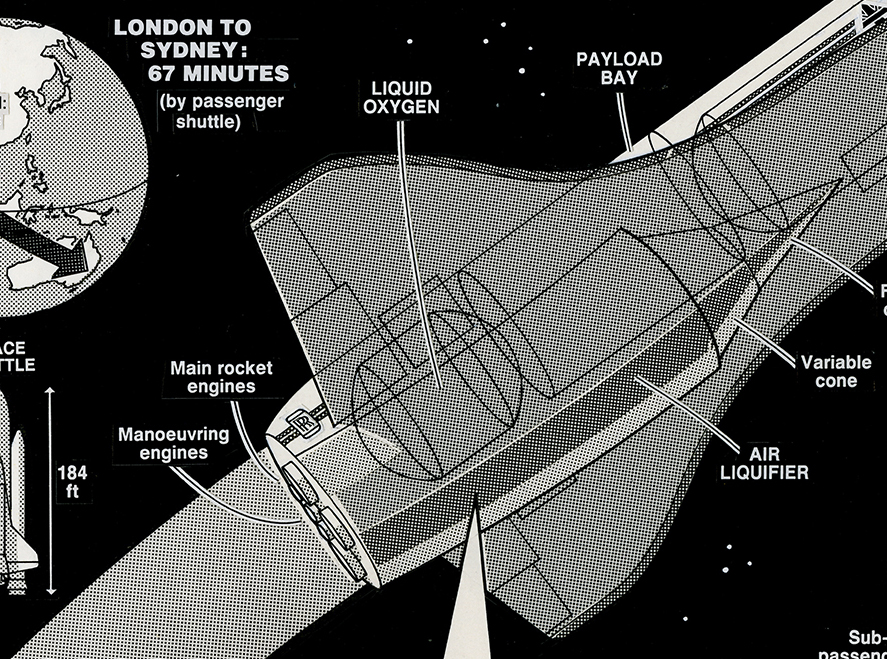
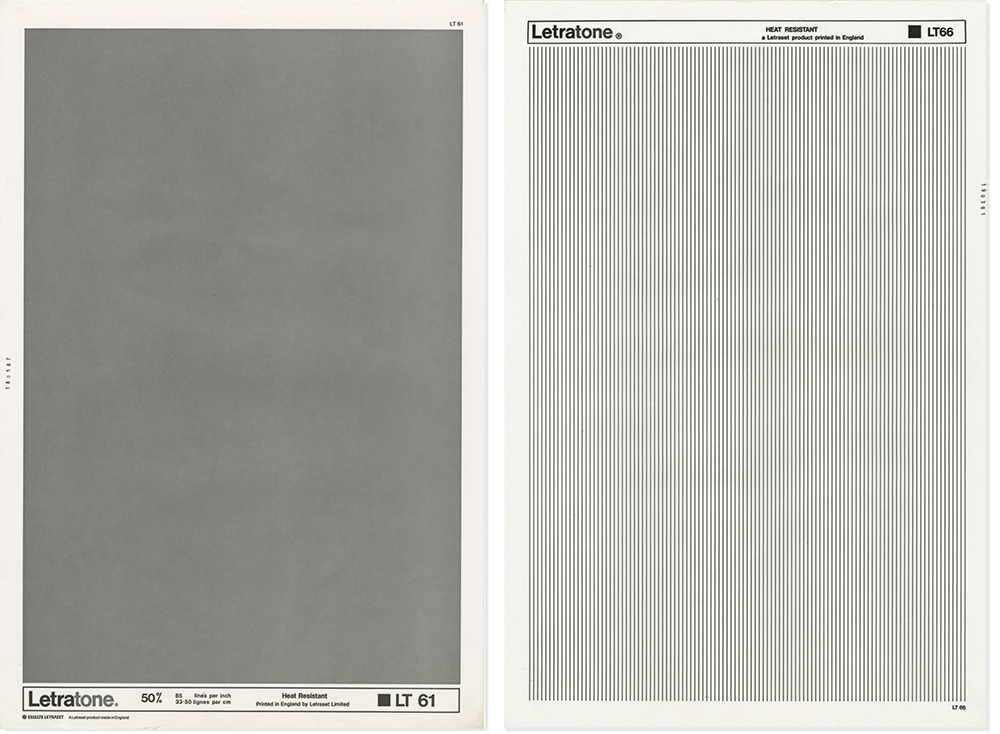
Back in the 1970s and 80s, Letratone ruled. (It was Zip-A-Tone and Chart-Pak in the U.S.) These sheets of adhesive-backed dot patterns and lines were vital to create the gray tones in line art, which was the staple of many print publications. With a variety of sheets, and a sharp knife, you could go crazy adding various grays, gradations, and all manner of line effects. Of course, you had to make sure that you were using the correct line screen for the reduction, otherwise the whole thing could fill in. This example is borrowed from the Grimwade National Archive (which is basically a drawer in someone else’s office). In the detail especially, you can see that the shrinkage of the adhesive tone over the years has left some white gaps. This would not be easy to fix without damaging the line art, so it will probably stay like this.

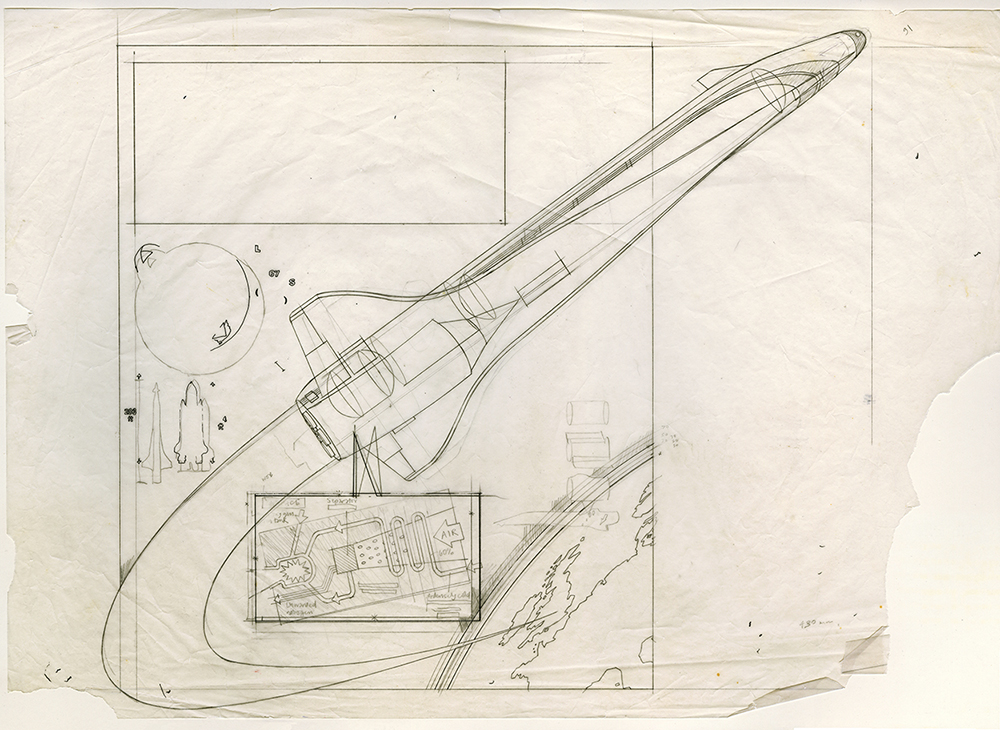
Below is the rough drawing that I started from. More roughs: https://www.johngrimwade.com/blog/2016/10/10/the-rough-idea/

I just purchased two sheets of Letratone on eBay. They arrived in pristine condition.
Coming soon Professor Michael Stoll (who has featured in number of posts) is putting on an exhibition of my work in Munich, from March 9 to 11, at the EDCH and INCH conferences. He has scanned a lot of the original art, and generally put a shocking amount of time into the whole process already. There will be several clear cabinets containing pieces of artwork, and some of the equipment used to produce it, plus posters showing how the art looked in the printed form. The exhibition is a comprehensive view of my career from analogue to digital.
The conference is in two parts: EDCH is Design and INCH is Infographics. I’m also running an infographics workshop. Perhaps I will see you there!

Design: http://www.edch-conference.com

Infographicshttp://www.inch-conference.com

Workshops: http://www.inch-conference.com/en/workshops

Infographic gods

I’M A PERSON, HE’S A CARVING, BUT WE EACH HAVE OUR INFOGRAPHIC ROLE TO PLAY.

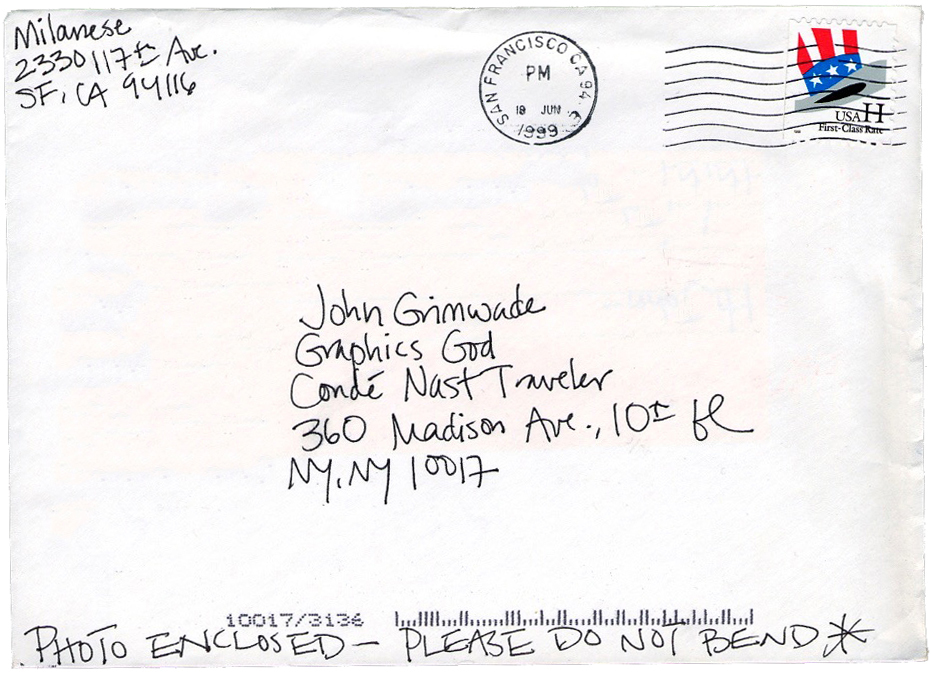
UNSOLICITED PRAISE In 1999, I received this letter. The person who sent it is now a Master Lecturer in the Writing Program at Boston University. Sometimes in my career, especially in the early newspaper years, I felt like a second-class citizen. “He’s just a graphics person,” was an attitude that I came across several times. I know other older (or just plain old) people in the field who have experienced this mindset, which (thankfully) has mostly disappeared in the last few decades. So although this is a very lofty, and certainly undeserved, designation, it works for me in terms of being the complete reverse of that “who cares about infographics” attitude. Thank you, Marisa.

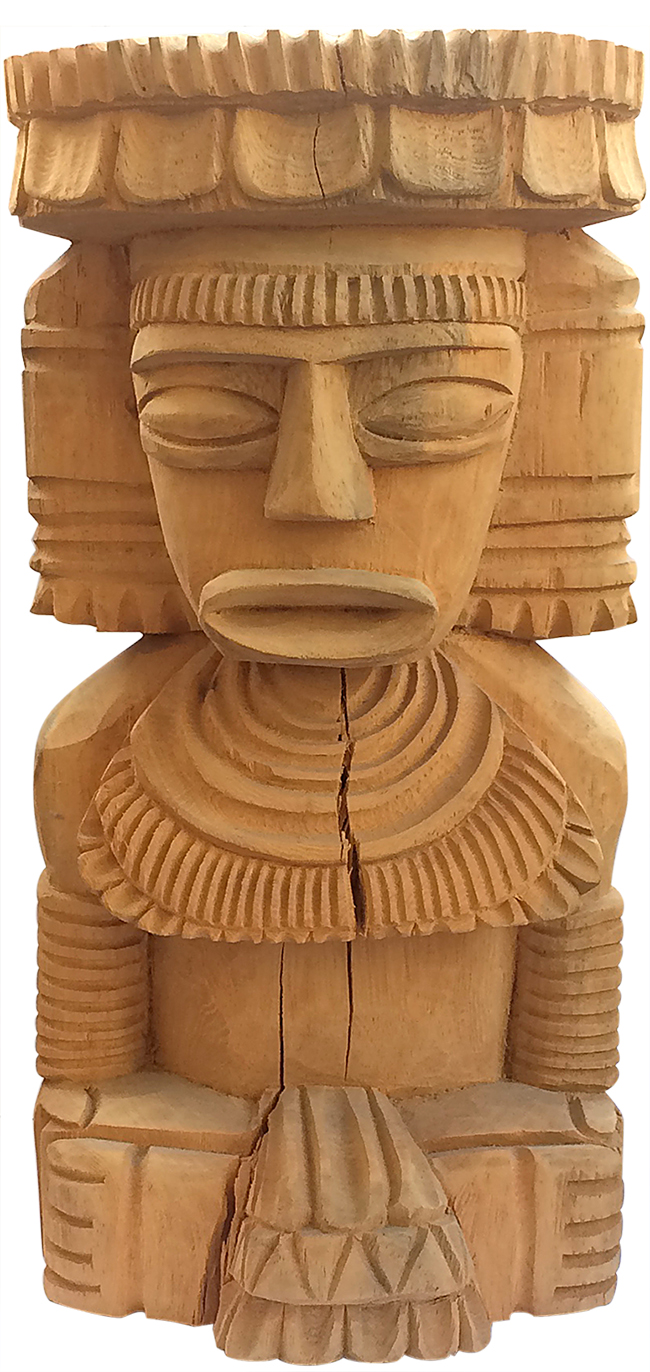
THE GOD OF GRAPHICS A wooden figure from Mexico has stood over all the graphics departments that I’ve worked in. Back in the early days at Condé Nast Traveler, we decided that this would be our talisman, looking after our infographic well-being. Now sporting a worrying crack in the torso, but as inscrutable as ever, the God of Graphics still watches over my studio. He/she doesn’t love my data-to-ink ratio, but I’m working on that.

More rubbish

INFOGRAPHICS THAT WENT WRONG.

I am finding far too many of these badly-conceived graphics in my collection. I could delete the files and pretend that I didn’t create them (“What food chart?”), or post the examples here and hope there is something positive that can be taken from them. We all learn from our mistakes, and I encourage my students to be adventurous, even if potential failure lurks in the shadows.

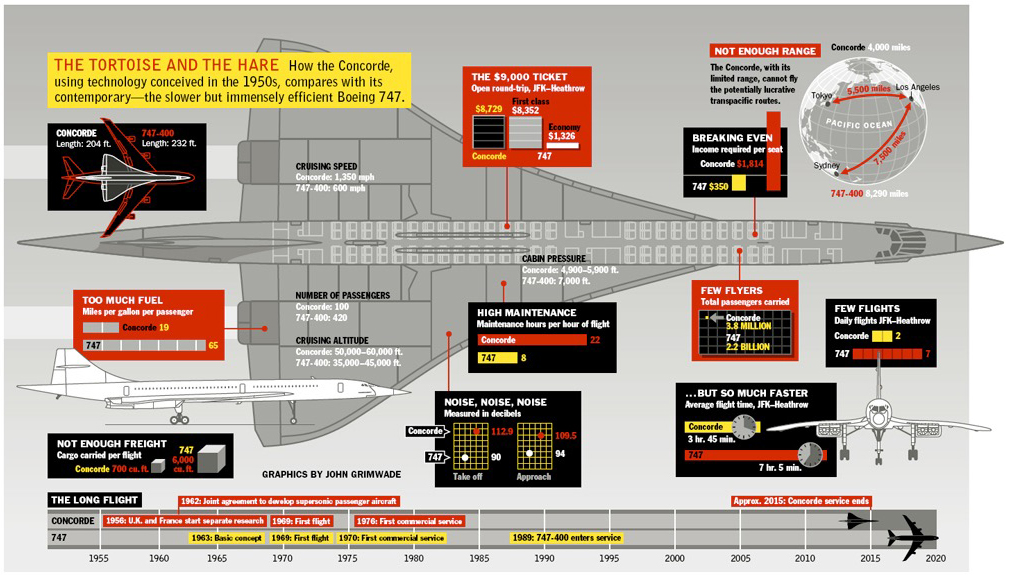
Concorde confusion Questions: Why does the color used for Concorde and the 747 keep switching around? Was my medication wrongly prescribed? There is an interesting use of boxes as well. I have trouble believing that I am responsible for this one. On second thoughts, it must have been done by someone else. Well, that’s a relief.

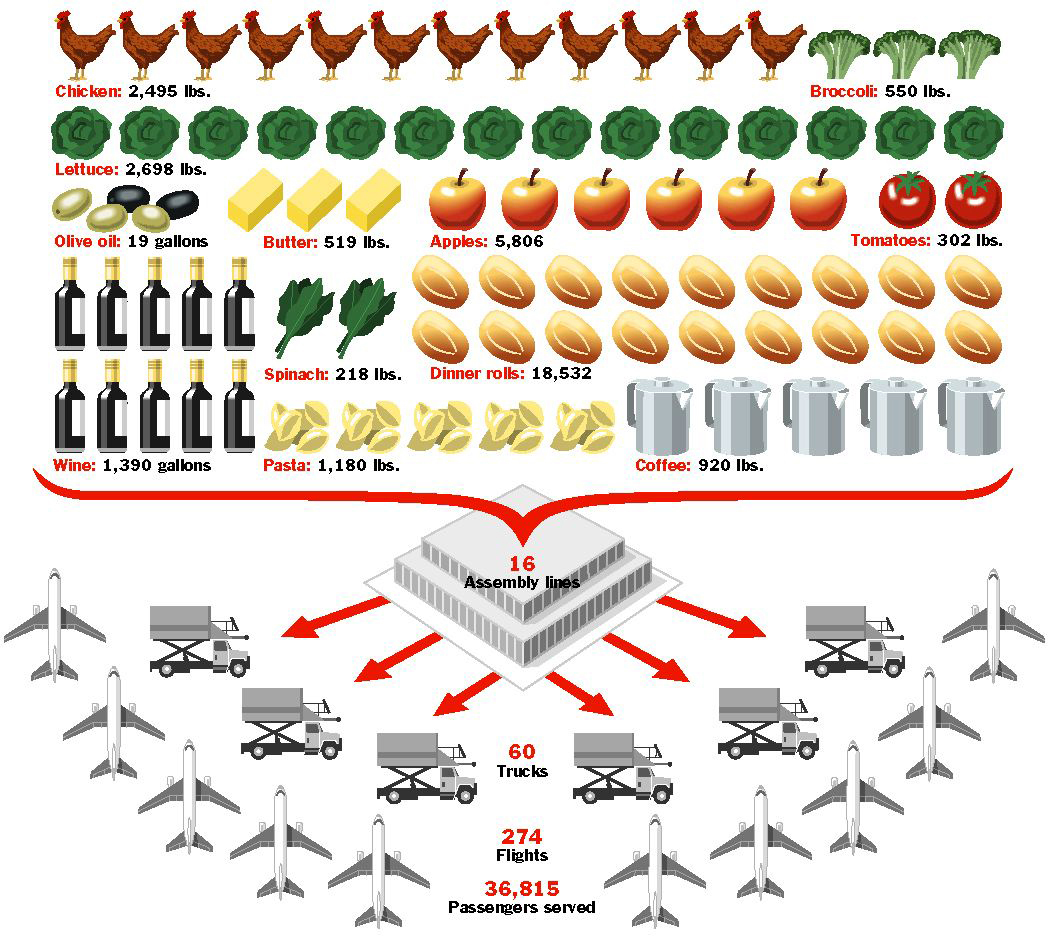
Catering nonsense There is, believe it or not, an underlying logic to the chart below. I wrote it all out on a piece of paper, so there must be. One chicken represents 200 lbs. One apple equals 6,000. (What?) These items cannot be compared, and it doesn’t make any sense as a chart. This is complete crap. Memo to curriculum committee: Do not let this person teach data visualization.

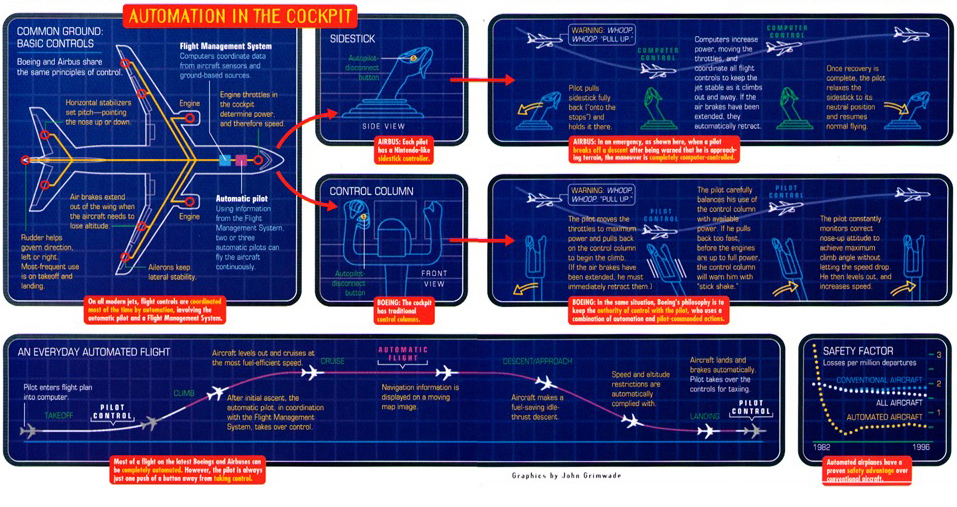
Styling takes over The next infographic (might be the wrong name for it) apparently explains and compares the cockpit systems of Airbus and Boeing. It’s a very poor graphic, but a very fine example of a heavy-handed stylistic idea ruining an explanation.

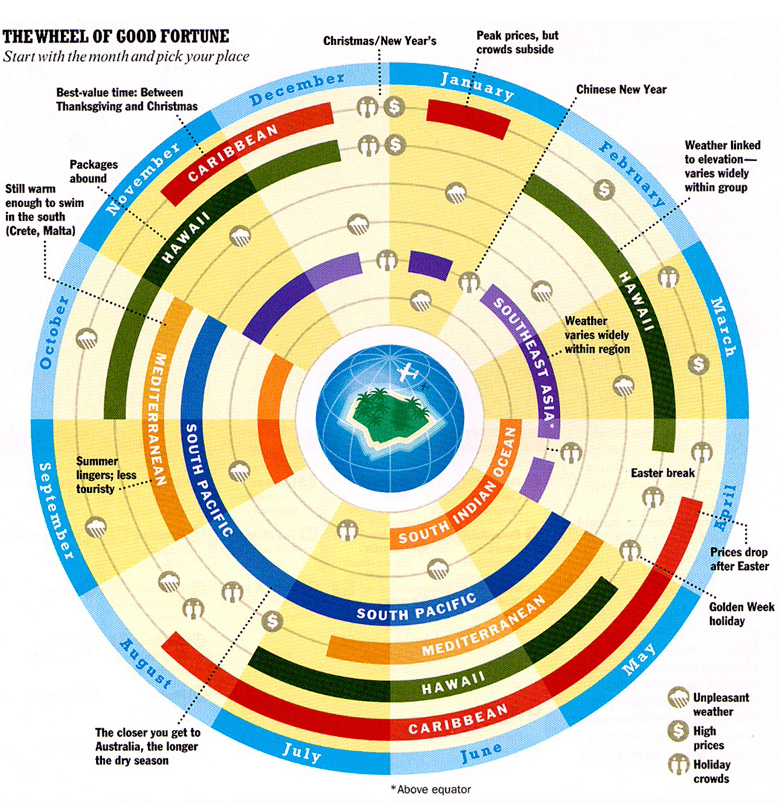
NO That’s my only comment on this wheel thing.


The infographic from hell

NOT ONE OF MY FINEST MOMENTS.

We have all probably had an infographic (or several) that failed. Perhaps the original concept was flawed, the information was of poor quality, or the execution let the project down. In my career, I have had numerous misfires. They have mostly been deleted, or consigned to old and (hopefully) unreliable hard drives. This is one of the most memorable examples. It’s from my “Looney Tunes” period, complete with wacky perspective, drop shadows, and assorted other types of graphic gimmickry. It is clearly an infographic that cannot be trusted.

In fact, while it was in the preliminary stages, Alexander Liberman, the legendary editorial director of Condé Nast, summoned me to his office (for the one and only time) to explain it. And somehow, in a feat of surprising infographic gusto, I managed to persuade him that it was showing something worthwhile. However, his initial reservations subsequently turned out to be entirely justified.

Once the pain of an infographic screw-up like this has subsided, it’s time to learn from the experience and move forward. Fortunately, I had better moments at Condé Nast, but I remembered this nightmare.