Category: Infographics

Telescopes

WATCHING THE UNIVERSE.
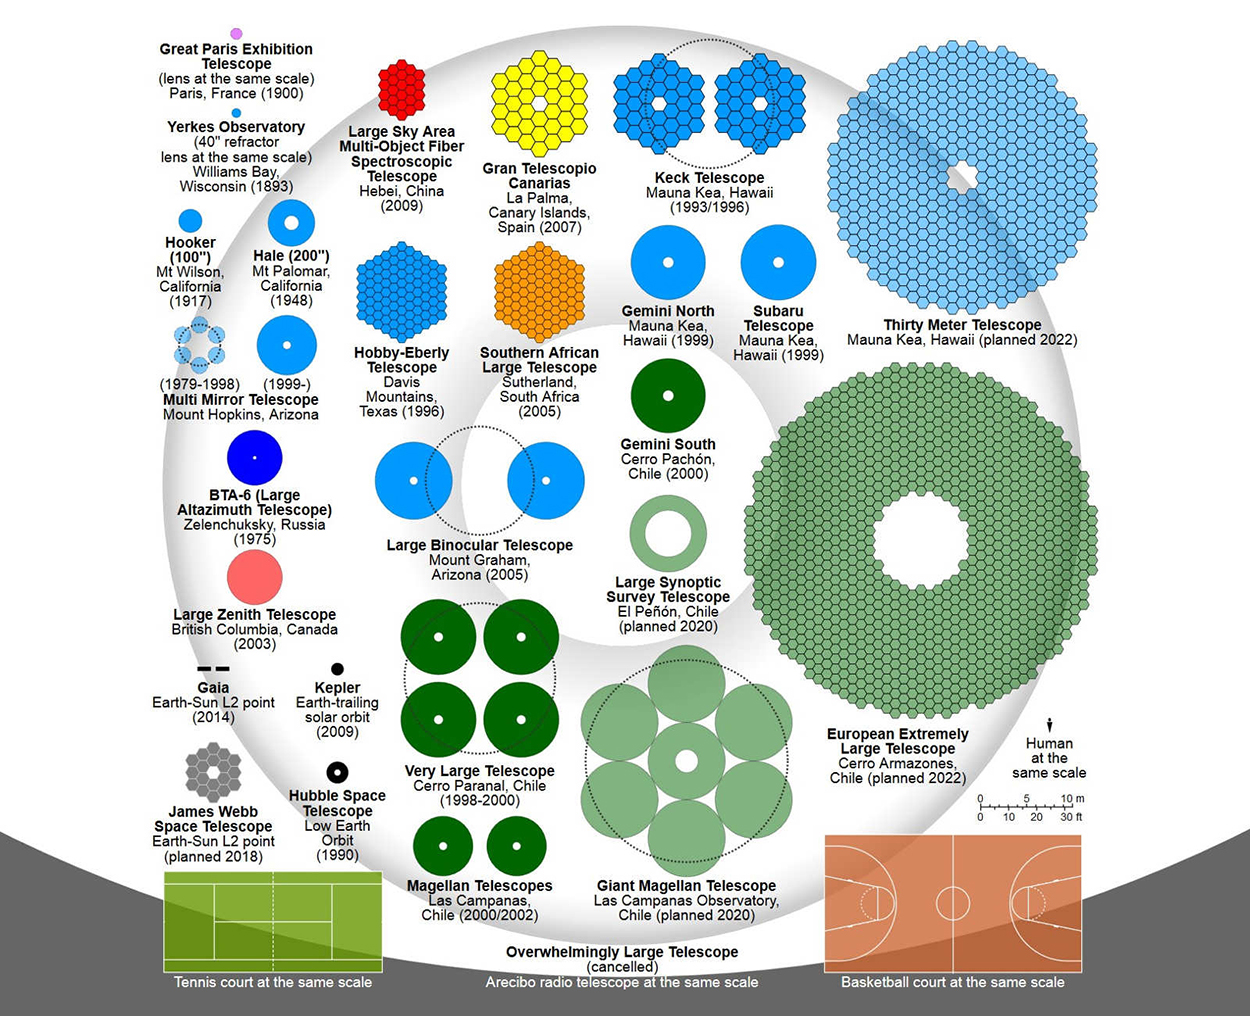
A comparison of primary mirrors. If a telescope has more than one mirror, the dotted lines show how large a single mirror would be (if it had the equivalent light-gathering ability). Below, some details of the three telescopes with the largest mirrors.
Infographic by Cmglee (via Wikimedia).

Overwhelmingly Large Telescope (OLT)
Sadly this massive example (with its “this-is-what-it-is” name) has been canceled. The mirror would have been a shocking 328 feet (100 meters) in diameter. It could have captured images 1,500 times fainter than the faintest Hubble Space Telescope image. Huge telescope mirrors are segmented because it’s not practical to make, or transport over long distances, a single mirror of the same size. By the way, the OLT would have cost $1.5 billion.


Image: ESO.

Extremely Large Telescope (ELT)
Under construction in the Atacama Desert, Chile. It’s estimated that the images captured will be 16 times sharper than those from the Hubble Space Telescope.


Image: Swinburne Astronomy Productions/ESO

Thirty Meter Telescope (TMT)
Proposed for Mauna Kea, Hawaii. Will operate in the near-ultraviolet to mid-infrared part of the spectrum.


Image: TMT Observatory Corporation

Laser guide
The Very Large Telescope (VLT) in the Atacama Desert, Chile, is an array of four large optical telescopes, and four smaller auxiliary telescopes, working in unison. The Laser Guide Star (LGS) creates an artificial star at an altitude of 56 miles (90 km). The telescopes use a system called “adaptive optics,” that makes optical corrections for atmospheric distortion using this laser reference point. Computers send signals to deform the secondary mirrors and thus make the necessary high-speed adjustments to the real-time image. The primary mirror’s shape is constantly adjusted using “active optics,” a computer-controlled system of actuators.
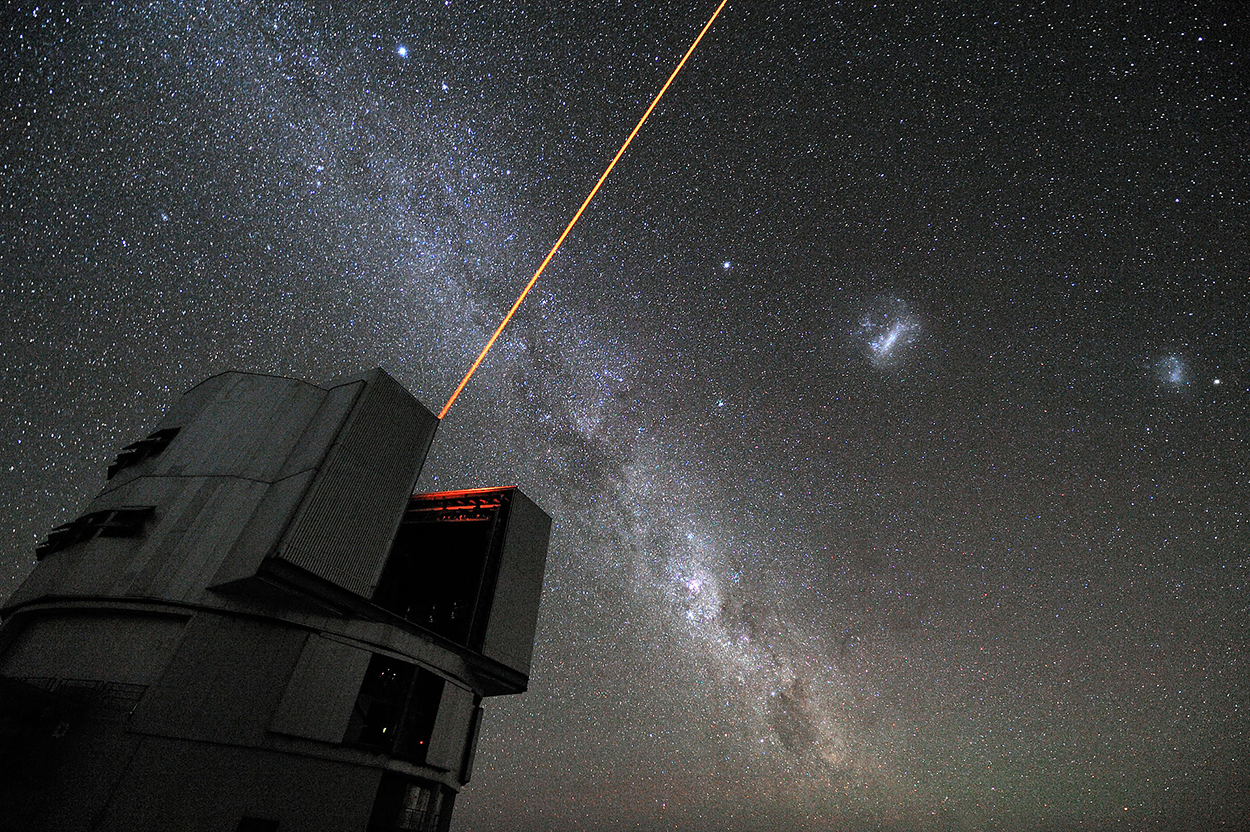

Photograph: G.Hüdepoh/ESO.

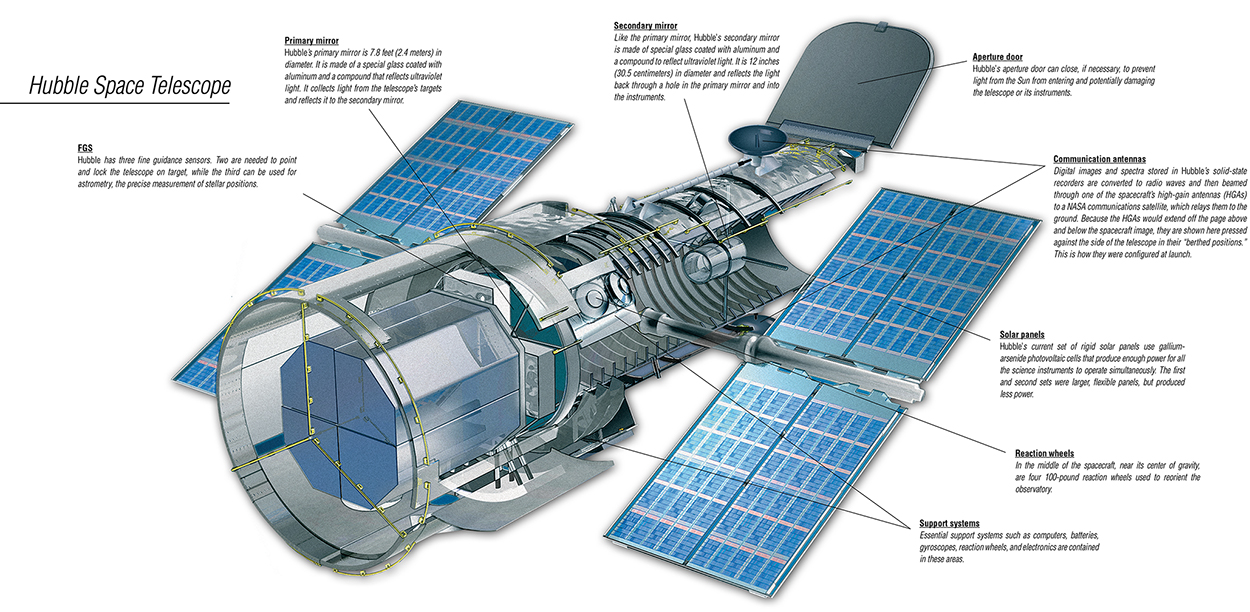
Hubble Space Telescope
This very successful orbital workhorse was launched in 1990 into a low Earth orbit of 340 miles (547 km). It’s primary mirror is 7.8 feet (2.4 meters) in diameter. Now, here comes one of those mind-blowing space facts (from NASA) that none of us can get our head around: Hubble can lock onto a target without deviating more than 7/1000th of an arcsecond, or about the width of a human hair seen at a distance of one mile. And it’s moving at 17,000 mph (27,300 kph).
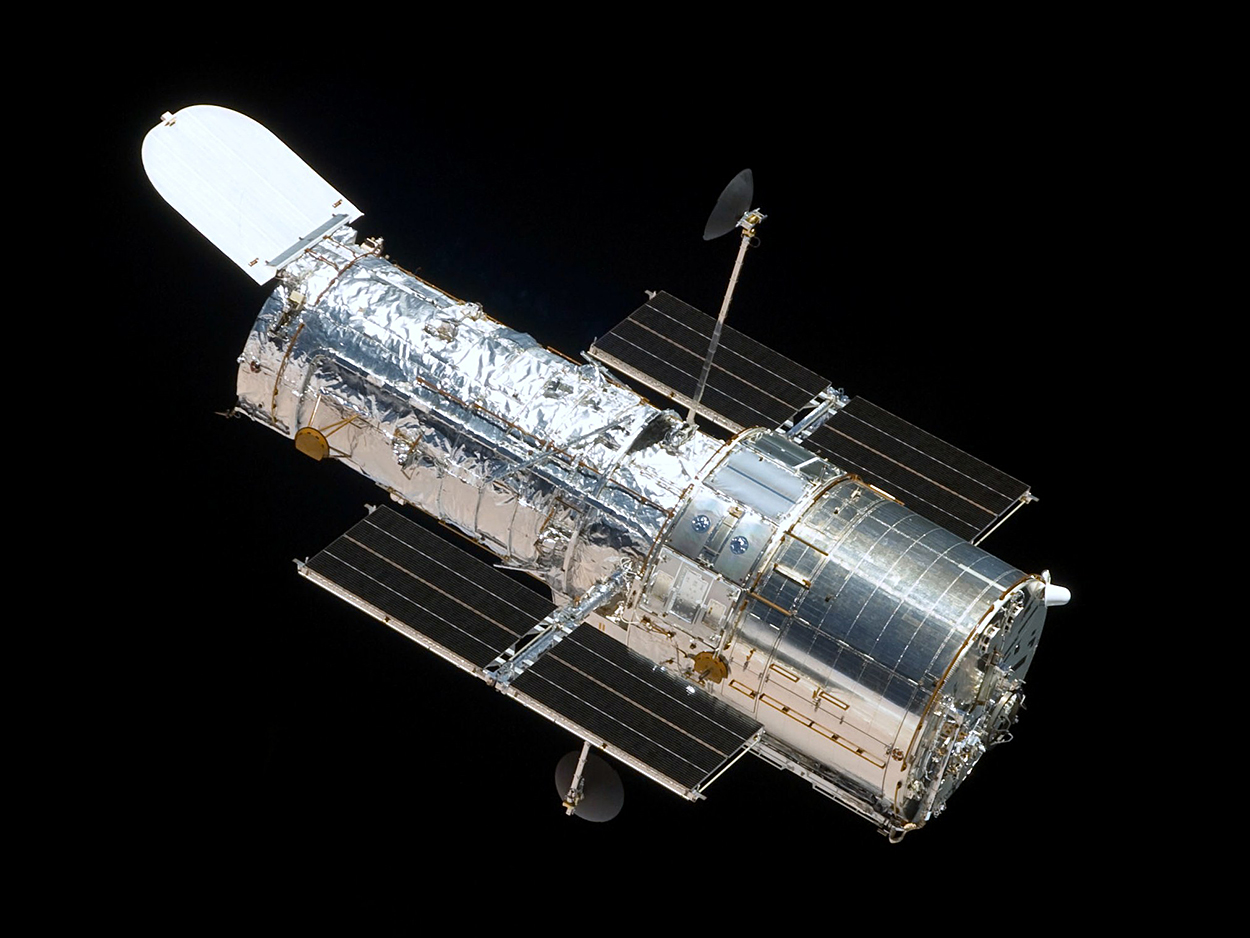

Photograph: NASA.

Inside view. Click on the image for a larger version.

The future of space observation
The James Webb Telescope, launching in 2021, will be parked about one million miles from Earth. It’s orbit around the sun at Lagrange point 2 (L2) is optimal for maintaining a constant temperature. The sunshield will keep out light from the Sun and the Earth, and allow the telescope’s sensors (which detect infrared light) to generate unprecedented views of stars and galaxies.
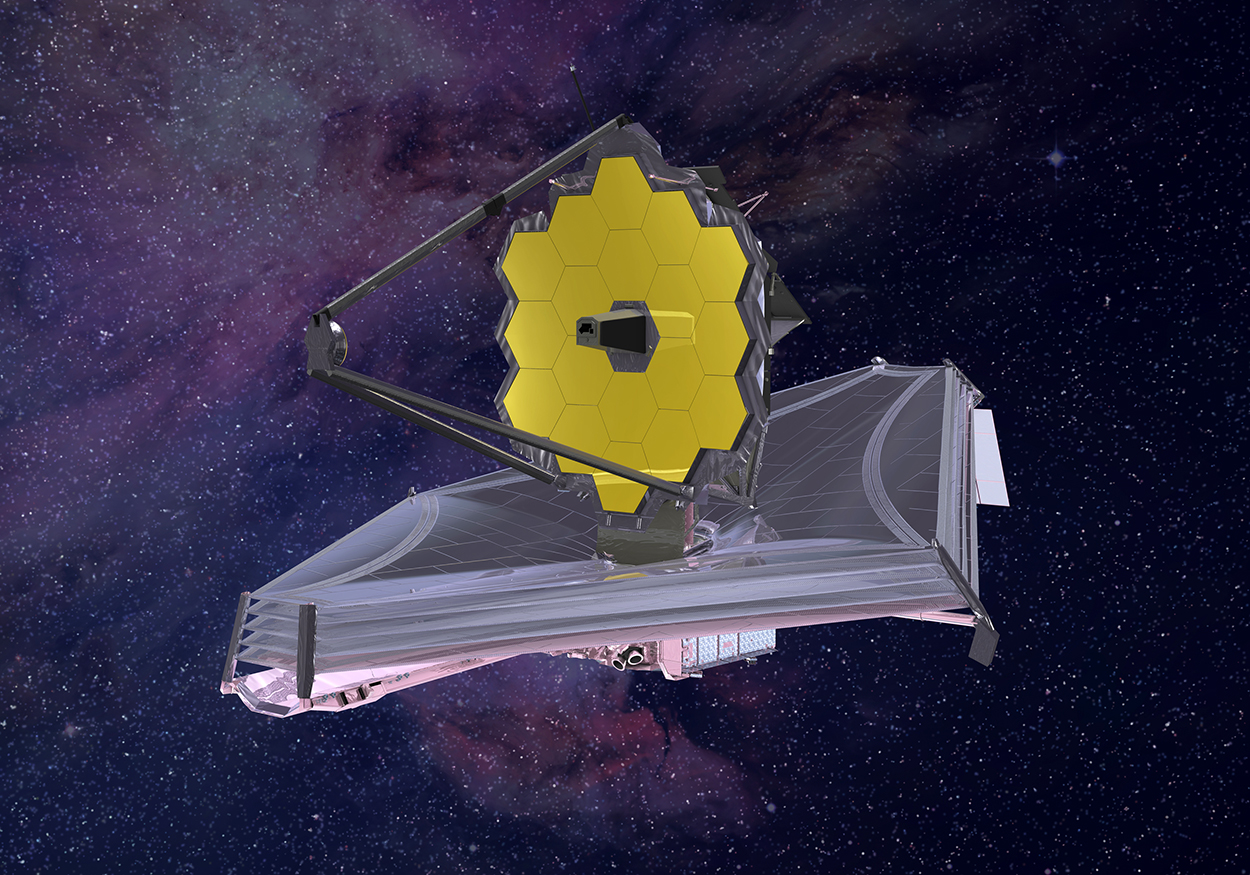

Image: NASA.
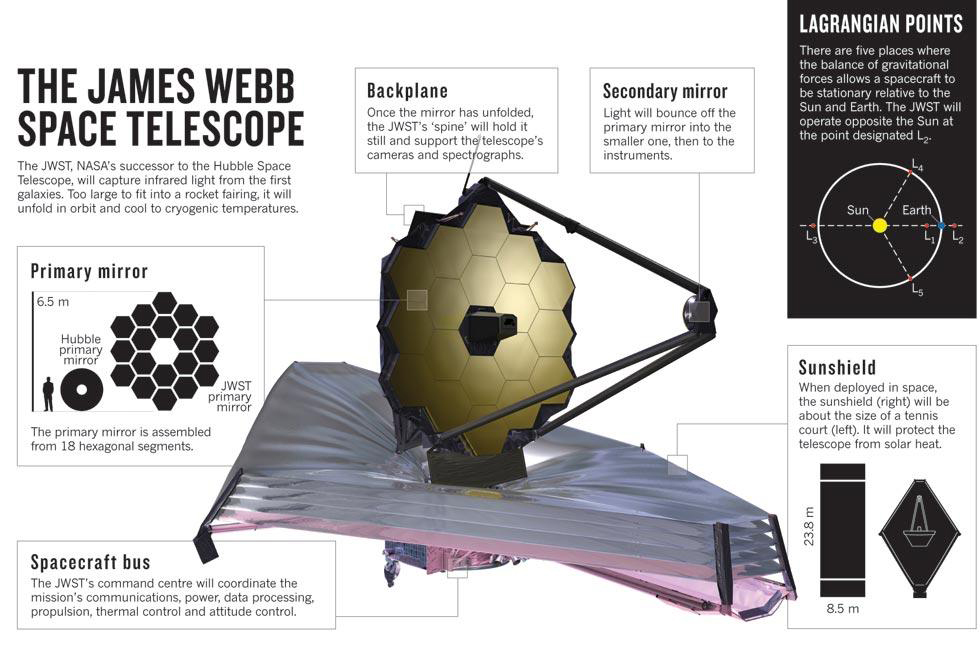

Infographic: NASA

The primary mirror is made of gold-plated beryllium. Explore the telescope in 3D here: https://wst.nasa.gov/webb3d/#
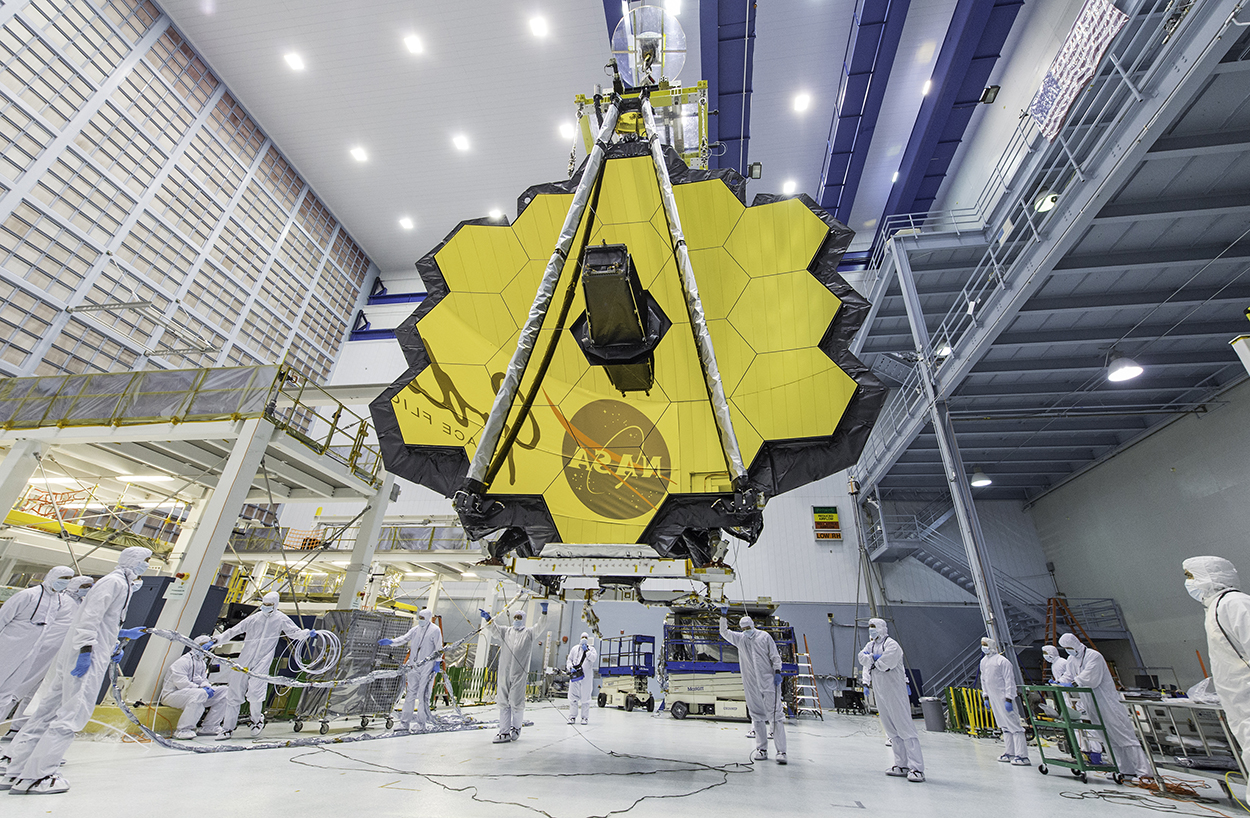

Photograph: NASA.

Traditional
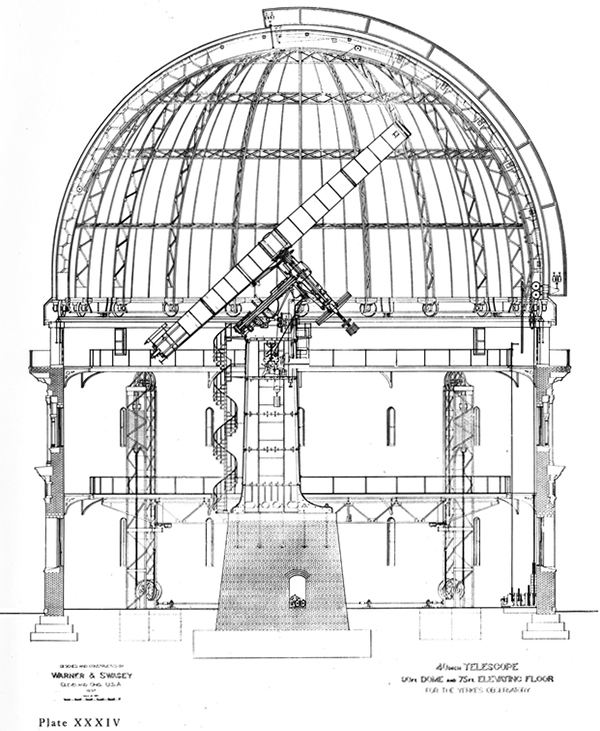
The Yerkes Observatory in Williams Bay, Wisconsin, houses the world’s largest refracting telescope, which has a 40-inch lens (102 cm). It was completed in 1897 for the University of Chicago. The telescope played a huge role in the development of modern astrophysics, but has been superseded by technological developments, and will close next month.
Albert Einstein paid a visit to the famous telescope in 1921.
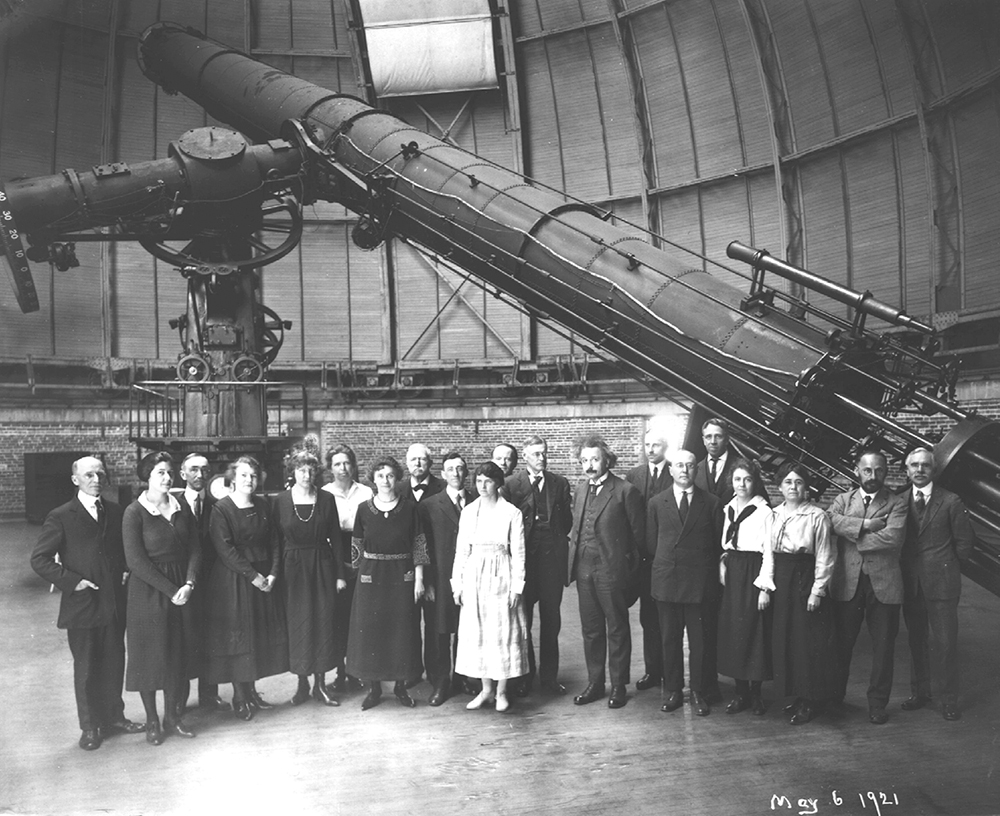

Photograph: University of Chicago Photographic Archive

A telescope for the people
Ohio University owns a 10-inch (25.4 cm) Fecker refracting telescope that was built in 1950. It was restored a few years ago to it’s original condition, and is now inside a new observatory building. In the photograph below, the project is nearly complete.
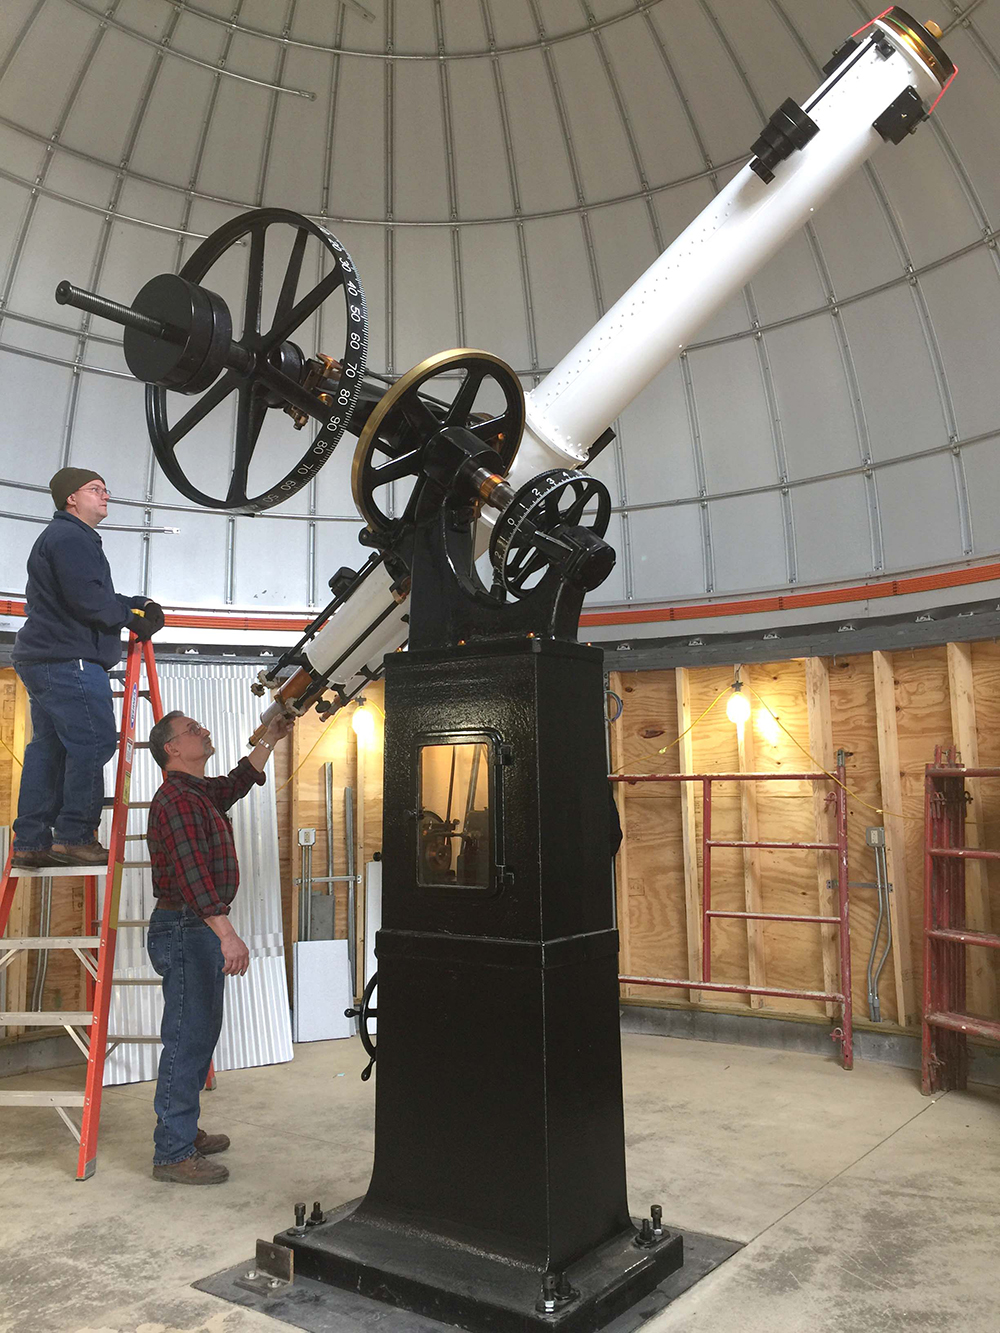

© Ohio University/Photograph by Jean Andrews.

Now the facility is frequently open to both students and the public, so they can experience the magic of looking at the stars.
The schedule: https://www.ohio.edu/cas/physastro/research/observatory/public-telescope.cfm
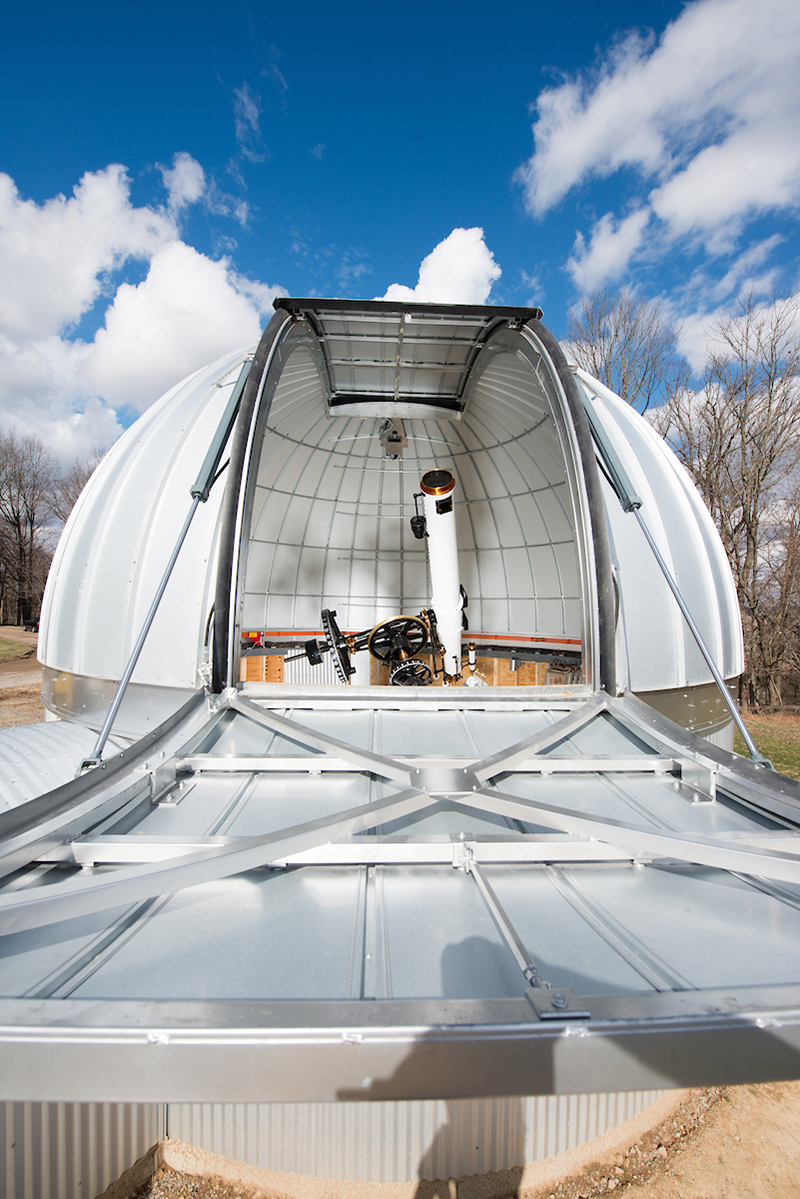
© Ohio University/Photograph by Ben Siegel.

Thank you to Ahmad Shamloumehr, a graduate student in Physics and Astronomy at Ohio University for giving me the idea for this post, and to Jean Andrews, Special Projects Assistant, Physics and Astronomy, for help with the OU images.

A related post, “The color of space:” https://wp.me/p7LiLW-2lV

Calibration

INFOGRAPHICS FOR SATELLITES.

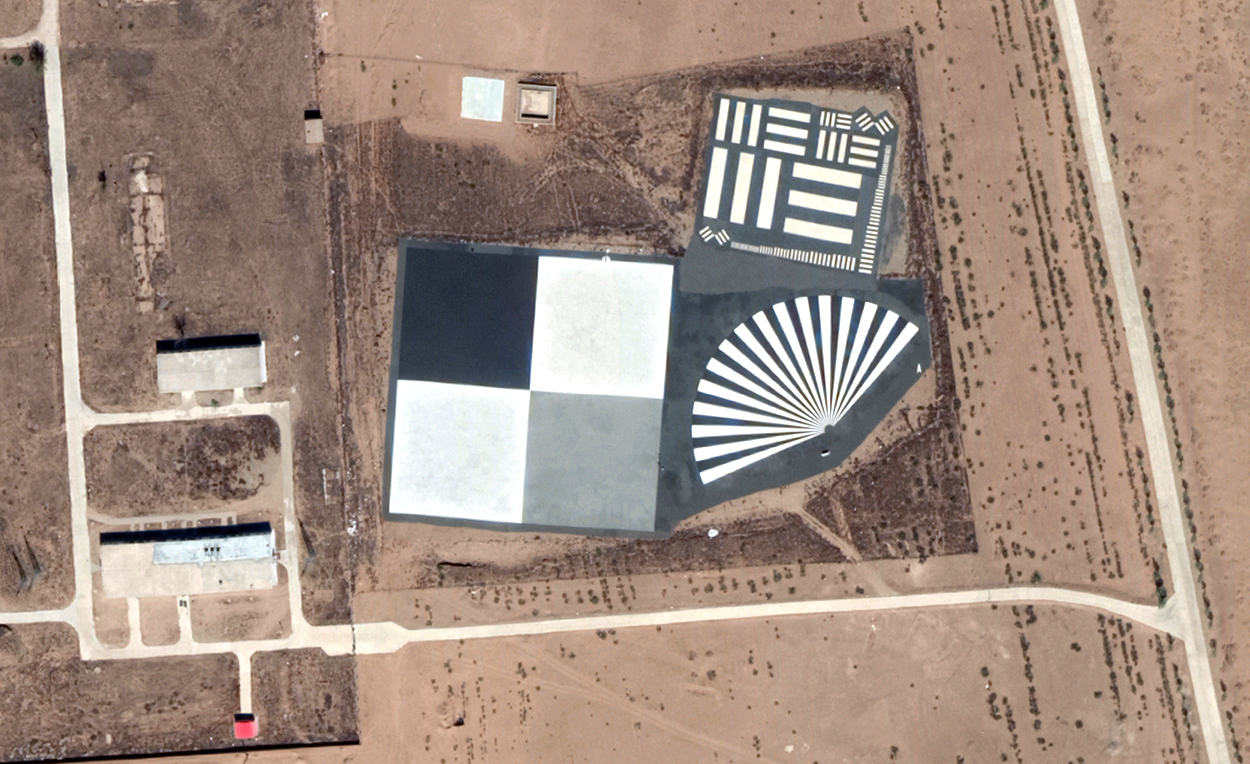
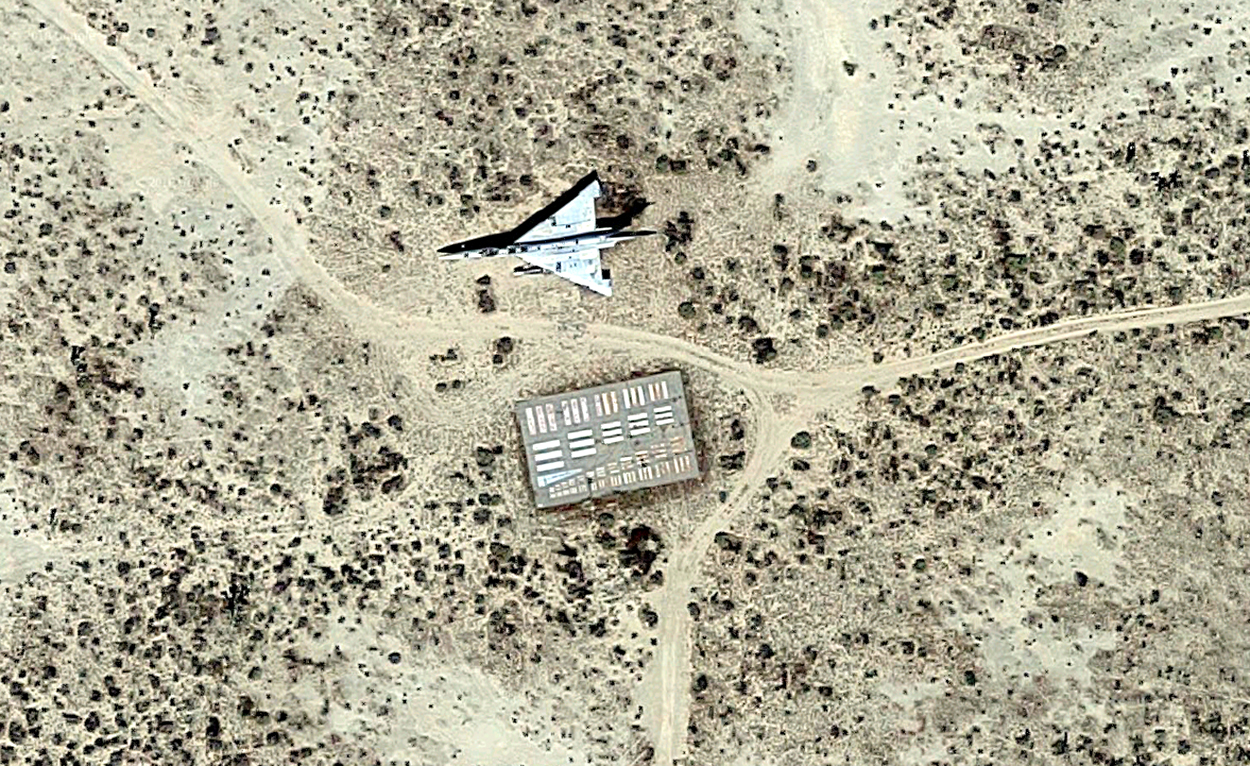
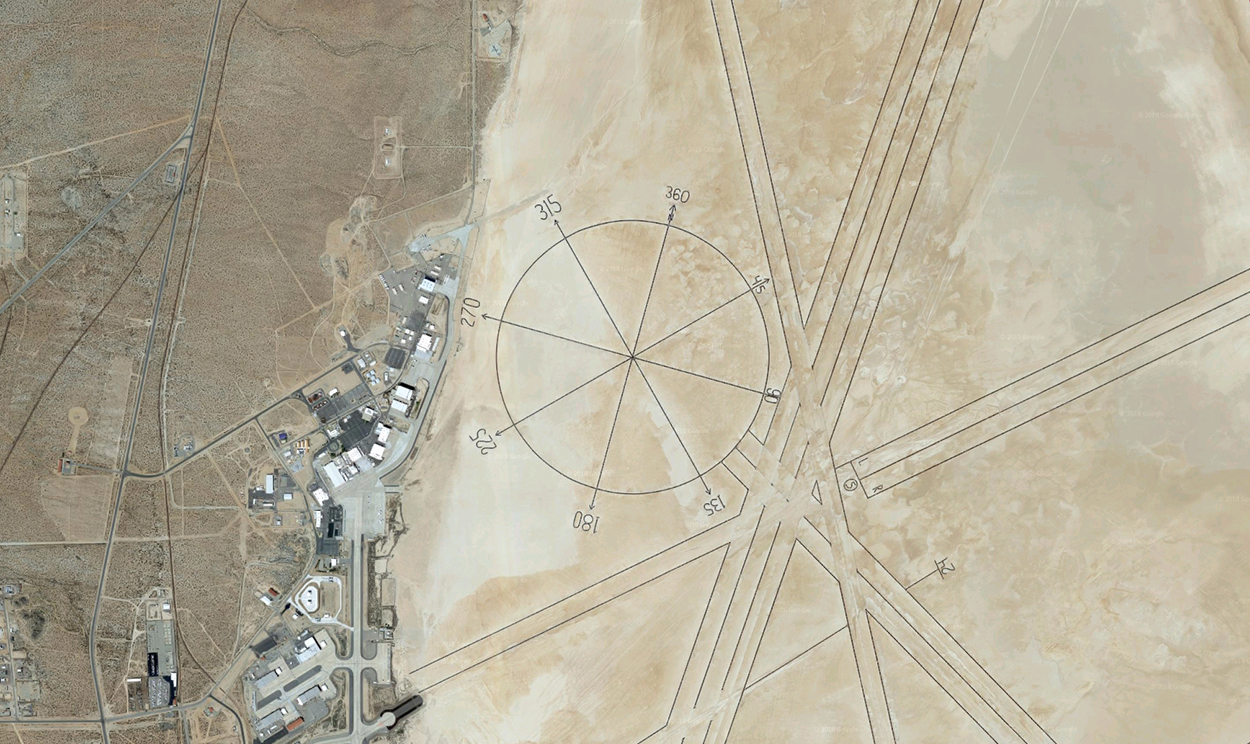
The Baotou Comprehensive Calibration and Validation Site in Inner Mongolia, China. Each painted panel is 157 x 157 feet (48 meters). Below, one of the fifteen targets that are positioned in a row at Edwards Air Force Base, in California.

Sometimes old aircraft have been placed near the target as part of the test.

Side note: Edwards also has the world’s largest compass rose, which is 0.76 of a mile in diameter (1.2 km). The other lines on Rogers Dry Lake are runway markings.

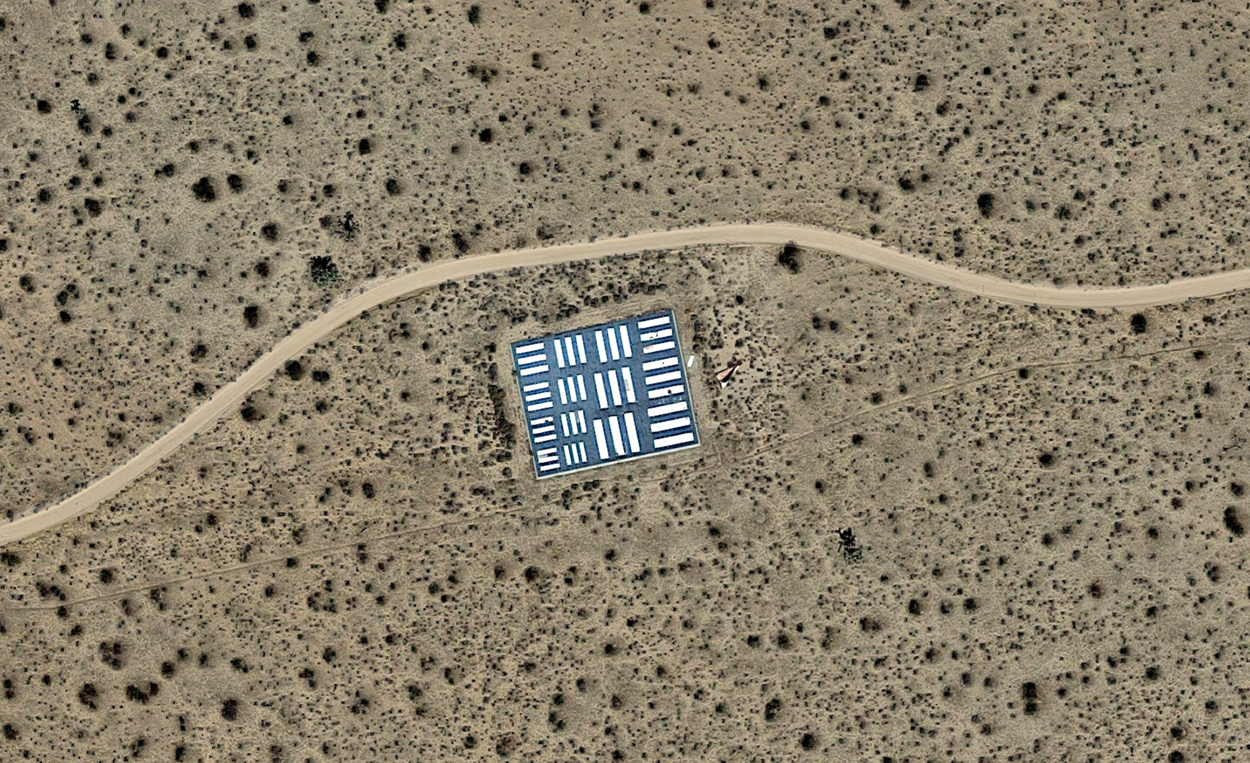
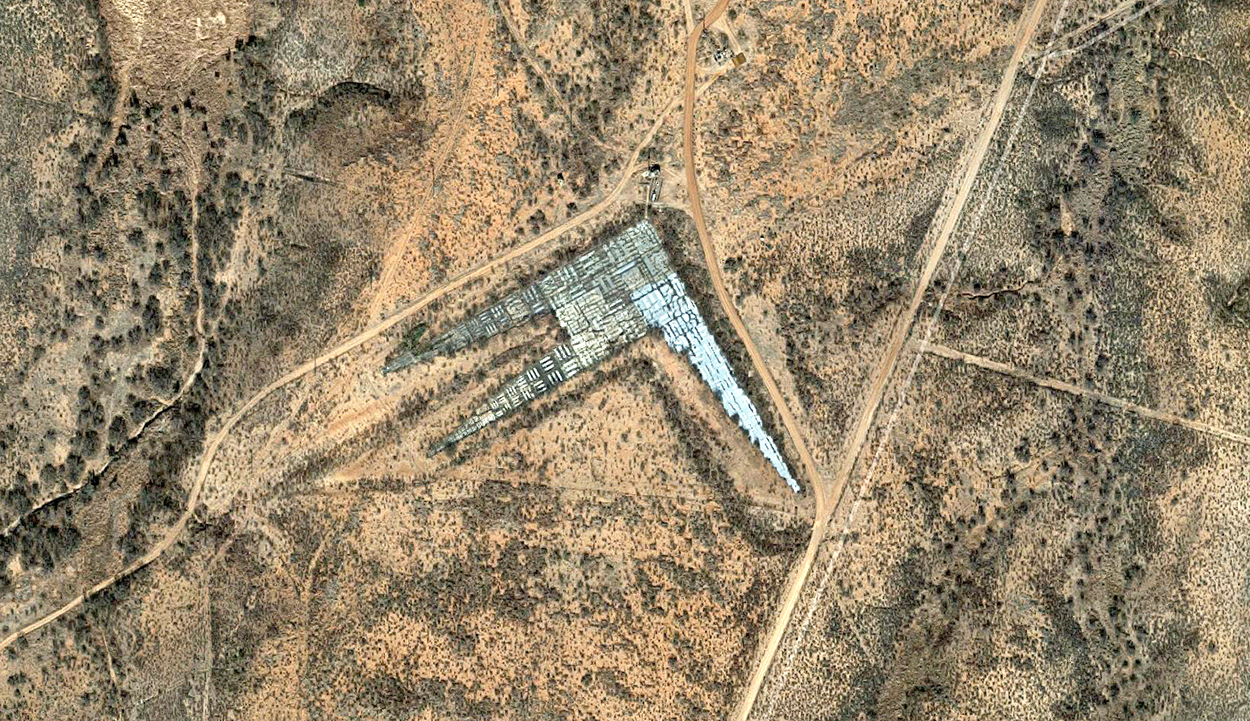
A calibration array at Fort Huachuca in Arizona.

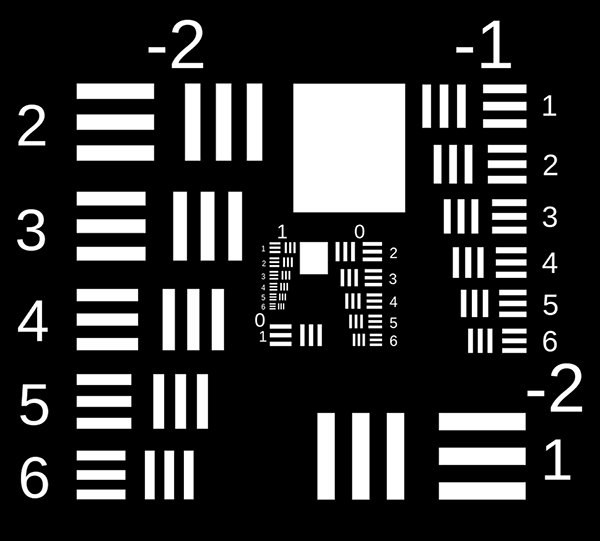
The U.S. targets are based on the 1951 U.S. Air Force Resolution test chart, which is still widely used today to calibrate optical instruments like microscopes, cameras and scanners.

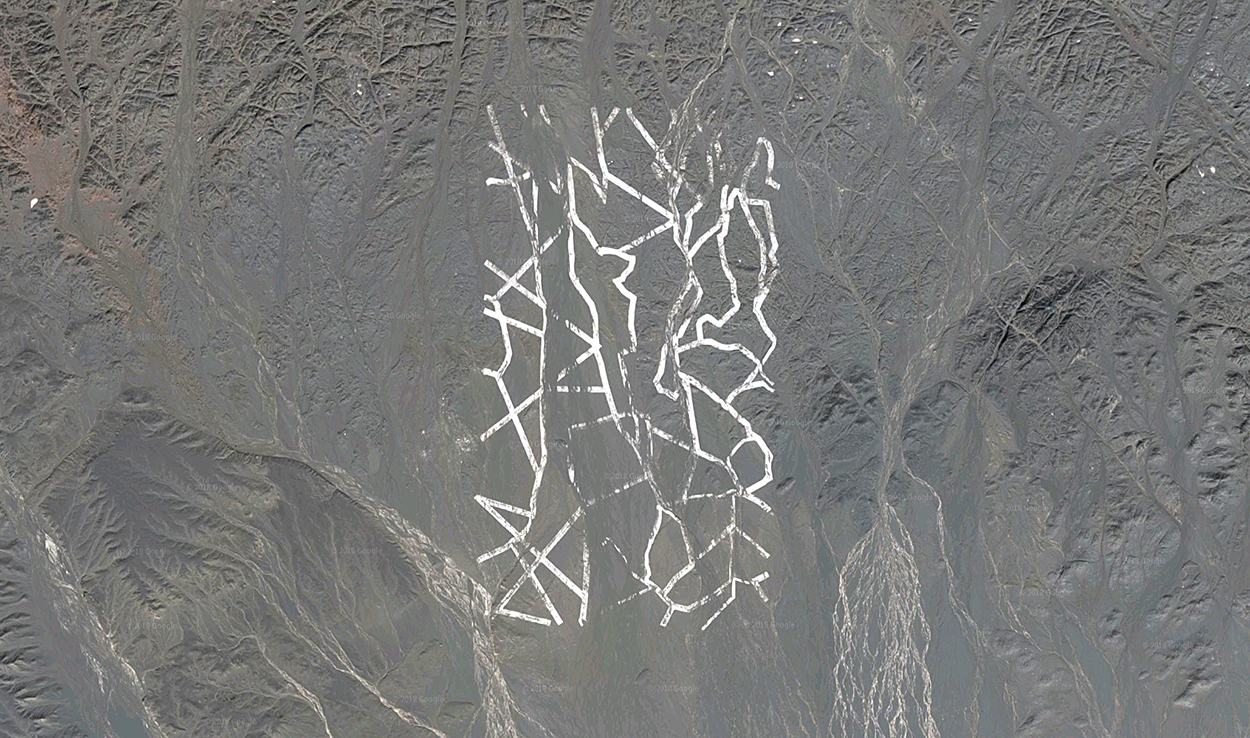
This area of 65-feet-wide (20-meter) reflective lines, in the Gobi Desert, is probably used to adjust the sensors of Chinese spy satellites.

Crosses
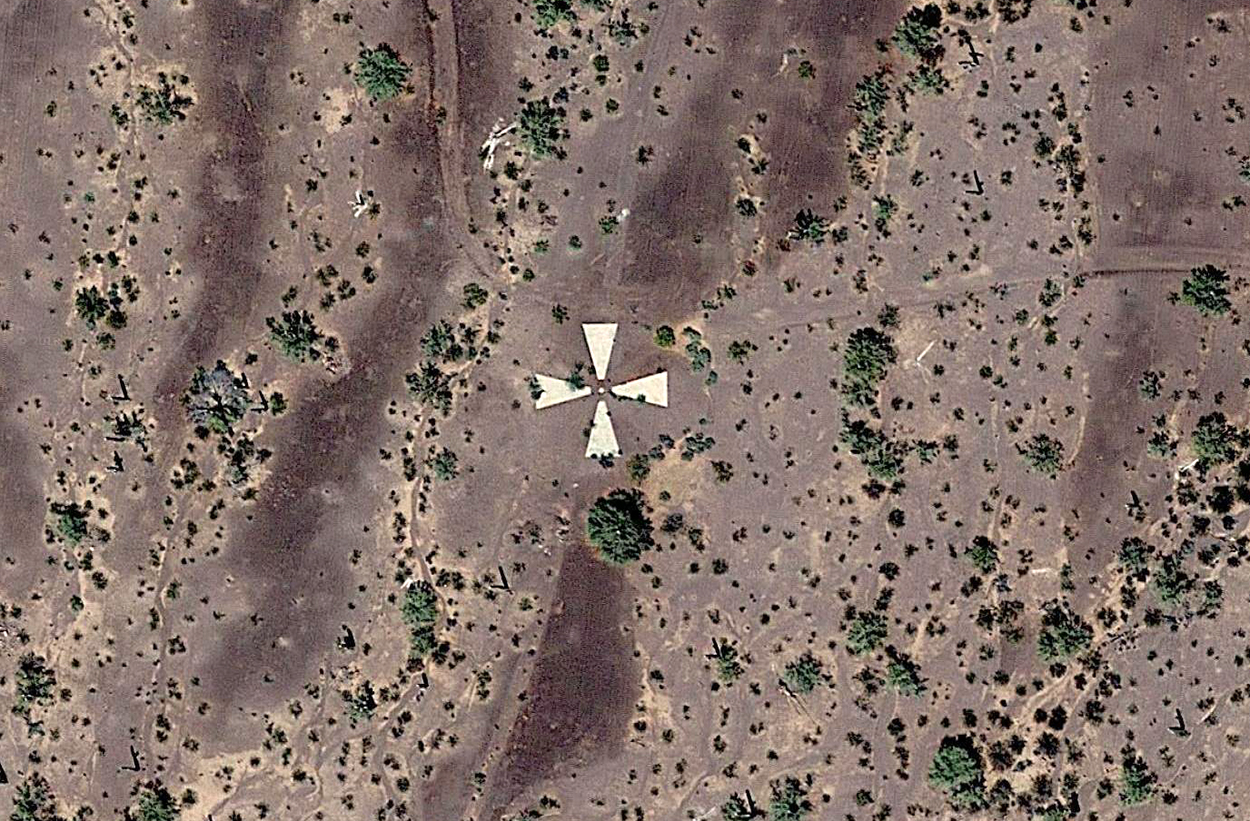
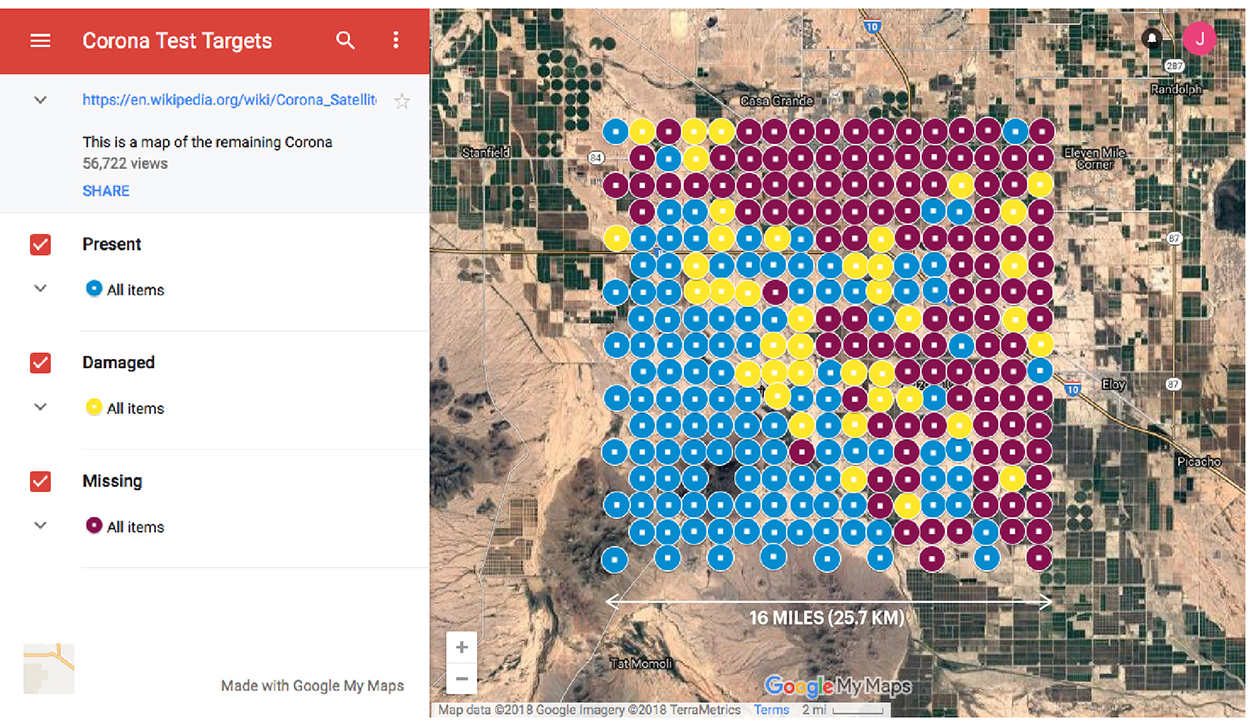
272 concrete Maltese crosses were constructed near Tucson, Arizona to help calibrate the cameras on the Corona spy satellites of the 1960s. They form a 16 x16-mile (25.7 km) grid, about a mile (1.6 km) apart. Each cross measures 60 x 60 feet (18.3 meters).


All satellite images: Google Maps.

More than half of these cold-war relics are still in place. The others have been overtaken by development.

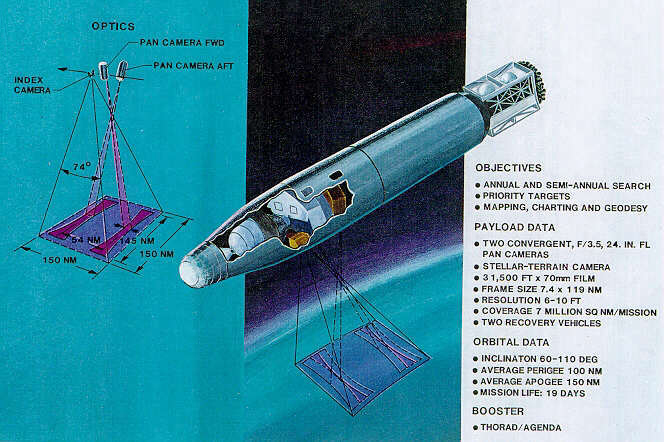
A KH-4B Corona satellite. The film was dropped back to Earth in a capsule which deployed parachutes after reentry, then was picked up by an aircraft as it descended, or retrieved from the sea by the U.S. Navy.

An image of the Pentagon taken by one of the satellites.

Worldwide
A set of geographic areas have been selected as being optimal for satellite sensor calibration.
https://calval.cr.usgs.gov/rst-resources/sites_catalog/

Some examples of the sites.

Crossing the street

VISUAL AIDS FOR PEDESTRIANS (AND DRIVERS).

Icelandic illusion
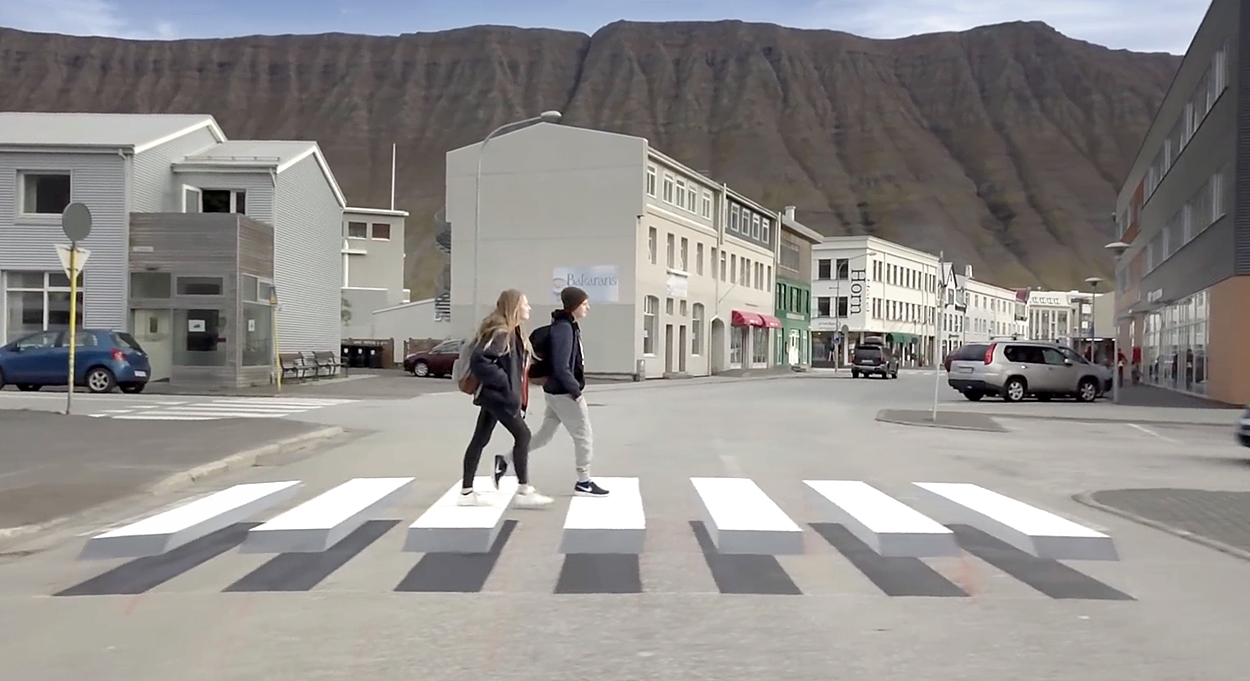
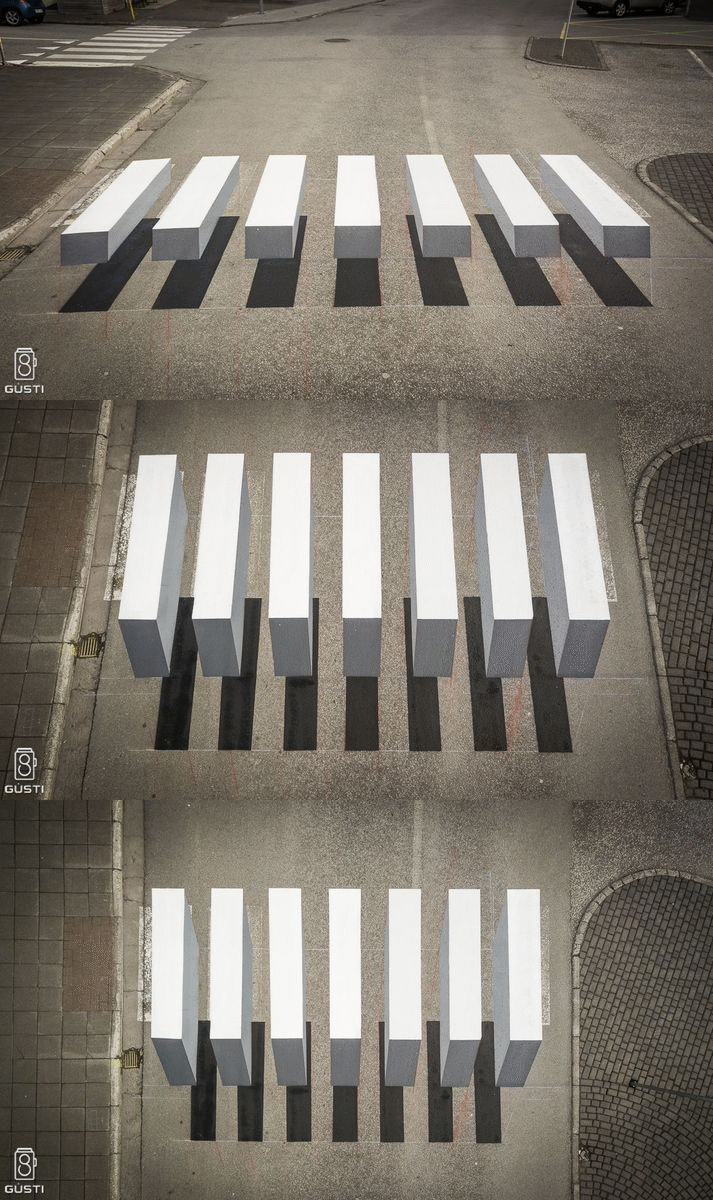
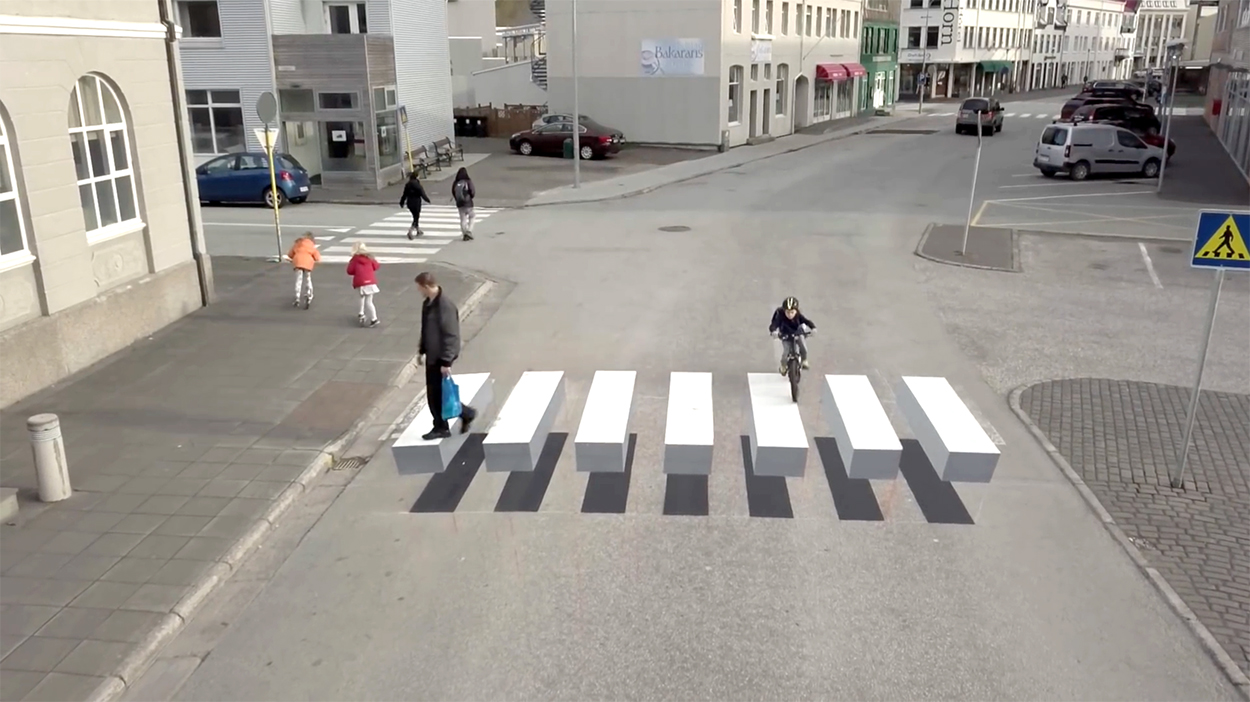
Ísafjörður, a town in Iceland, has an optical illusion zebra crossing that surely slows down the traffic. It was inspired by a similar idea seen in Delhi, and there are now versions in various countries.

A video of the crossing in action: https://bit.ly/2Kqqq9

Images and video © Gústi Productions.
Warning lights
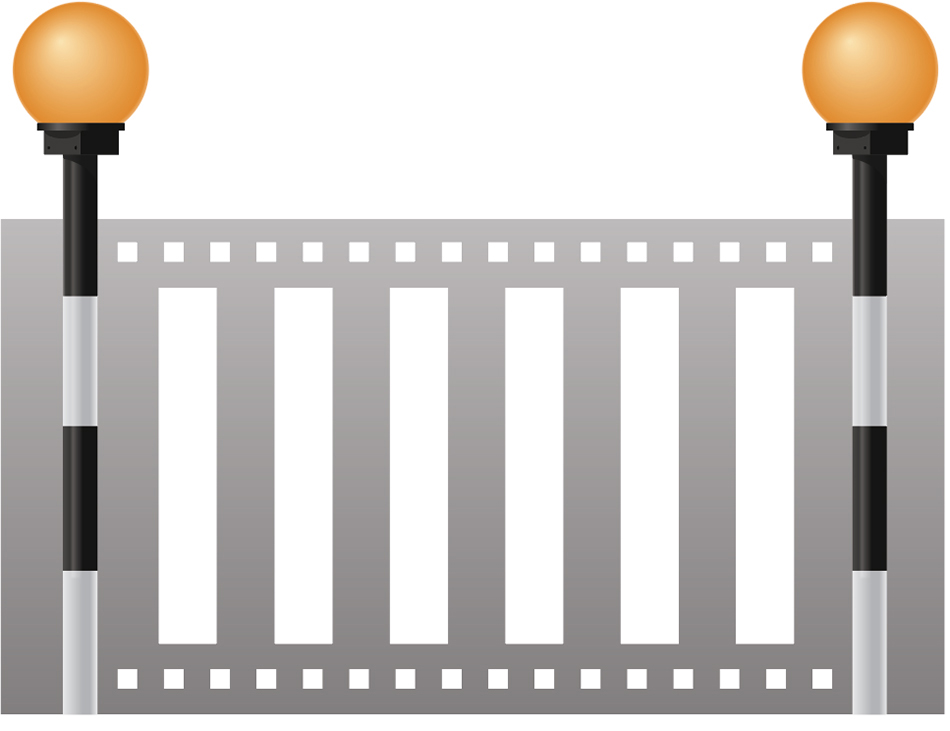
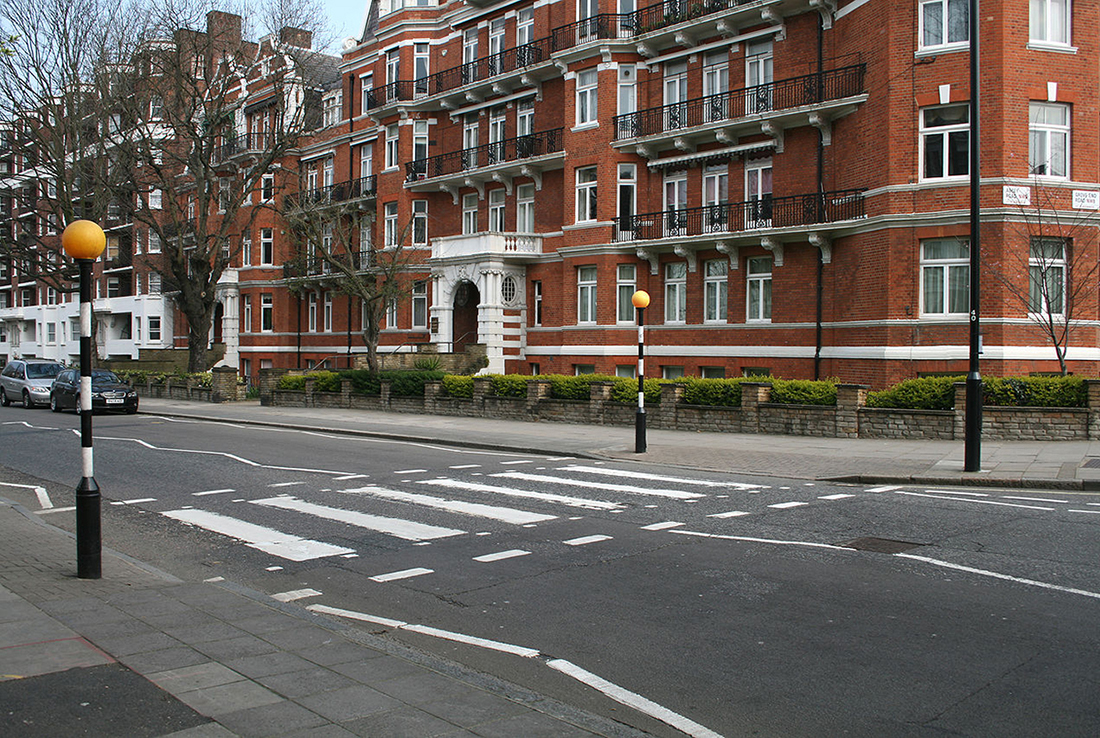
Belisha beacons are named after Leslie Hore-Belisha, who was the U.K’s Minister of Transport in 1934, when they were introduced. Seen everywhere in the United Kingdom and Ireland (and some other countries), the flashing yellow globes alert drivers to the presence of a pedestrian “zebra” crossing.

Album art
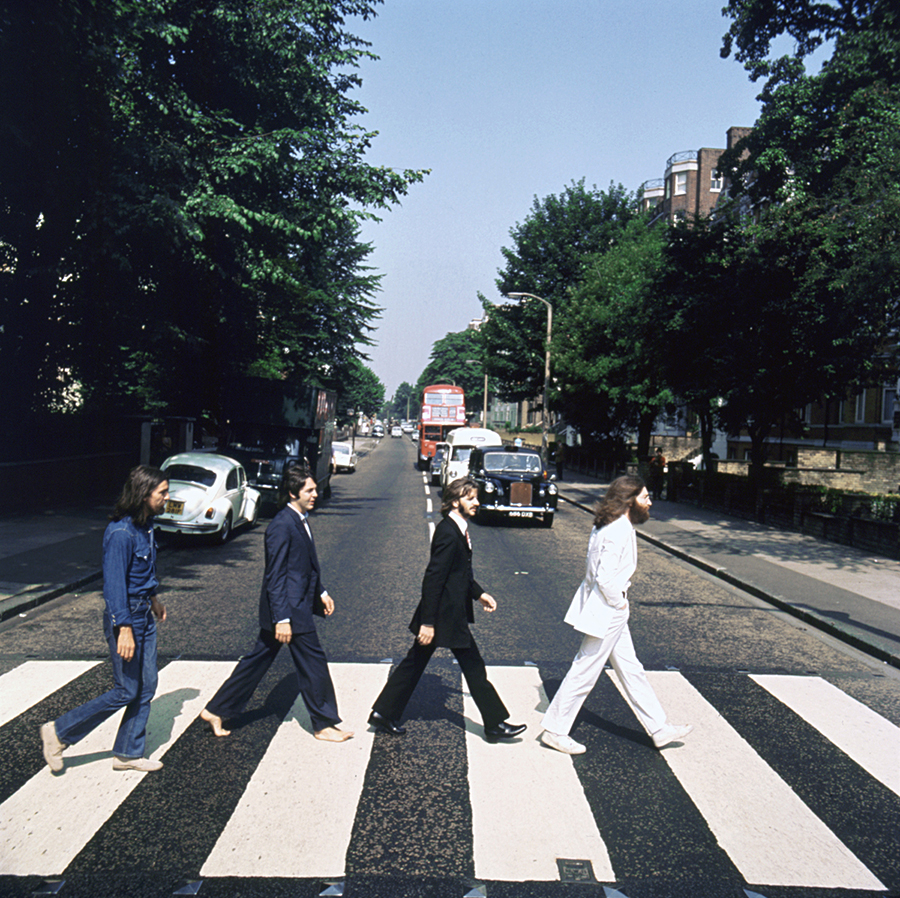
The cover of the Beatles’ “Abbey Road” (1969) is probably the most famous zebra crossing image. The location is very popular with London tourists, and it has Belisha beacons. Of course.

The crossing now.


Photograph by Misterweiss.

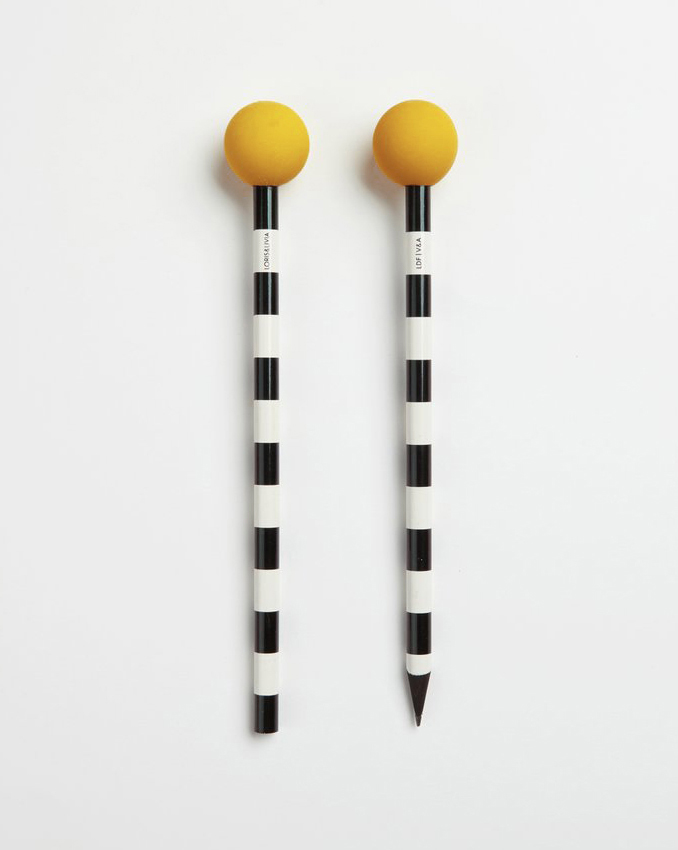
Belisha pencils could be useful for road safety note-taking. https://bit.ly/2NE5g9A

American crossings
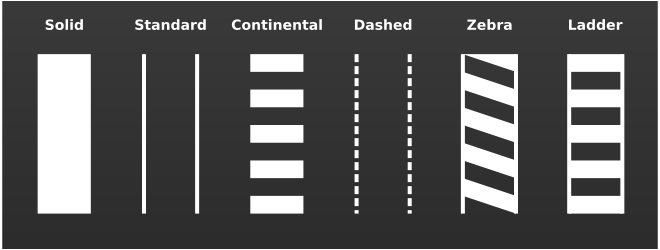
All these types of markings are used in the U.S.


Image by bdesham.

People pictograms
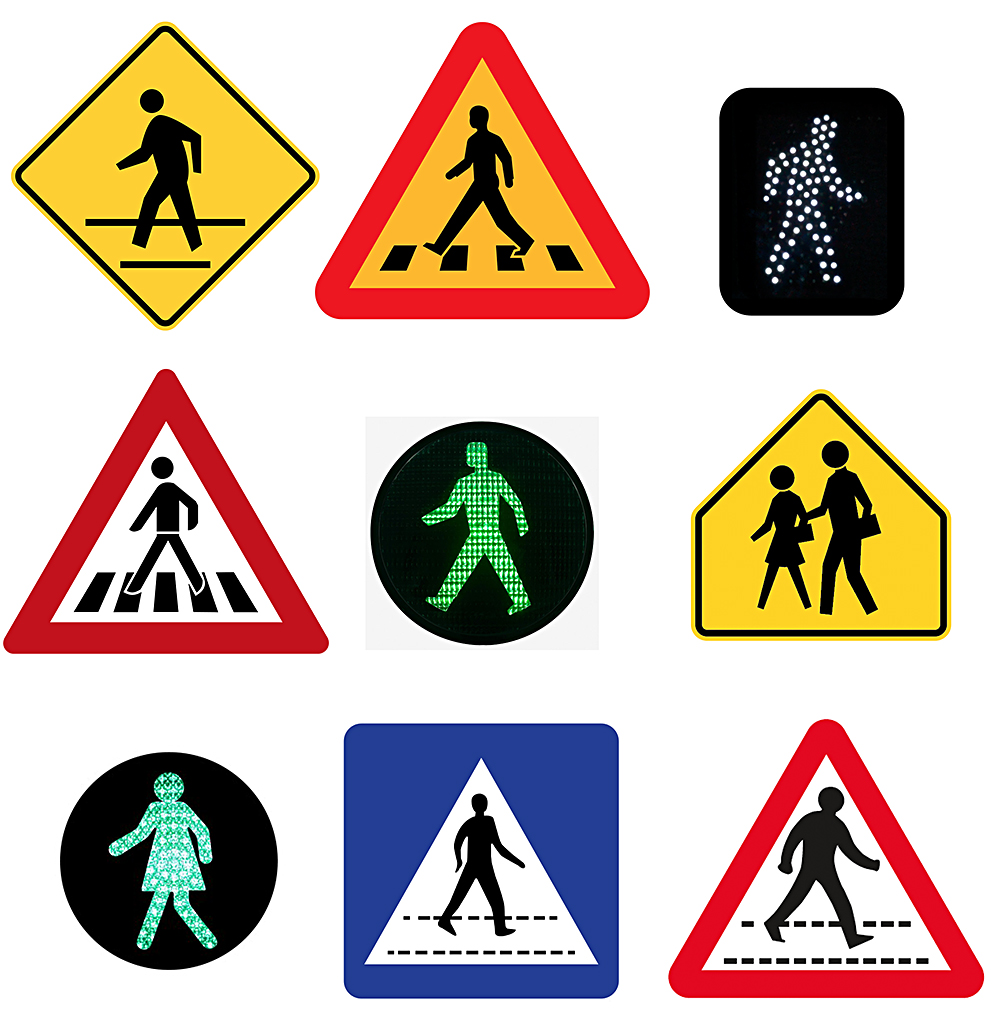
There are many variants of the walking person pictogram around the world. Some examples are shown below.

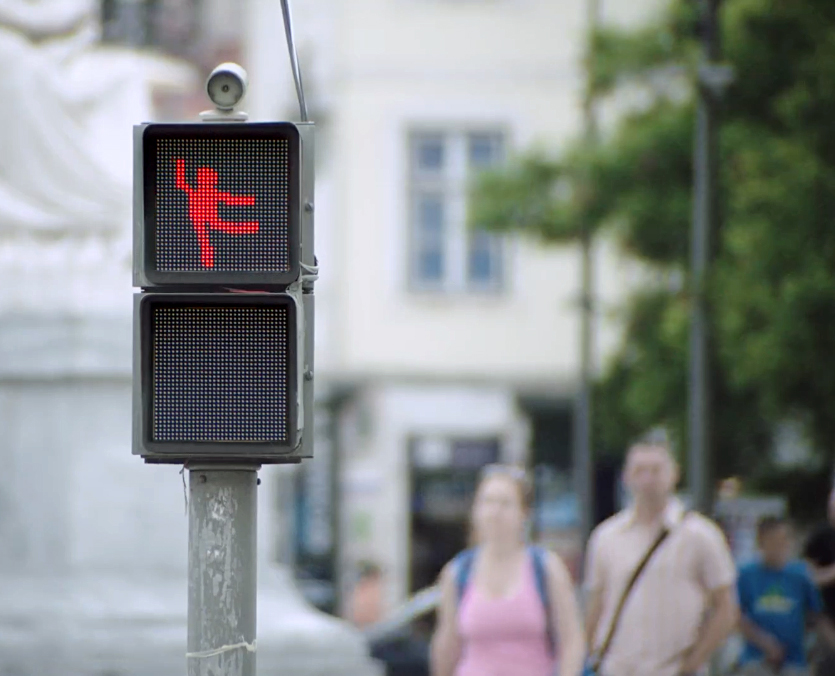
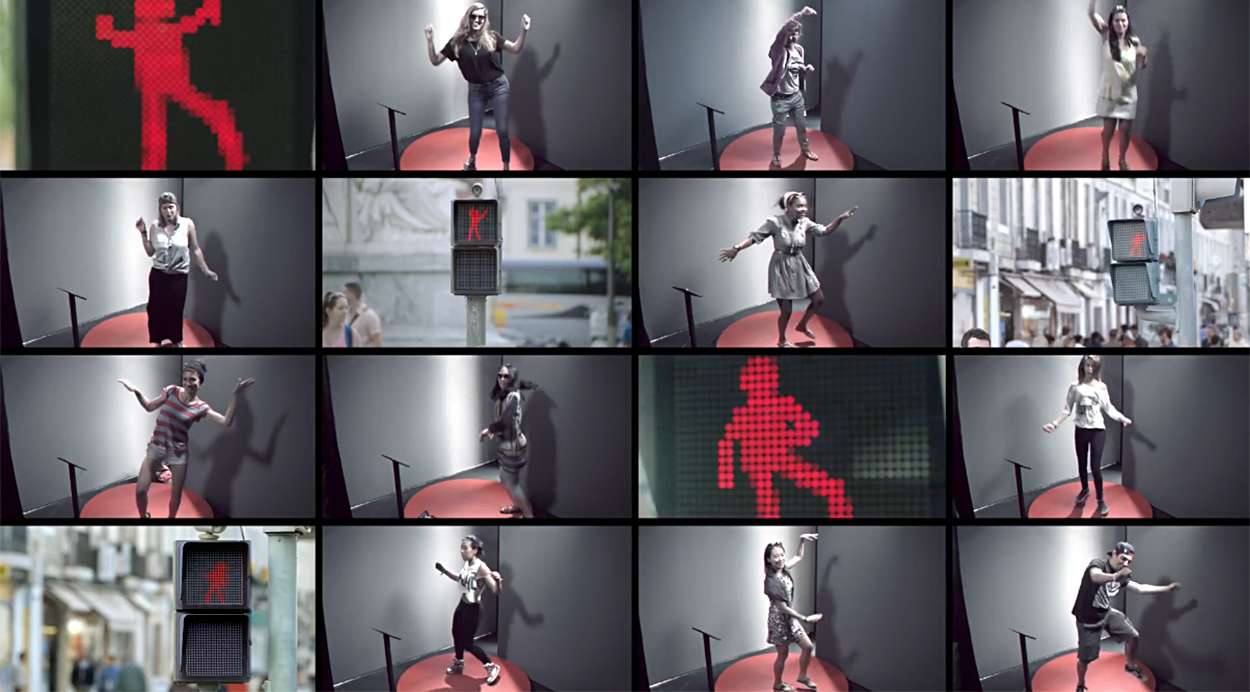
This dancing-pictogram installation attracted a lot of attention when it was installed in Lisbon (2014) by car-maker Smart. It dramatically improved safety by drawing attention to the stop symbol, and keeping people interested until the green icon appeared.
Video: https://bit.ly/1sOO7JG

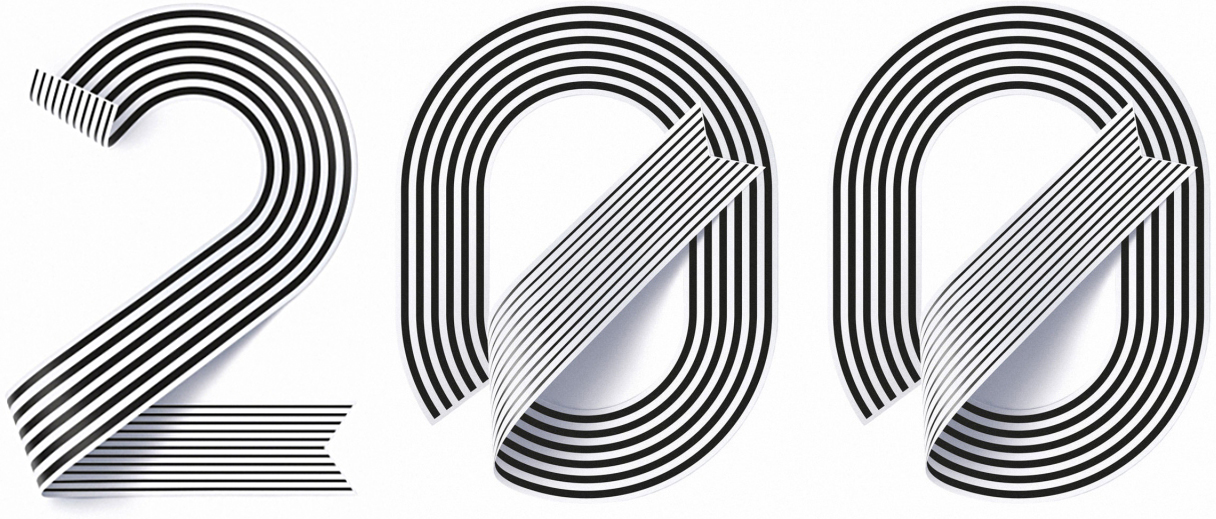
Two hundred

THIS BLOG, SO FAR.

This is my 200th post, so I’m in a reflective mood. For nearly two years, I have held forth, but it’s only one viewpoint.
That’s all. And no more important than anyone else’s.
Typeface by Sawdust: http://www.madebysawdust.co.uk

As this is a milestone of such super-high importance to mankind, it’s time to examine the WordPress data. (As of July 22.)

TOTAL VIEWS: 62,340

TOP TEN BY VIEWS
I’ve left out these two from the list.
Home page: 18,598 (Obviously, this could be divided up amongst all the posts.)
About me: 1,596 (For anyone remotely interested.)

1. Tools of the trade: 3,443  https://wp.me/p7LiLW-EI

2. Size comparison: 2,213  https://wp.me/p7LiLW-181

3. Notebooks: 1,519  https://wp.me/p7LiLW-2i0

4. Sketching infographics: 823  https://wp.me/p7LiLW-14Q

5. The incredible Bollmann map workshop (Part 1): 682  https://wp.me/p7LiLW-Ak

6. Nigel Holmes on humor: 678  https://wp.me/p7LiLW-iZ

7. Archeological pictograms: 626  https://wp.me/p7LiLW-V0

8. Cutaway magic: 611 https://wp.me/p7LiLW-qF

9. Infographics made easy: 601  https://wp.me/p7LiLW-Ic

10. When infographic dinosaurs roamed the Earth: 580  https://wp.me/p7LiLW-h0

VIEWS: TOP FIVE COUNTRIES

USA: 21,292

UK: 4,718

Germany: 4,716

 Russia: 2,973

Spain: 2,631

GOING FORWARD
I’ve posted twice a week up to now, but I’ll only be posting occasionally in the future. Why? Here’s one reason: I took a look at my ideas page last week. I think it says it all.

Seriously, thank you all for following over the last two years. And for sending ideas and encouraging emails. I really appreciate it.

Deconstructed

INFORMATIONAL CROSS-SECTIONS.

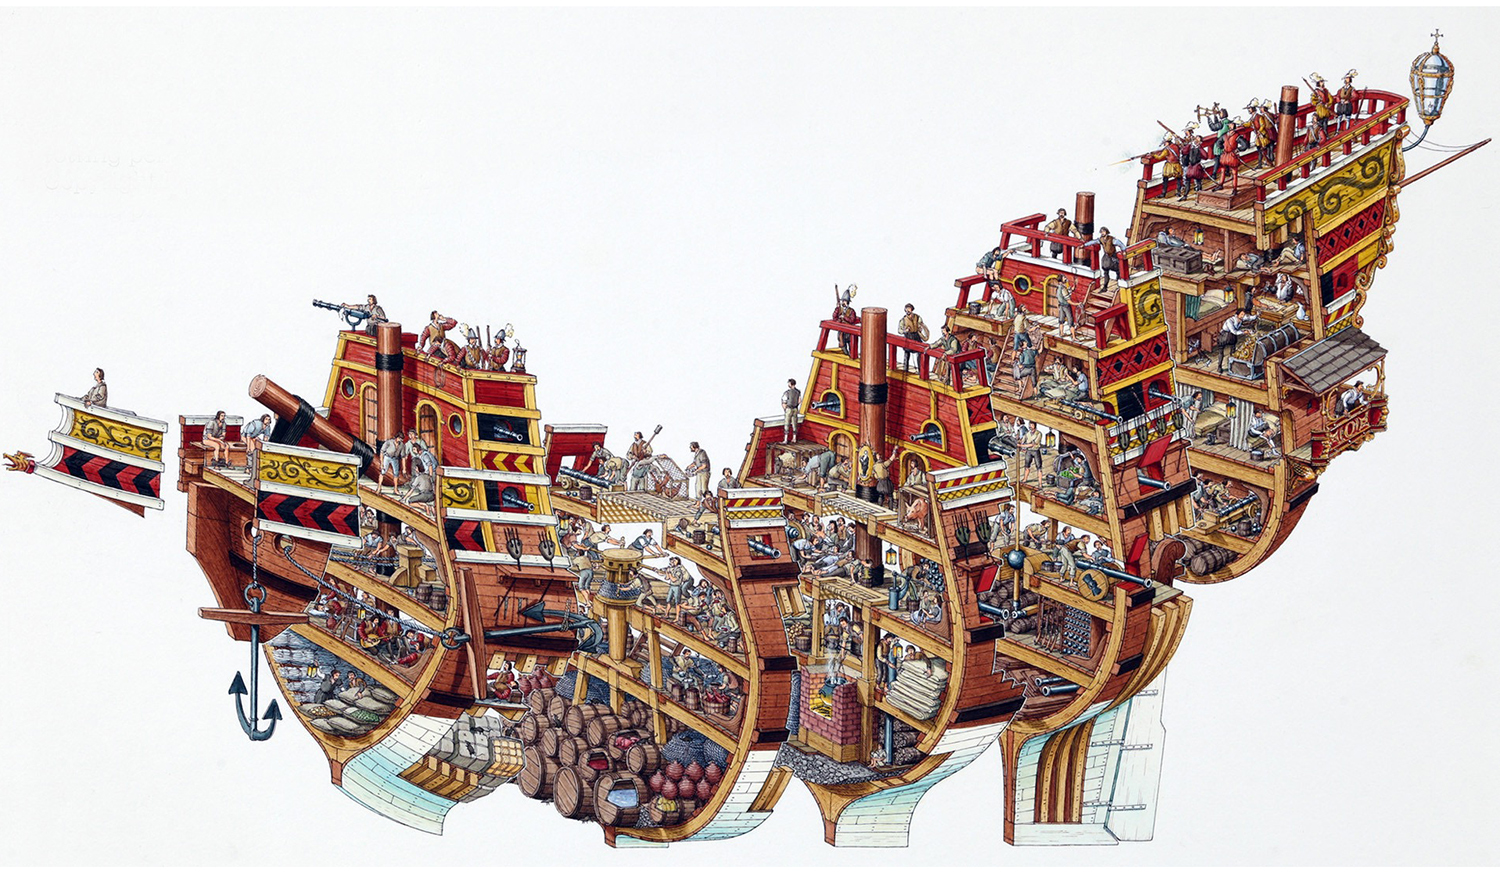
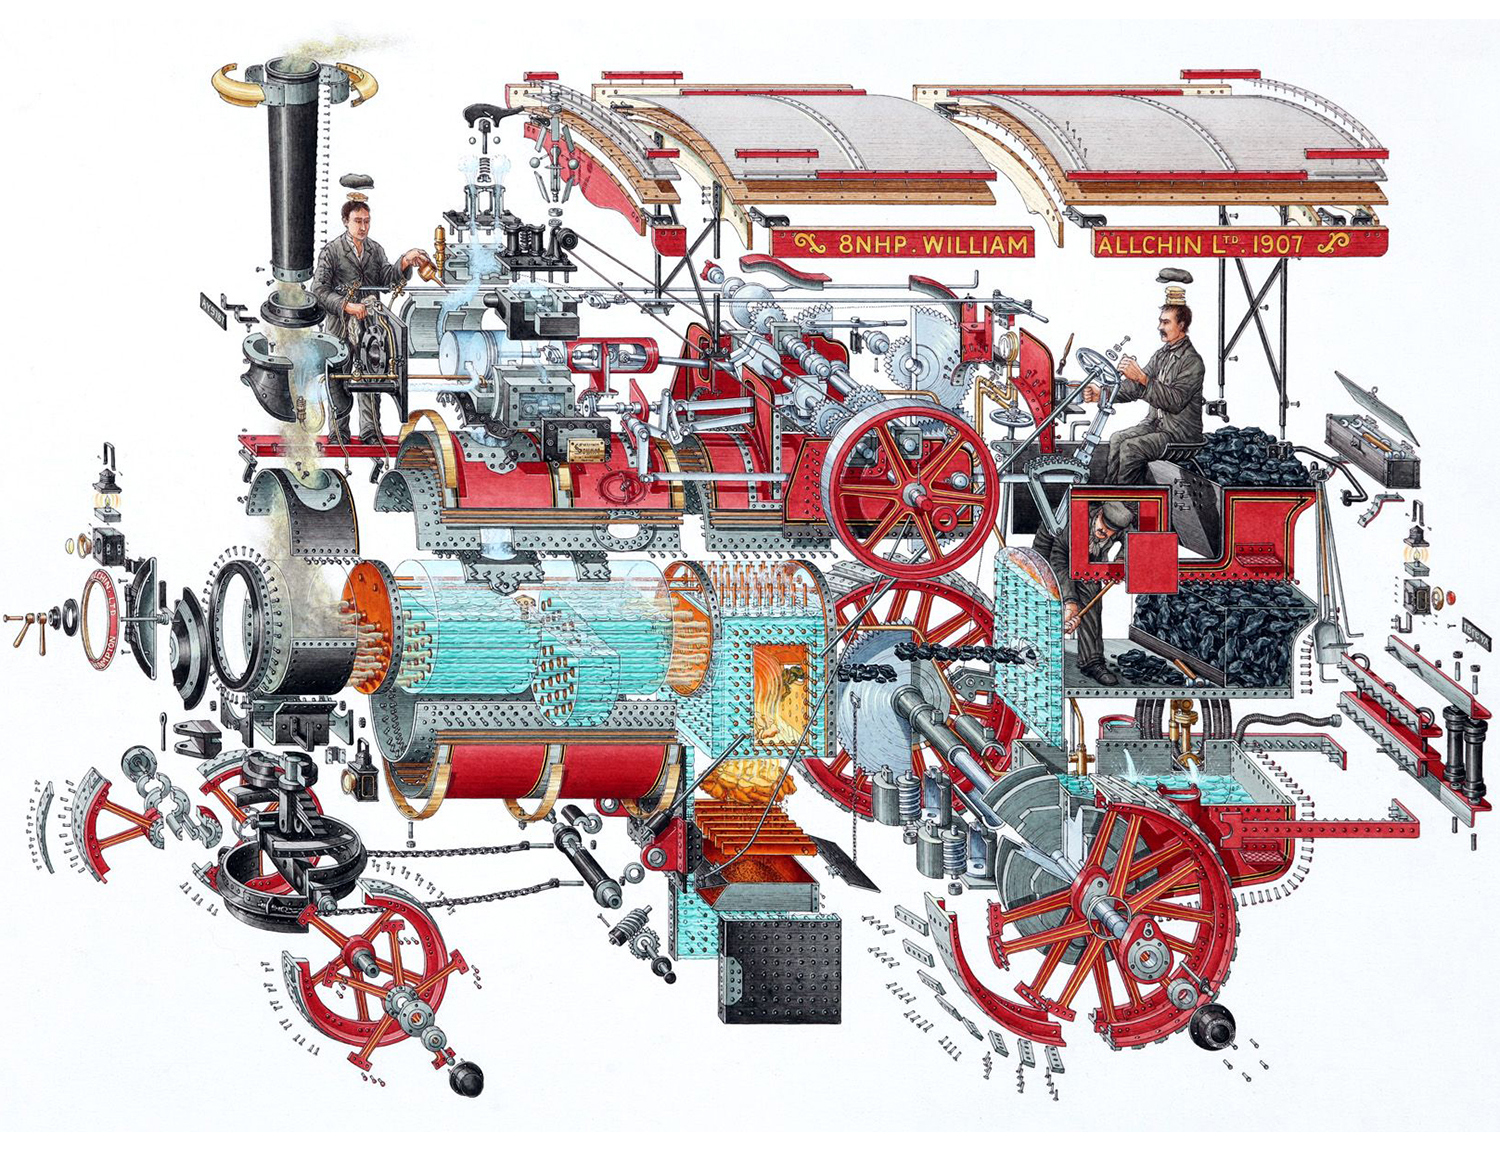
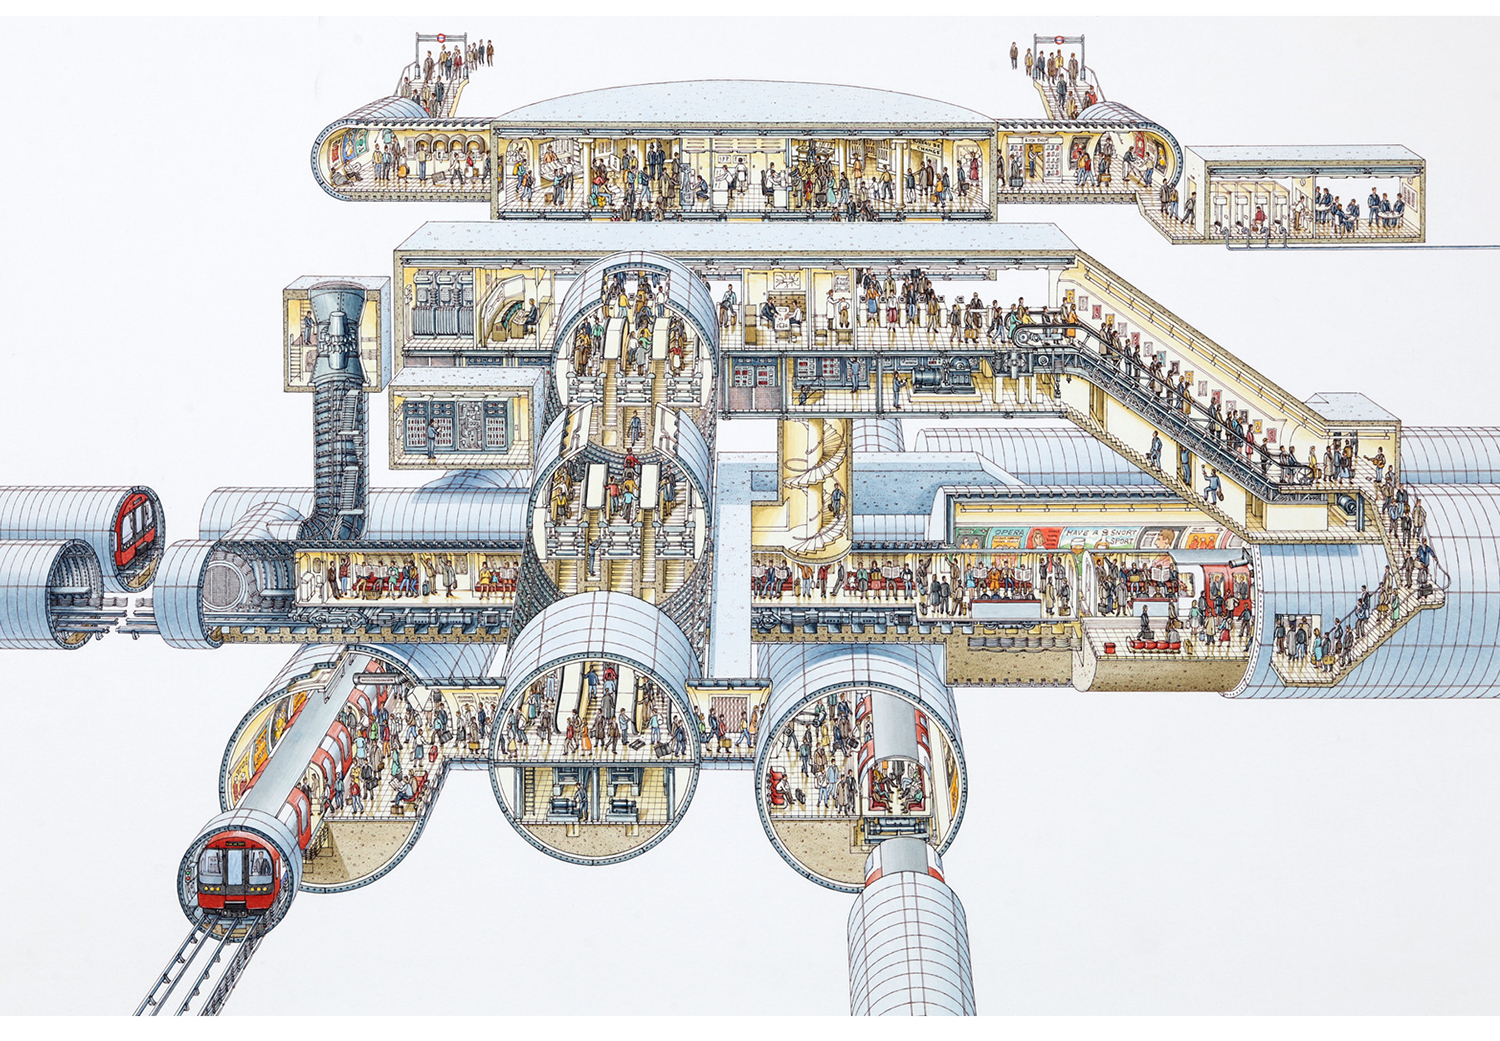
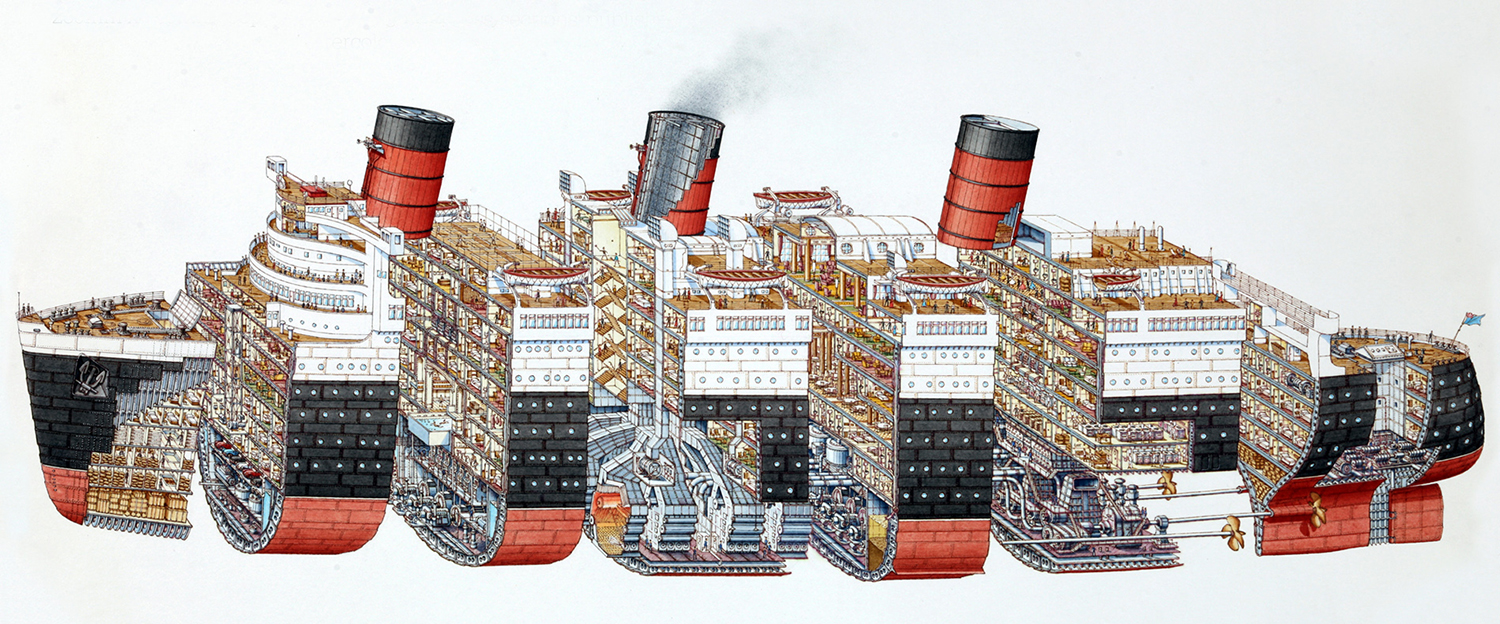
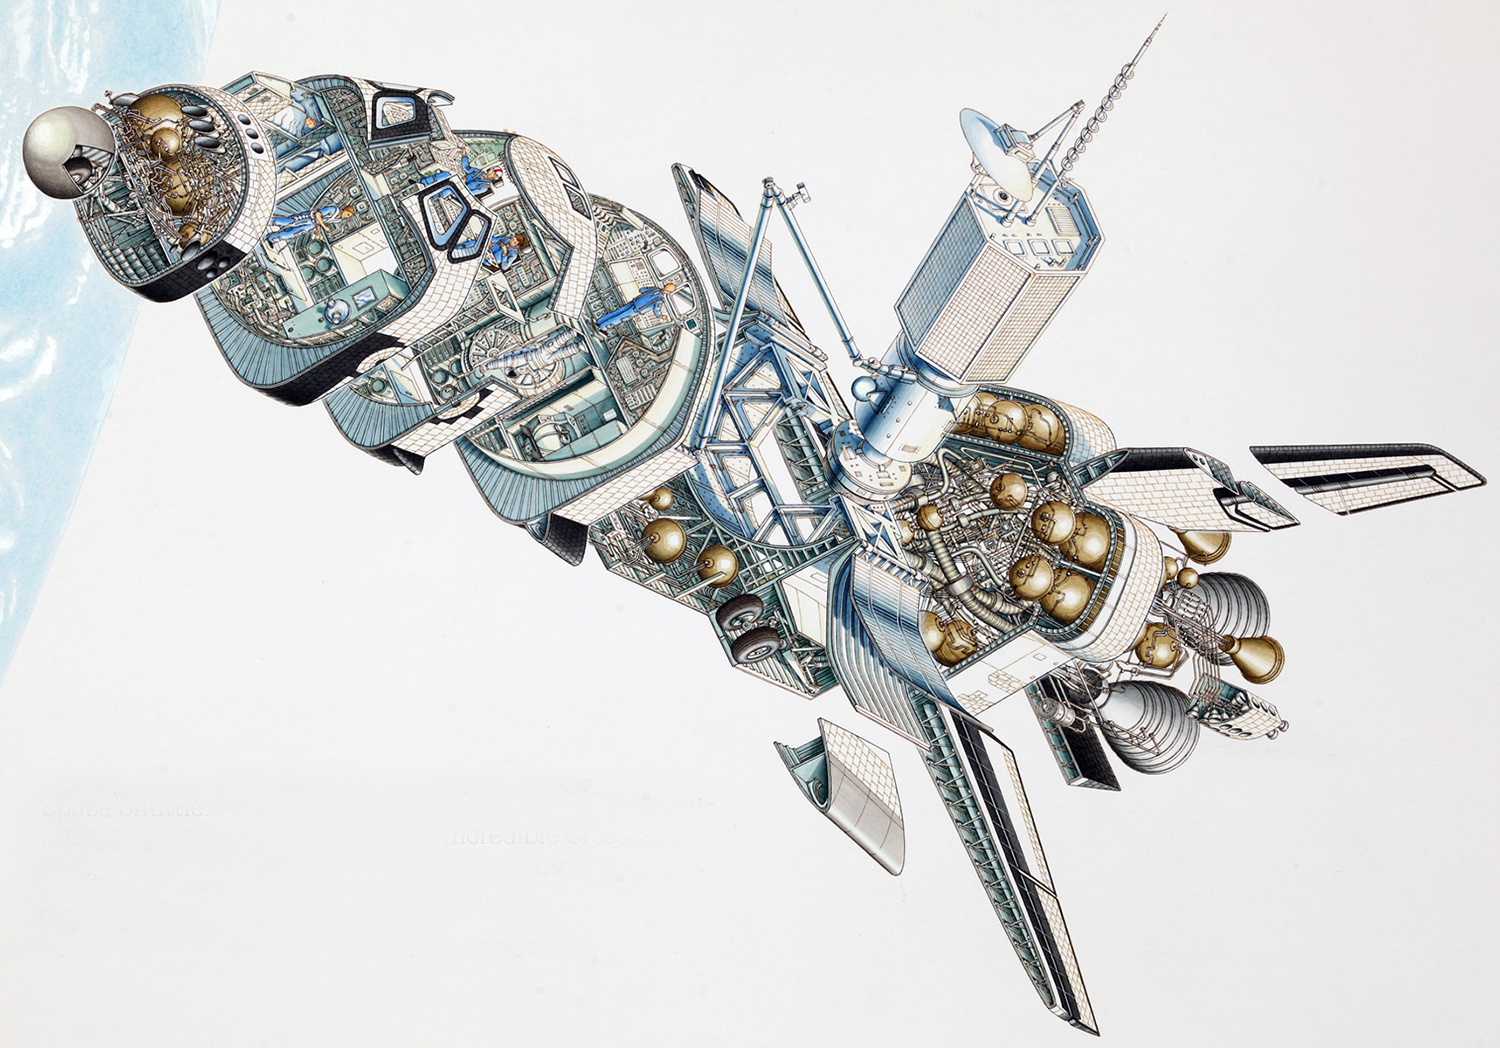
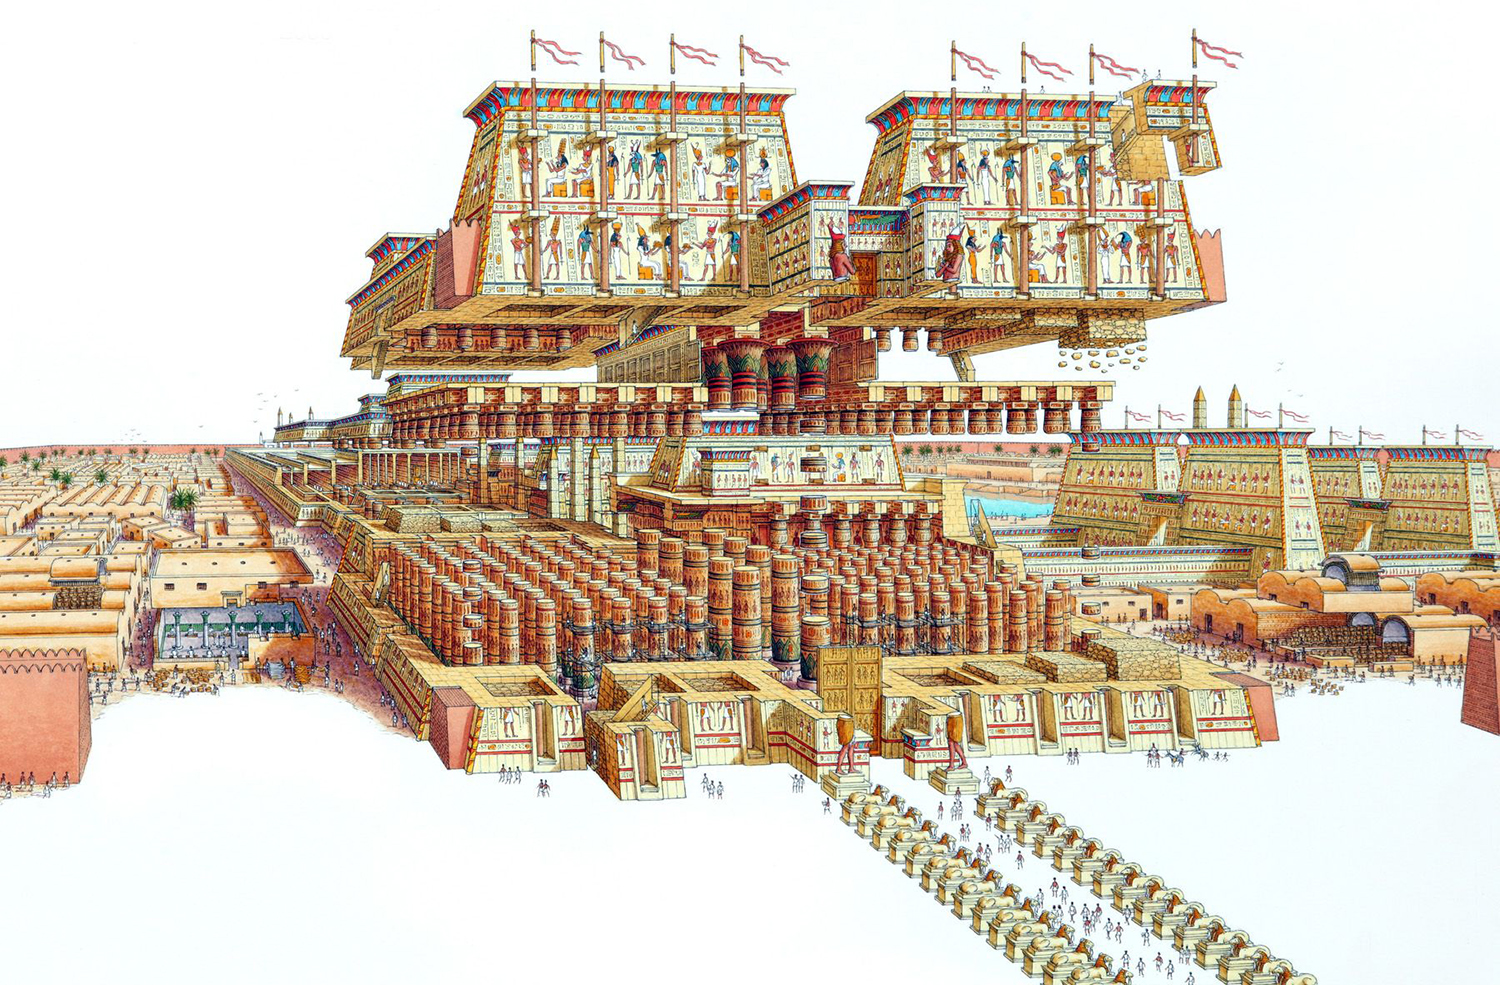
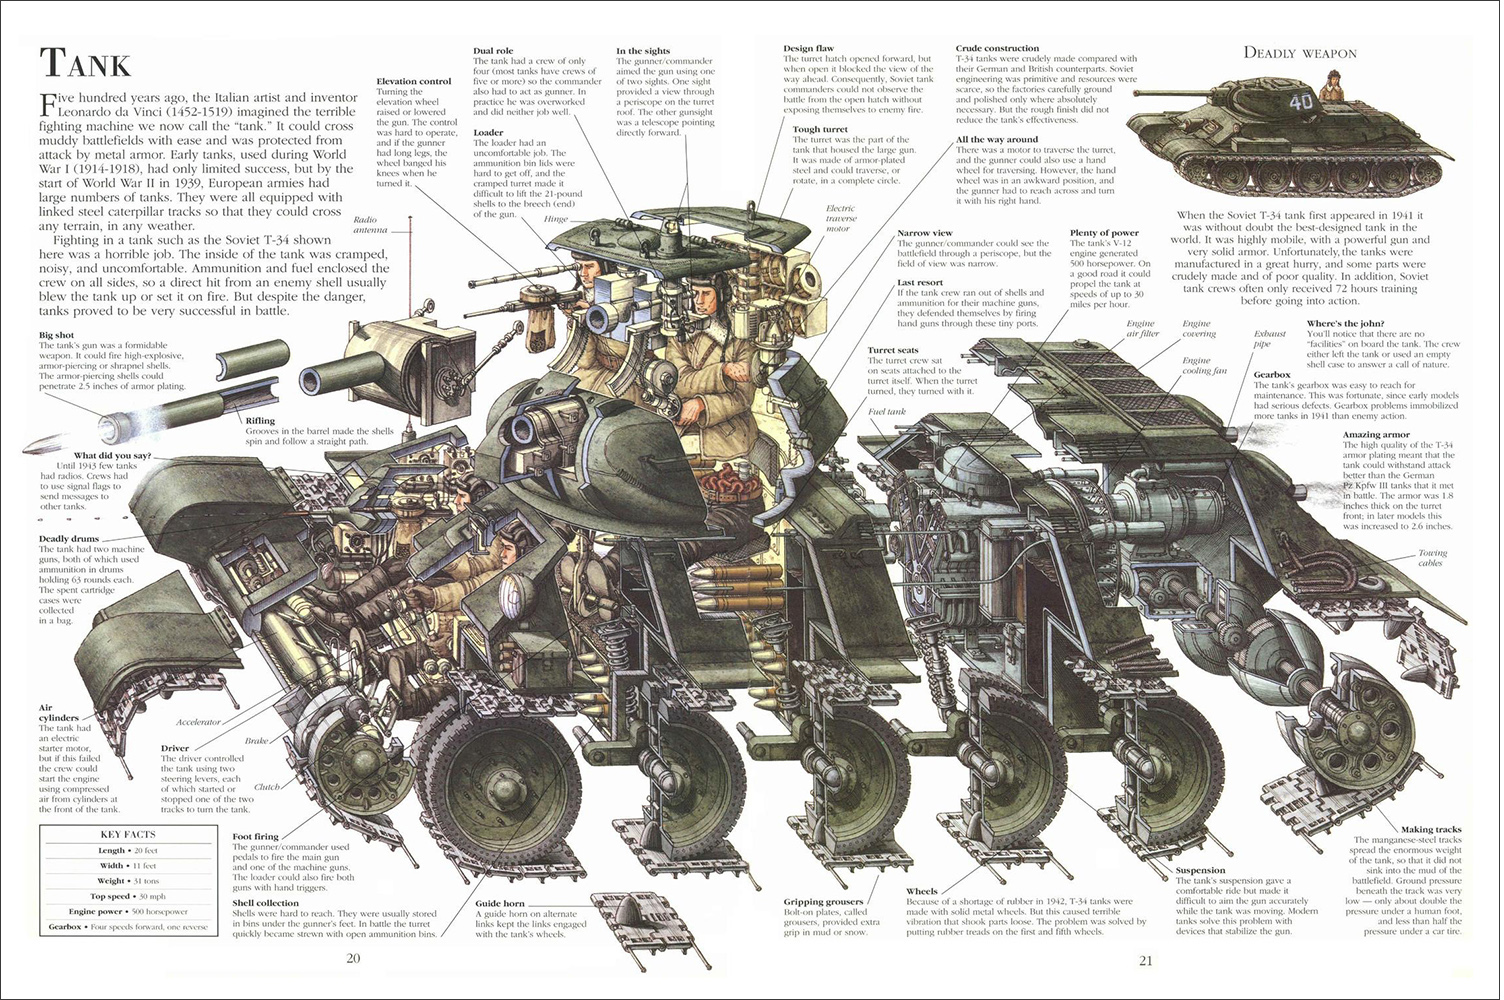
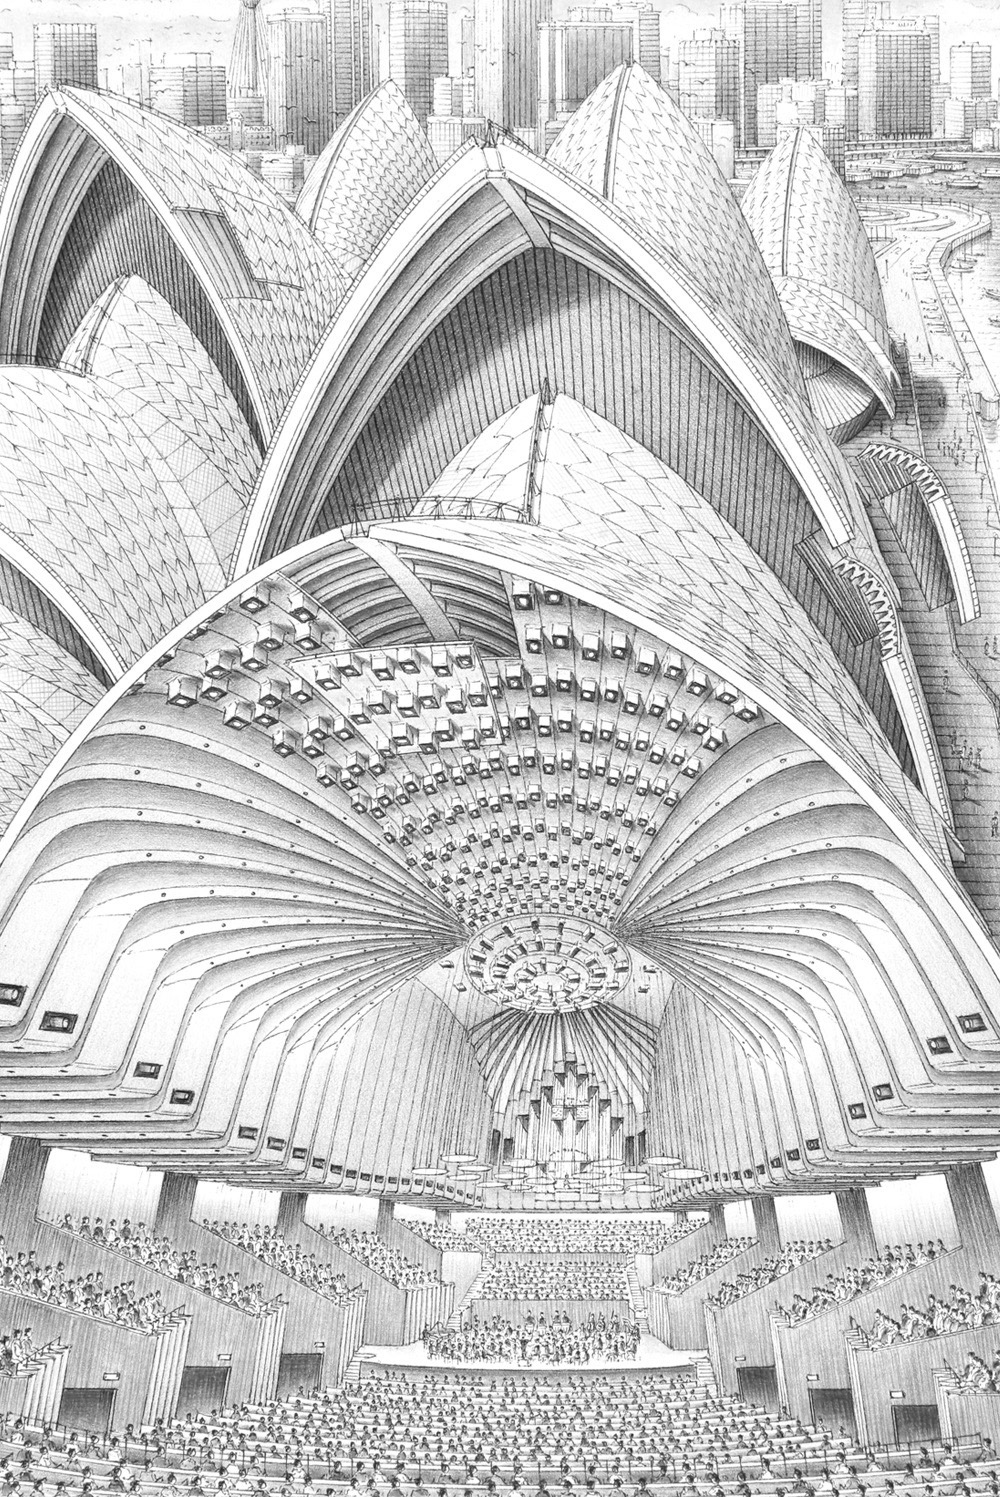
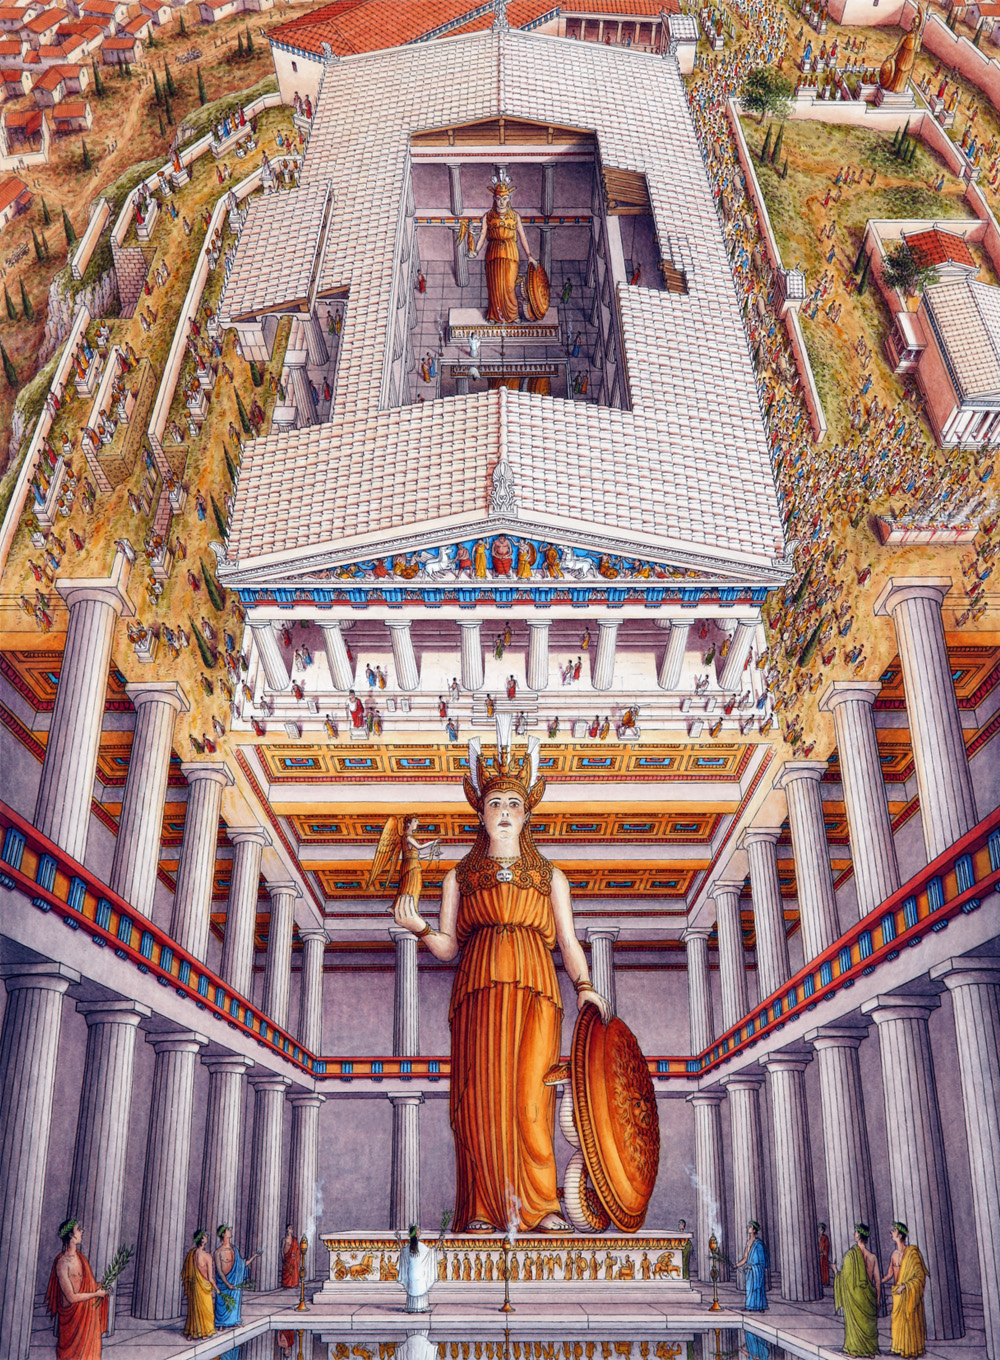
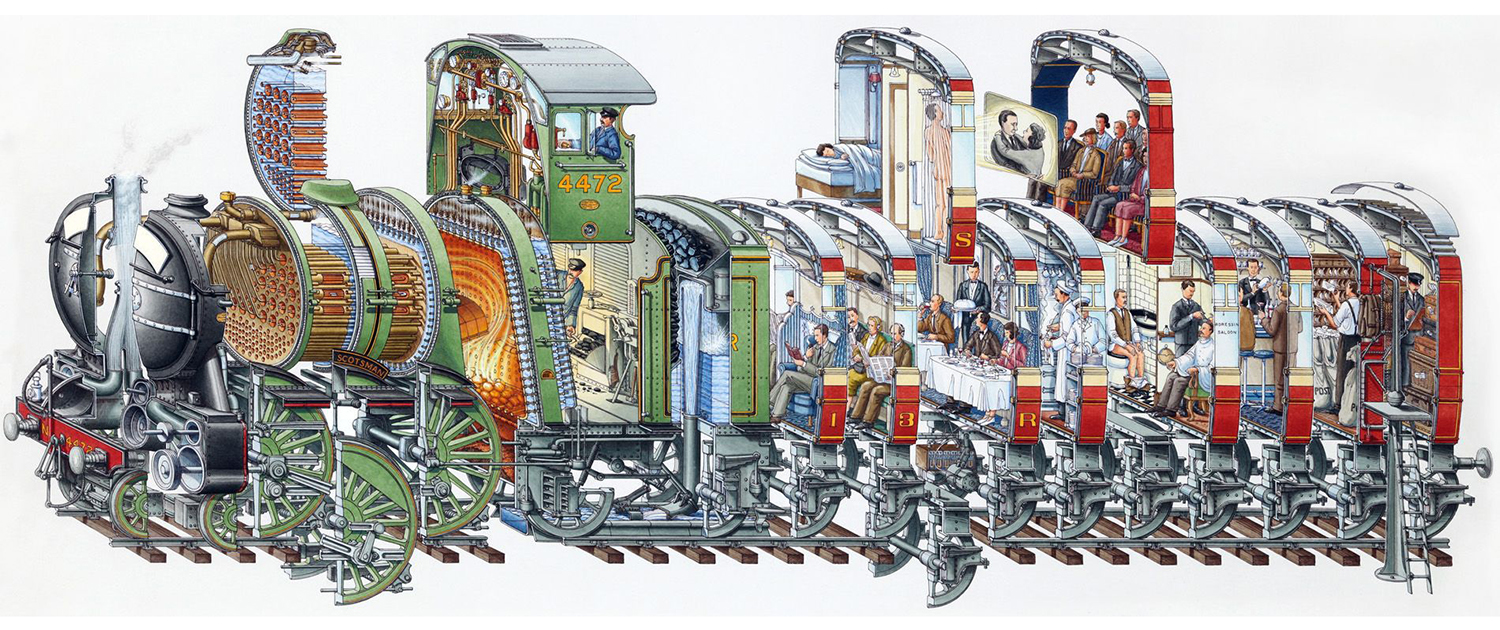
Stephen Biesty reveals the hidden workings of everyday items. His book “Incredible Cross-Sections” has millions of copies worldwide, and a new edition is coming soon. Stephen creates these highly-detailed explanations in the traditional way (with pencils, pens and watercolor paint), after a lot of research and checking. To get an idea of the level of detail, click on the image above for a larger version.
Or click here: https://bit.ly/2NvnJ9f


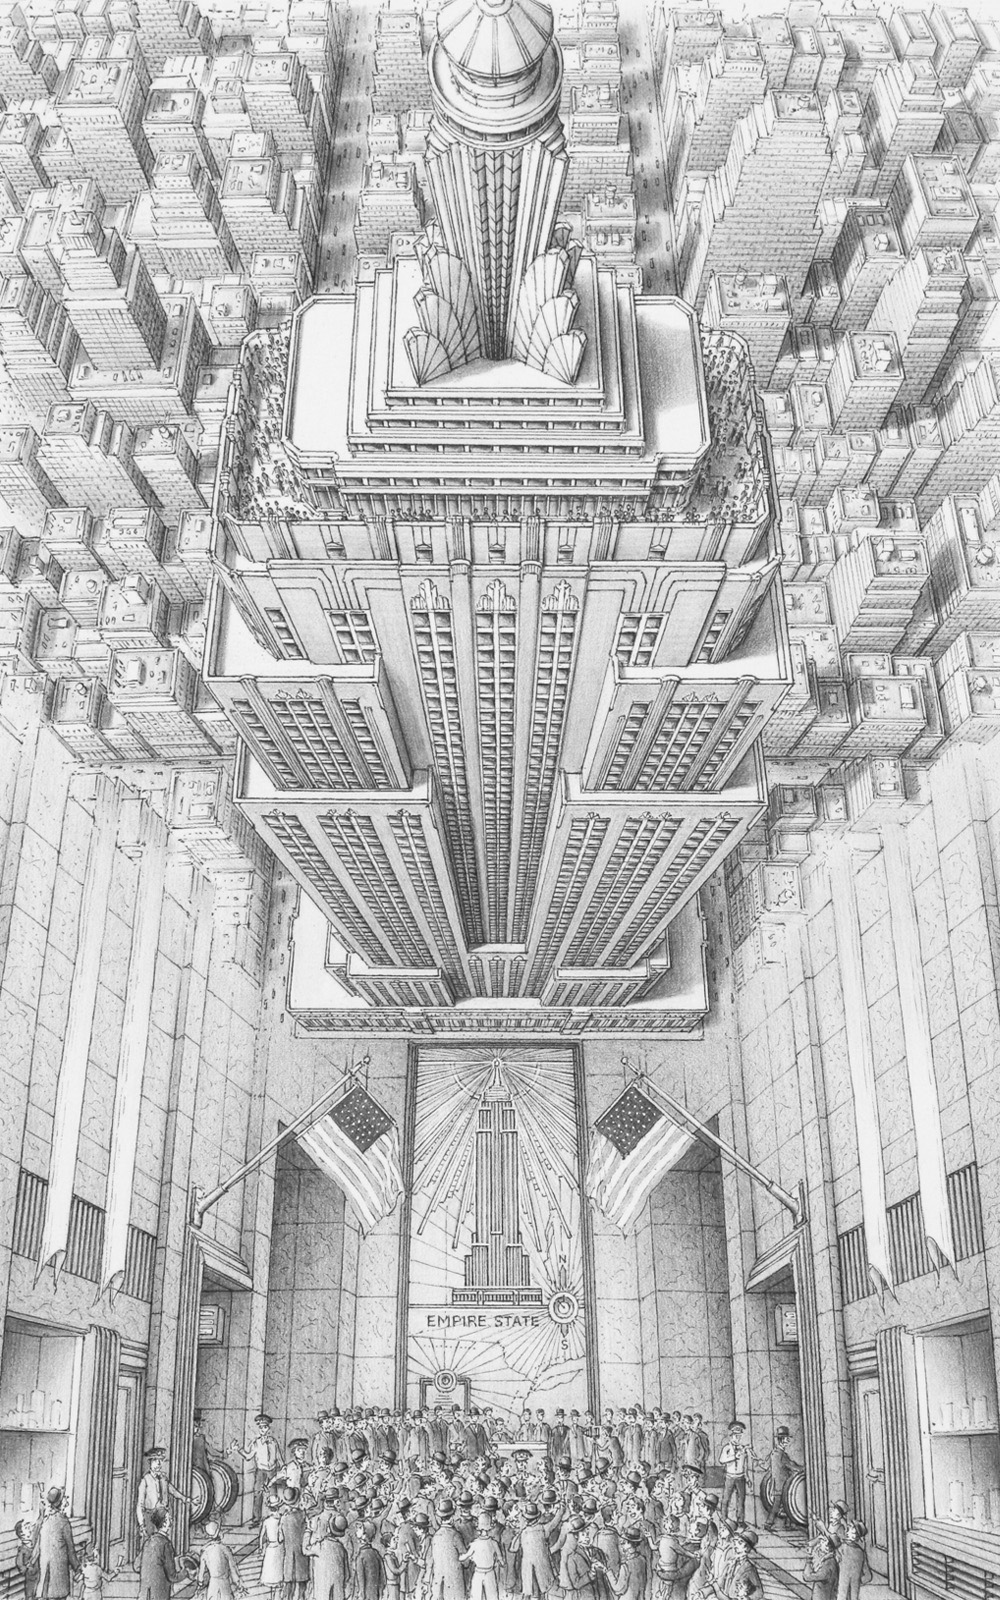
“Inside-out” views. Below, the Empire State Building.

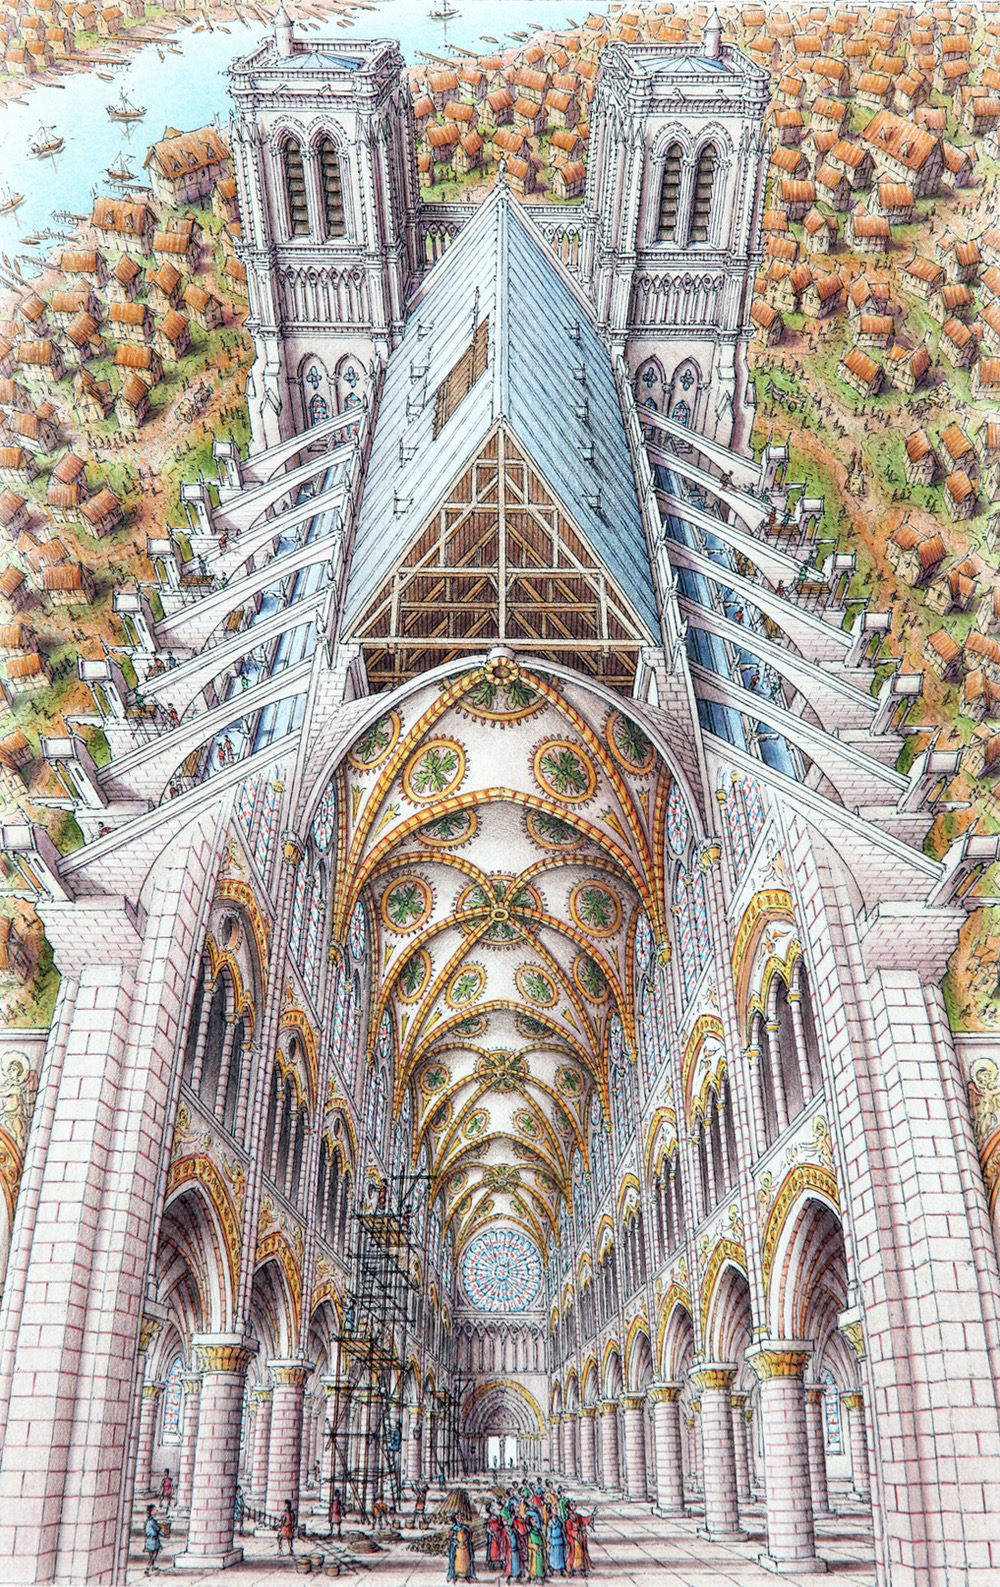
Notre Dame.

The Sydney Opera House.

The Parthenon.

See more: http://www.stephenbiesty.co.uk

One of Stephen’s influences is L.Ashwell Wood. See some of his work here: https://wp.me/p7LiLW-Bb

Icons for everything

THE NOUN PROJECT.

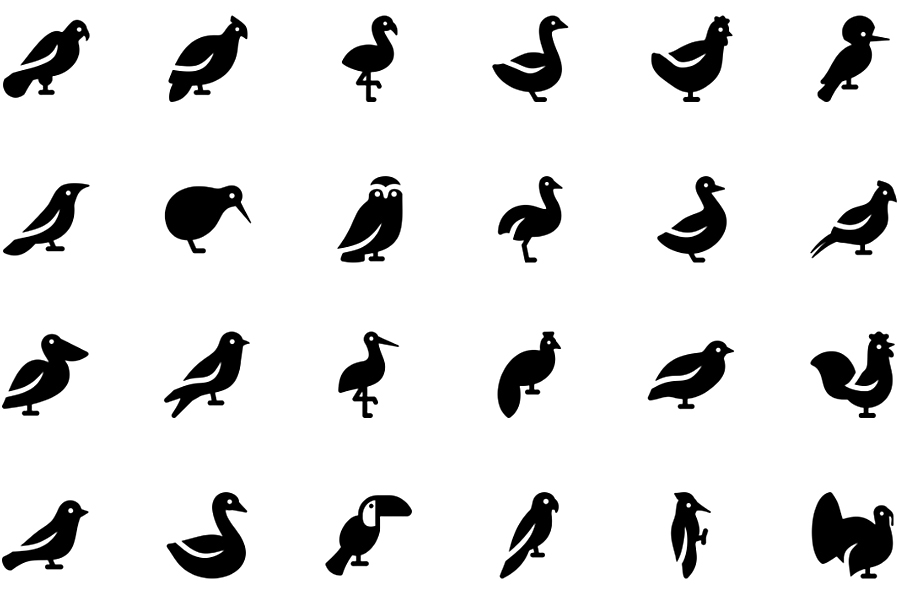
This is a pictogram-lover’s dream. A website with over one million icons, ready for use. thenounproject.com
Founded with a Kickstarter campaign in 2010, initially they posted public domain icons.
Below, The Noun Project logo.

Everyone has access to every icon. Free members need to give a credit to the designer, and paid members ($39.99 per year, or $9.99 per month) get unlimited royalty-free licenses. Below, are some example sets, but explore the collections yourself.

Raccoon Emoticons by AomAm.


Birds by Georgiana Ionescu.


Buildings by Made by Made.


People by Vectors Market.

The Noun Project blog: https://thenounproject.com/

Coat of arms

MEDIEVAL VISUAL COMMUNICATION.

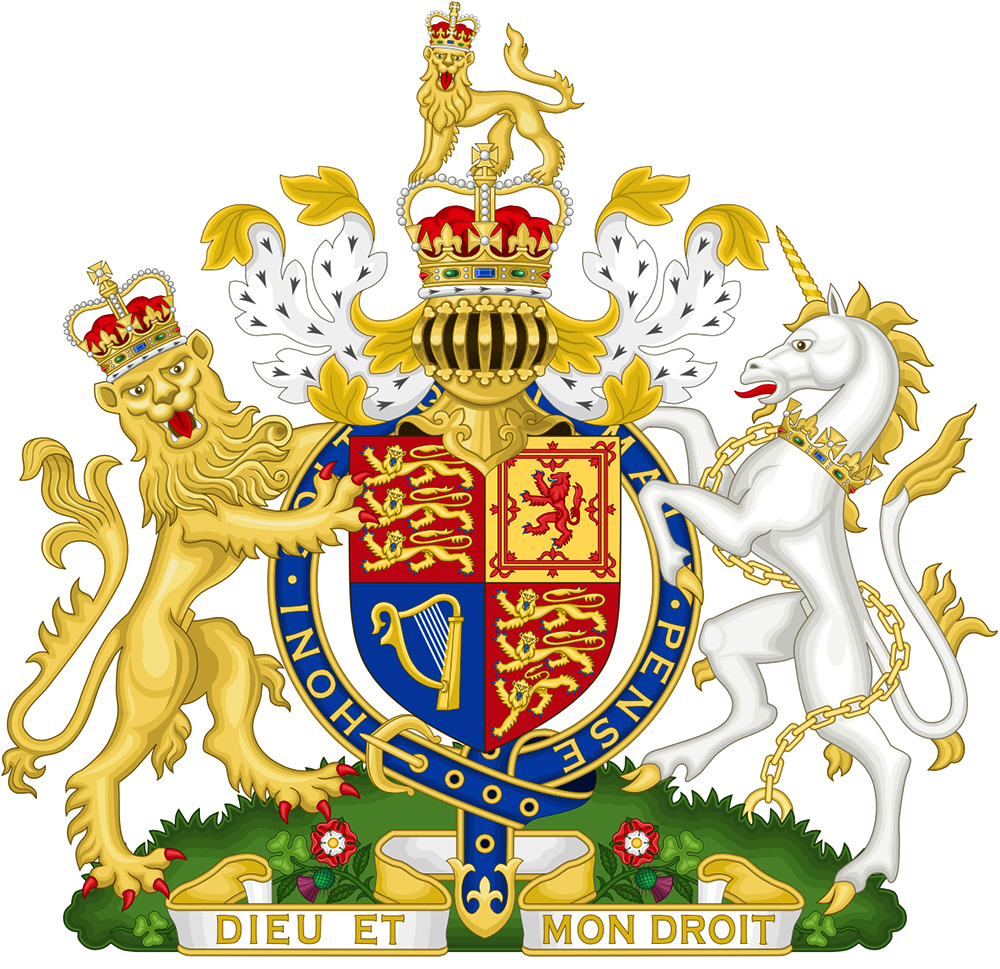
The royal coat of arms of the United Kingdom belongs to the British monarch. Right now, that is Queen Elizabeth II: https://wp.me/p7LiLW-26b
Heraldic design dates back to the Middle Ages, when there was a need to identify armor-covered knights on the battlefield. It’s one of the earliest visual communication systems, with each element having a specific meaning. (More about that further in this post.)

Traditional branding
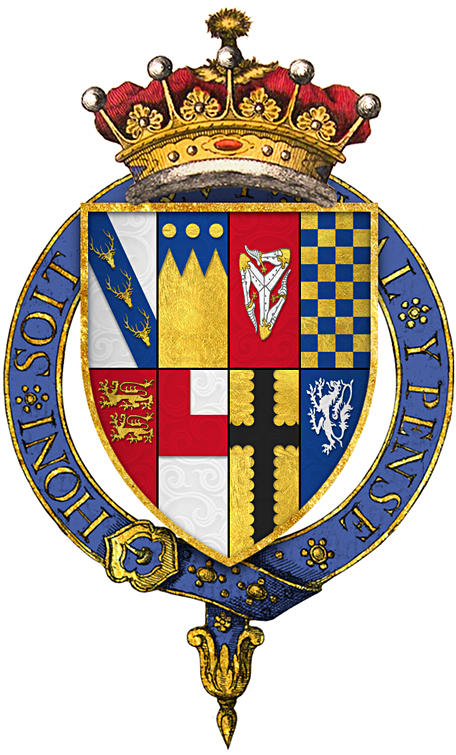
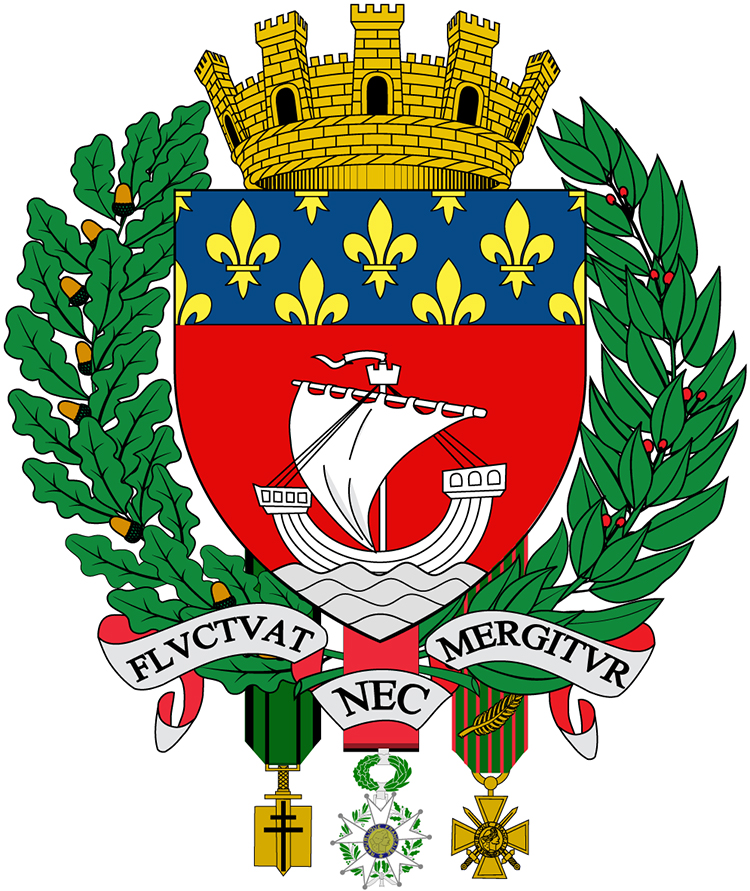
Heraldry is a very common form of identity design for countries, provinces, the military, and all kinds of other organizations. Below, a few examples.
First, Sir Edward Stanley (1509–1572).

Paris, which dates back to 1358.

The United States of America, approved by Congress in 1782.

Heraldic code
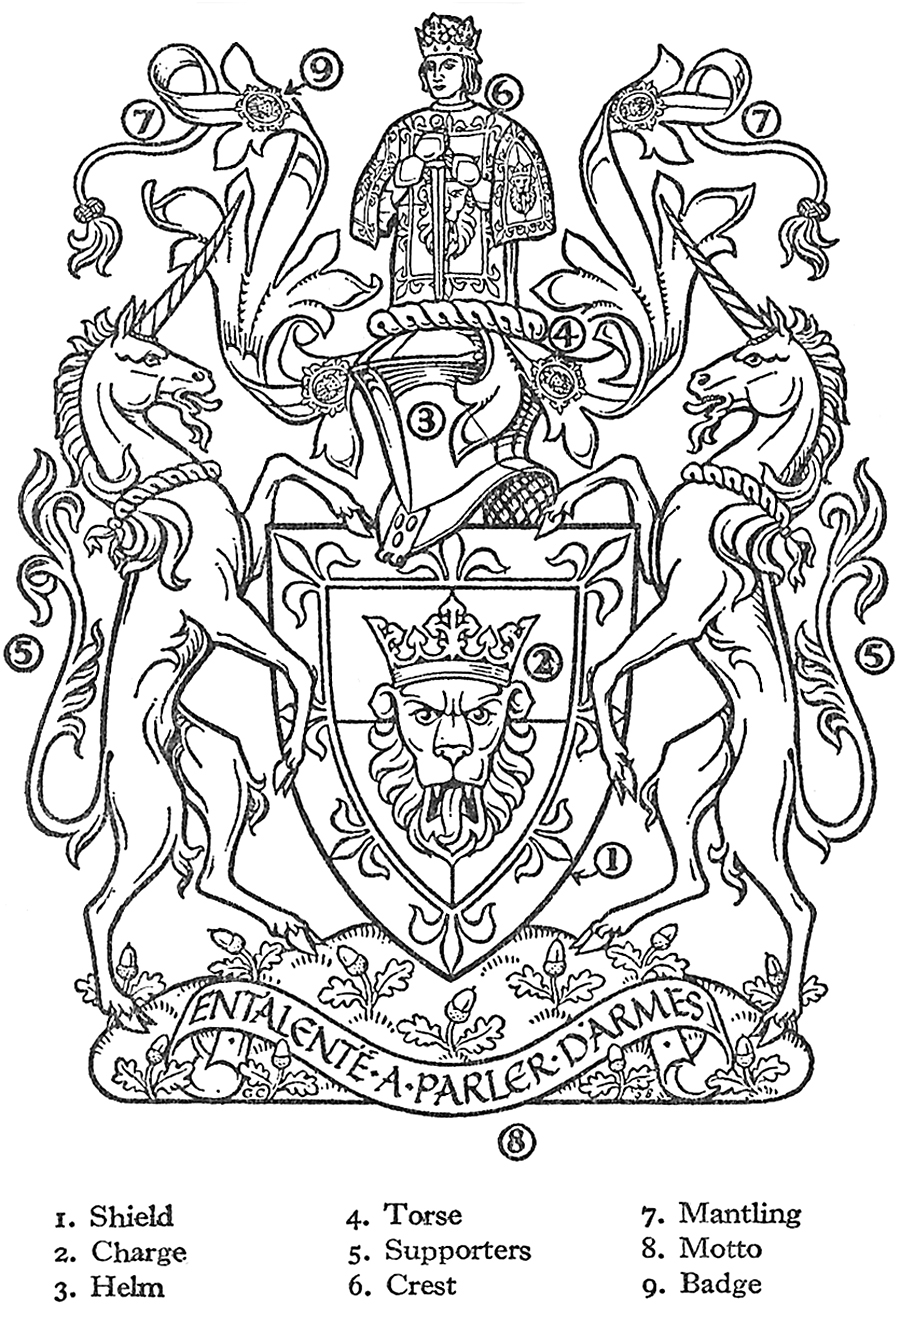
A guide to the parts of a coat of arms from the Observer’s Book of Heraldry, 1966.

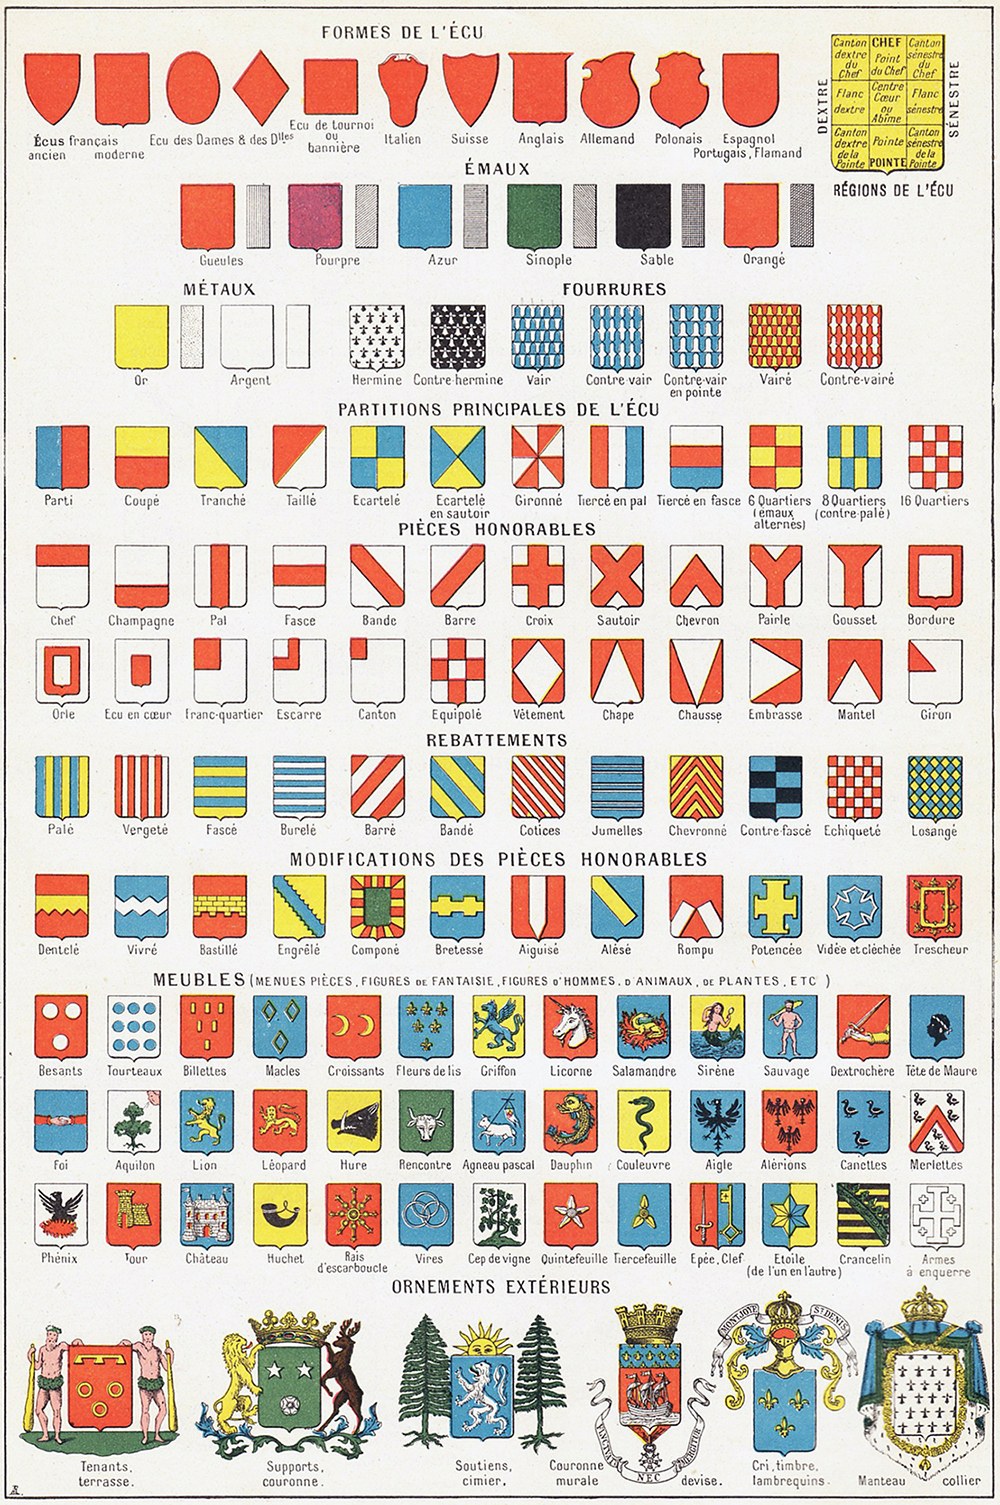
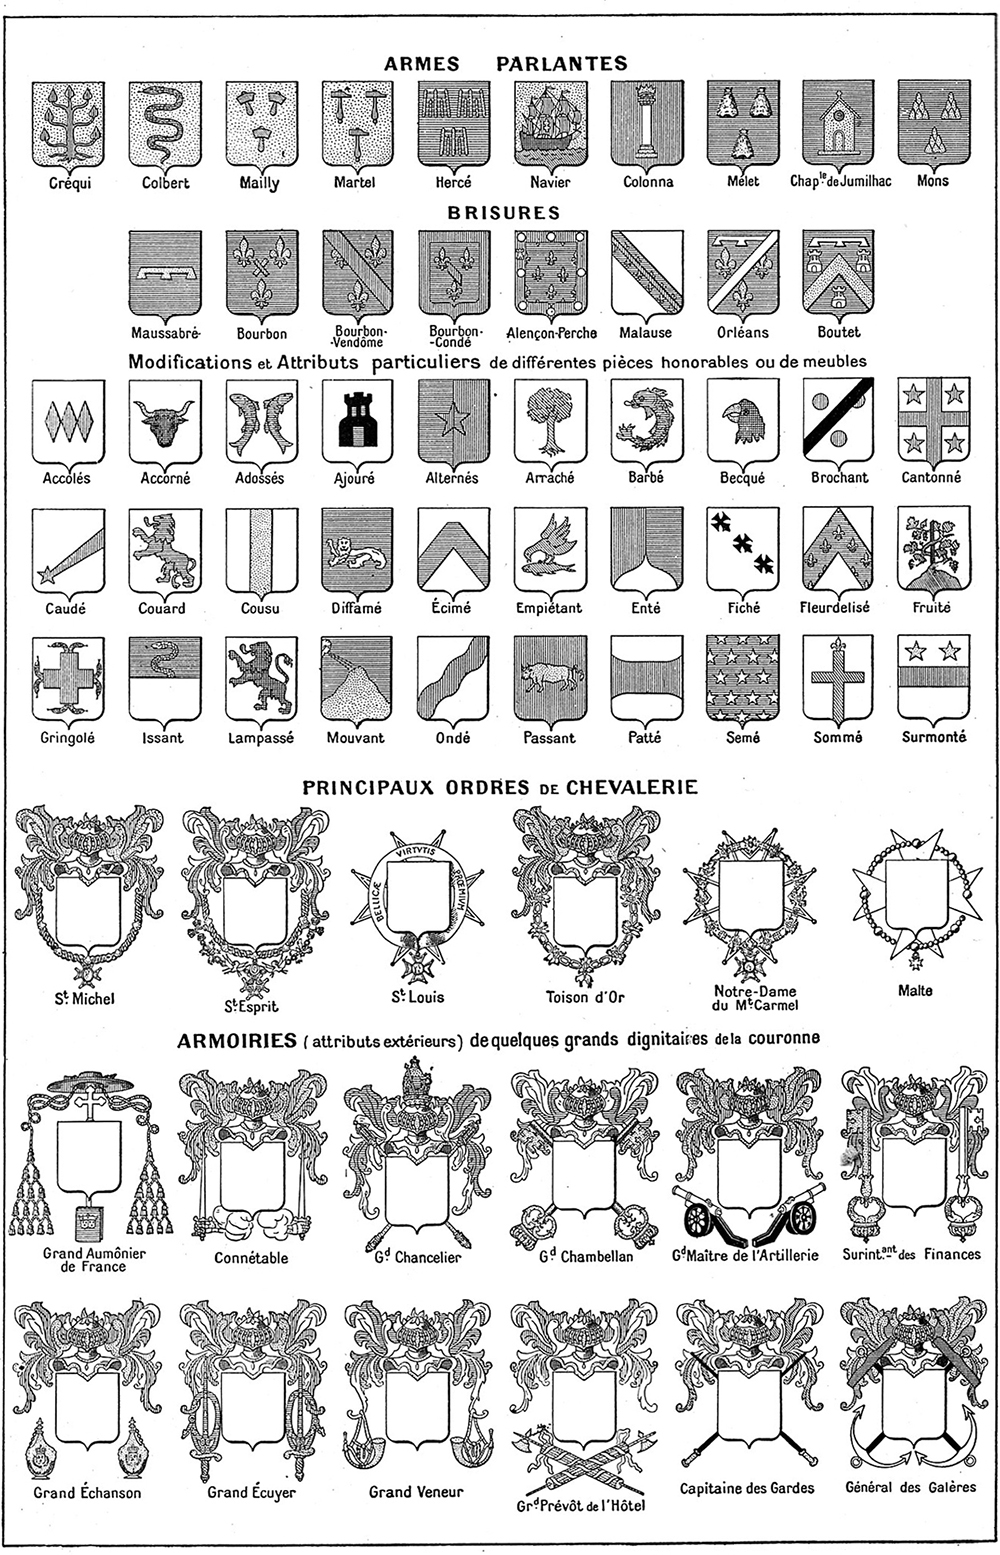
A complex system of components form the basic language of heraldry. From the Larousse Universal Encyclopedia, 1922.

My heraldic heritage
I’ve been researching my own heraldry. Probably because I have delusions of grandeur, as I pointed out here: https://wp.me/p7LiLW-qA
However, extensive therapy has almost convinced me that I’m a commoner.
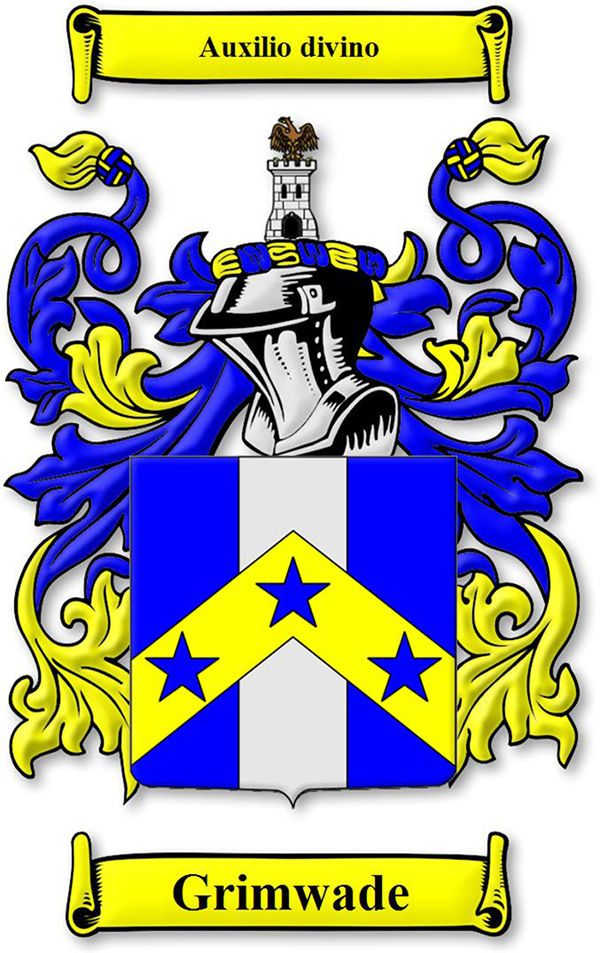
Family members have traced our ancestry back to 1779, but it probably goes back a lot further. Below, the first coat of arms I found. Not sure about the color.

Then I discovered this one (!), and now I’m confused about which design to have above my front door.

More royalty
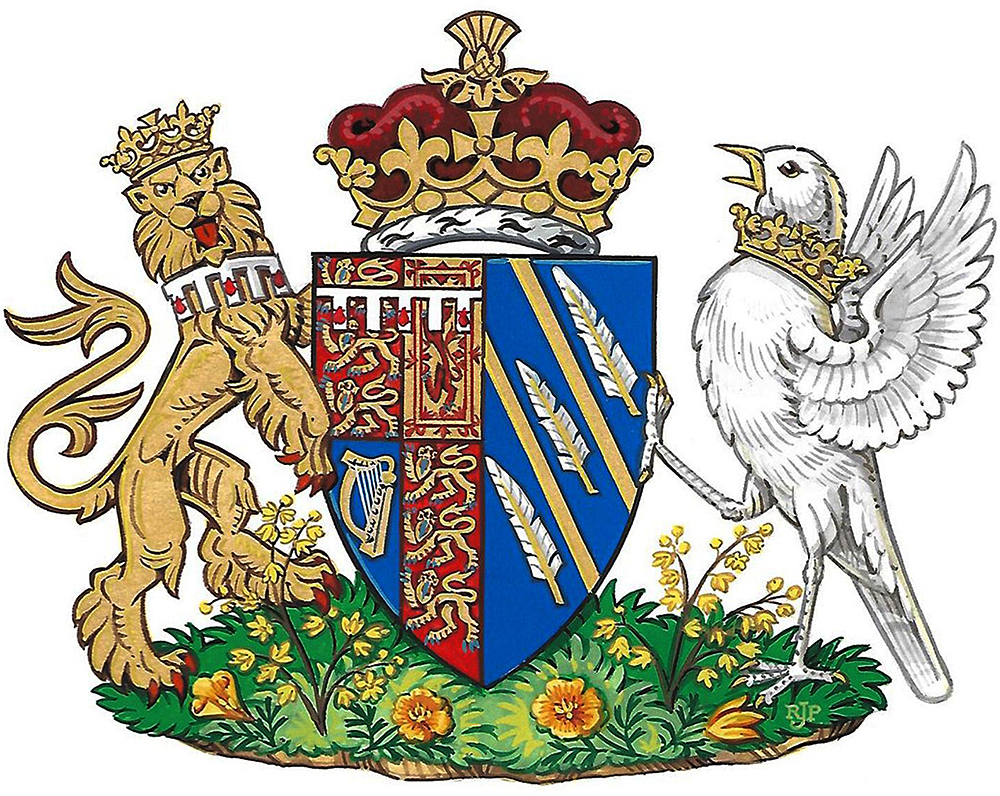
The official coat of arms designed for Prince Harry and Meghan Markle, the latest royal superstars.

Here’s an explanation of the elements:
The Pacific Ocean off the California Coast is represented by the blue background of the shield.
Two golden rays symbolize the sunshine of California (Meghan’s home state).
Three quills represent communication and the power of words.
The left side of the shield carries Prince Harry’s coat of arms.
Under the shield are golden poppies, California’s state flower, and wintersweet, which grows at Kensington Palace, where the couple are living.
The songbird is wearing a coronet around it’s neck, in a design that has been assigned to the new Duchess of Sussex.

Weather graphics

METEOROLOGICAL VISUALIZATION.

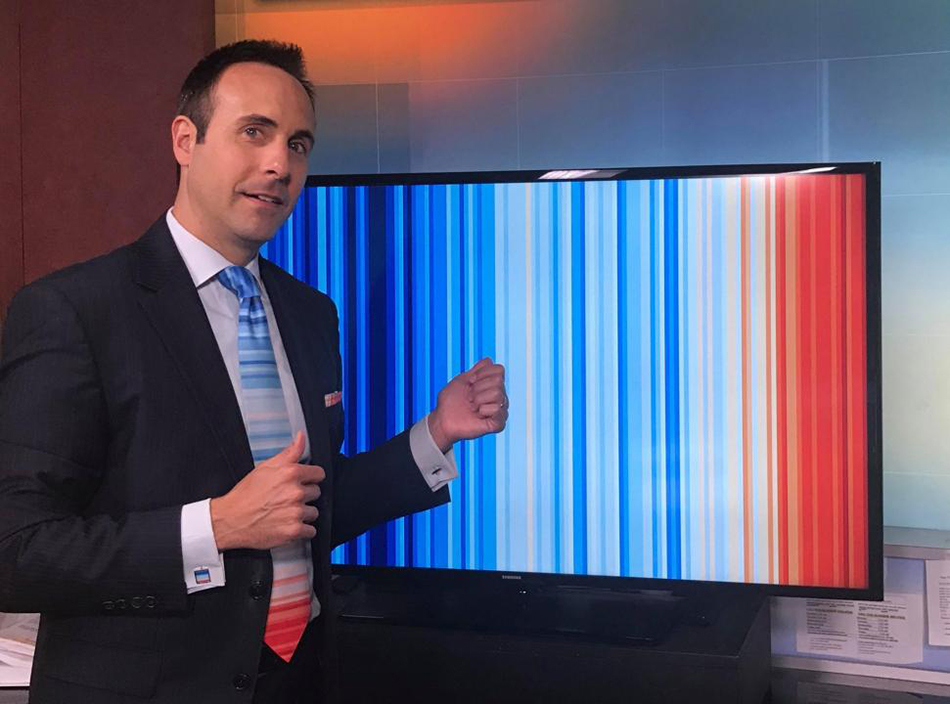
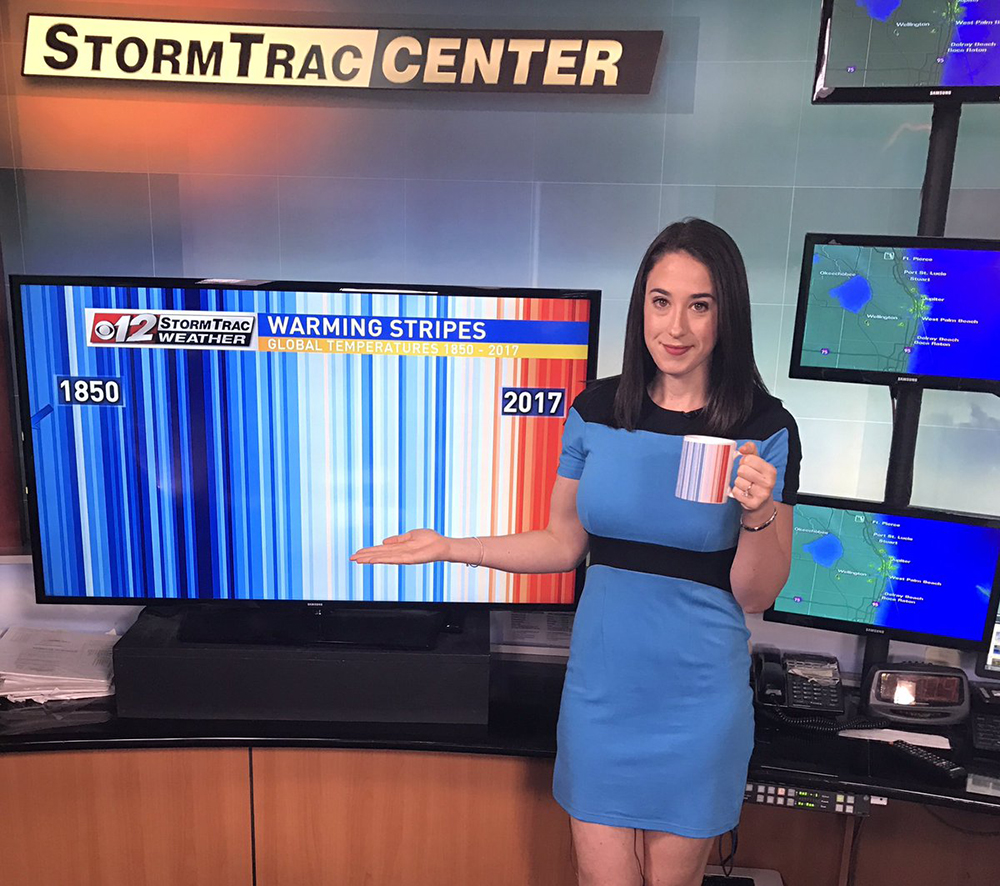
Many male weather presenters wore an infographic tie on the summer solstice (June 21). It’s a data visualization of the change in global temperature from 1850 to 2017, by Ed Hawkings. http://www.climate-lab-book.ac.uk/2018/warming-stripes/

Jeff Berardelli at WPEC CBS 12 in West Palm Beach led this initiative of the #MetsUnite movement. The color scale represents the change in global temperatures covering 2.43° F. (1.35° C.) Blue indicates annual average temperatures below normal, and red shows average annual temperatures above normal.

Merchandise for meteorologists
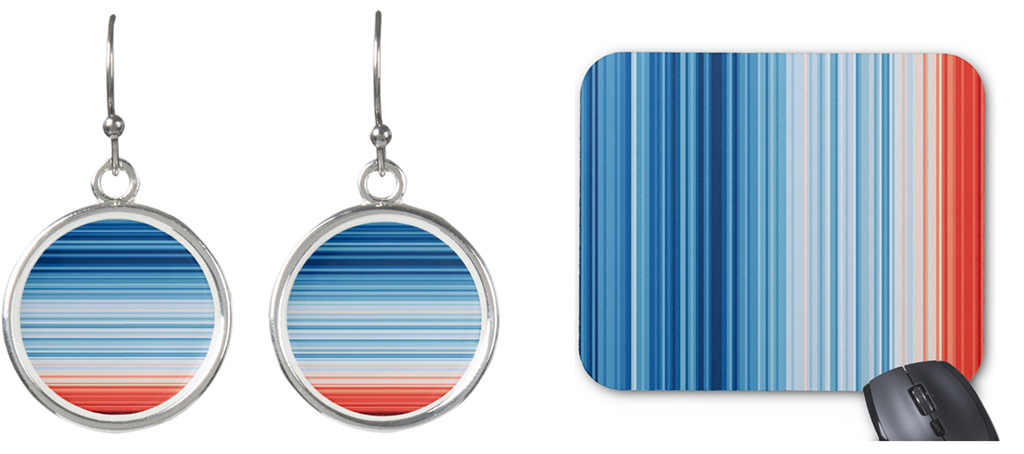
Below, Lauren Olesky (also a presenter at CBS 12) with her morning coffee. The chart is available in a range of items from earrings to mousepads. https://www.zazzle.com/climate_change

Outfit confusion
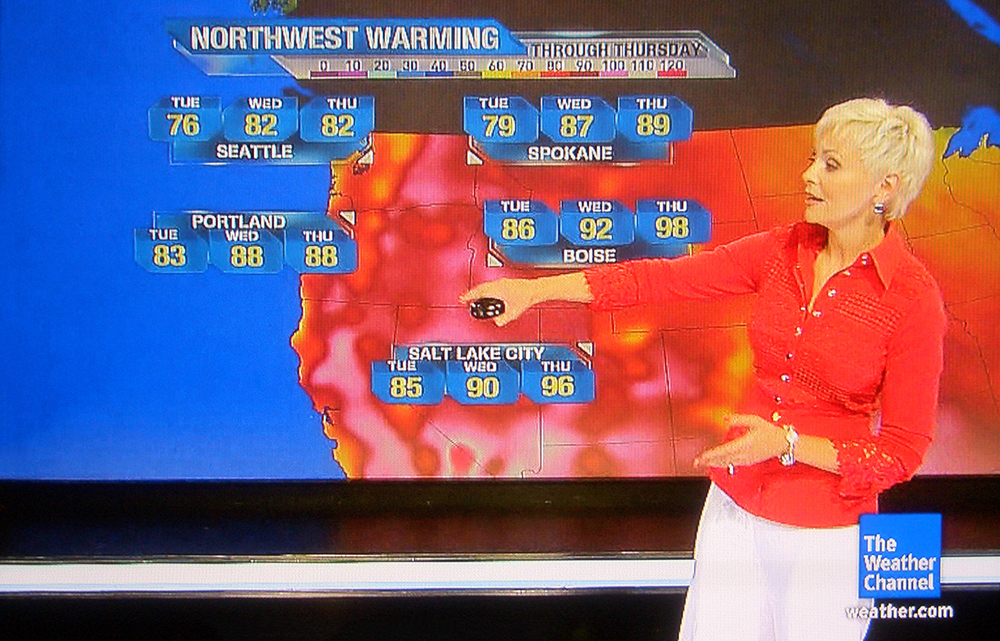
I wish the producers of weather broadcasts would persuade presenters to dress in more neutral outfits. For obvious informational reasons.

Augmented reality
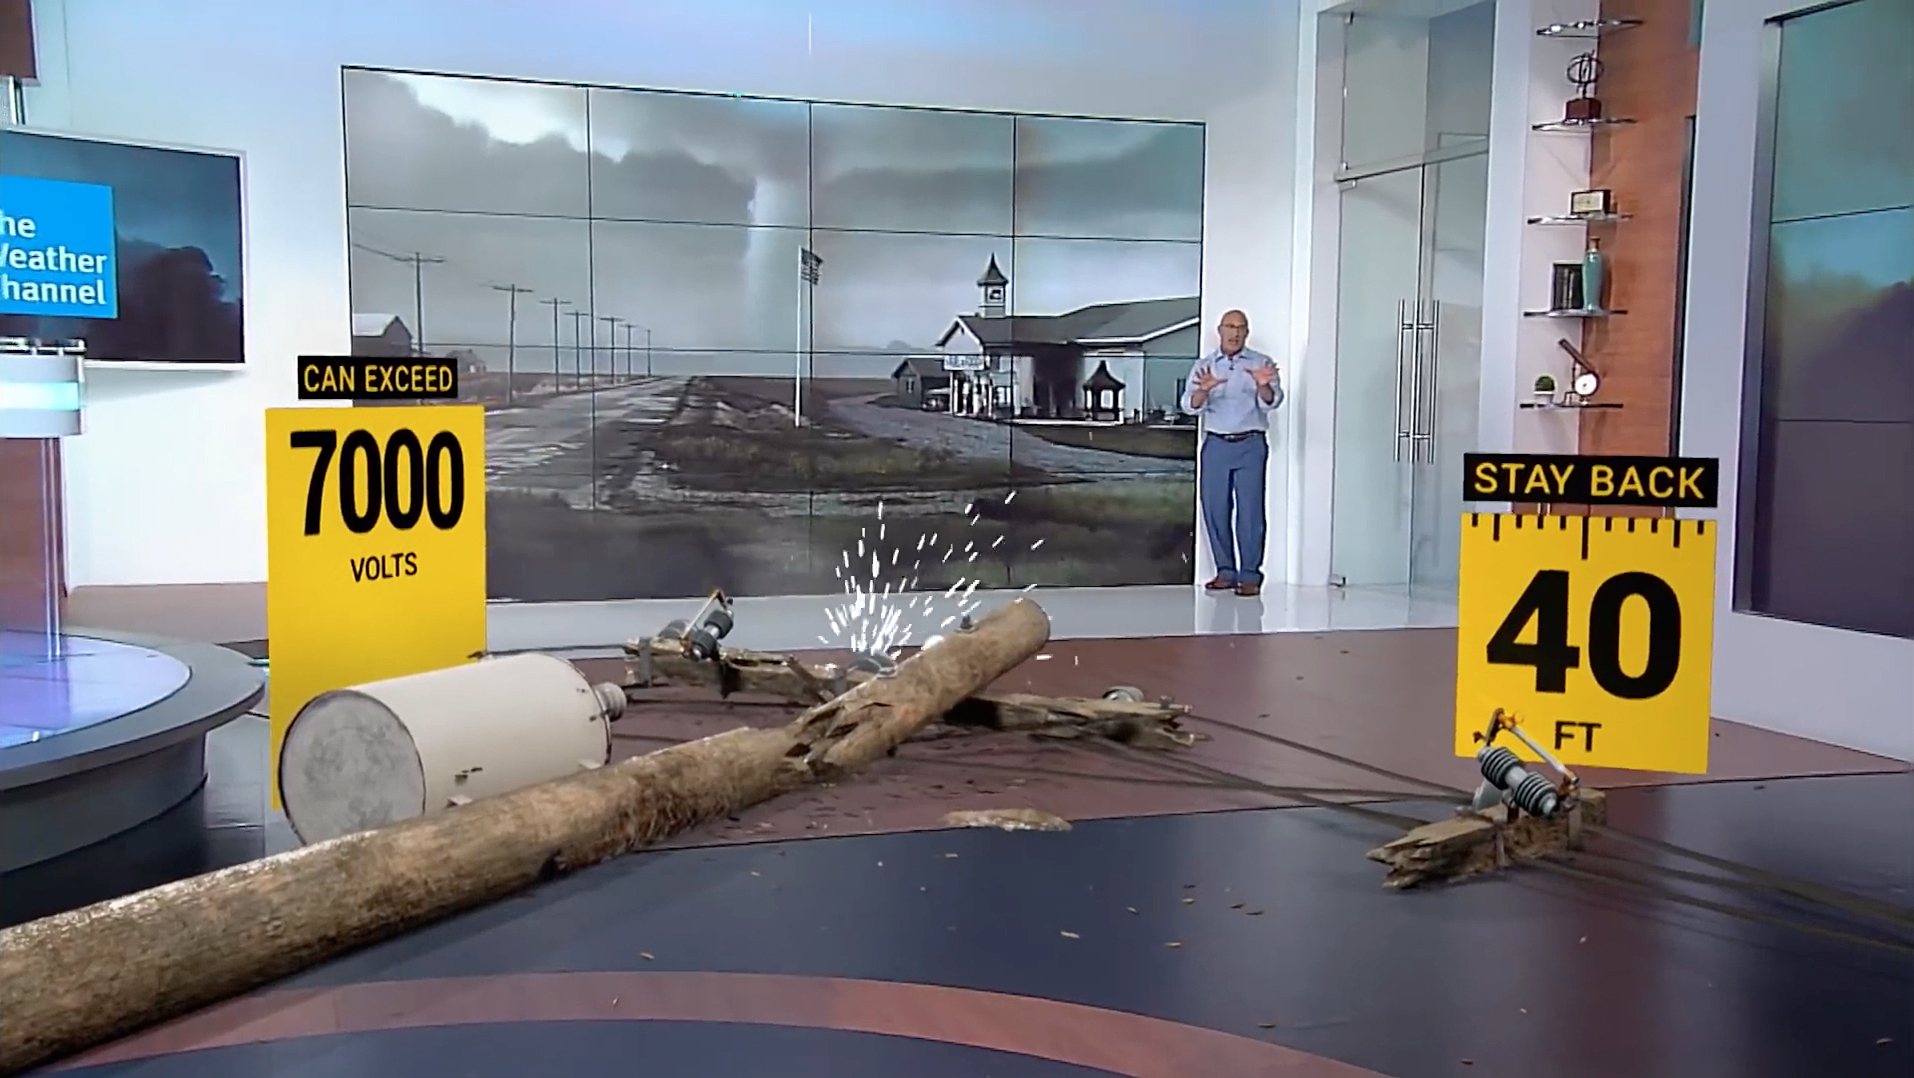
The Weather Channel recently started using “Max Reality” to add impact to weather explainers. The Future Group’s technology is the driving force behind this. Click on the image below to see Jim Cantore describe the dangers that accompany a tornado. Check out the crashing utility pole at 1:50, and the flying car at 4:00.

Technical issues
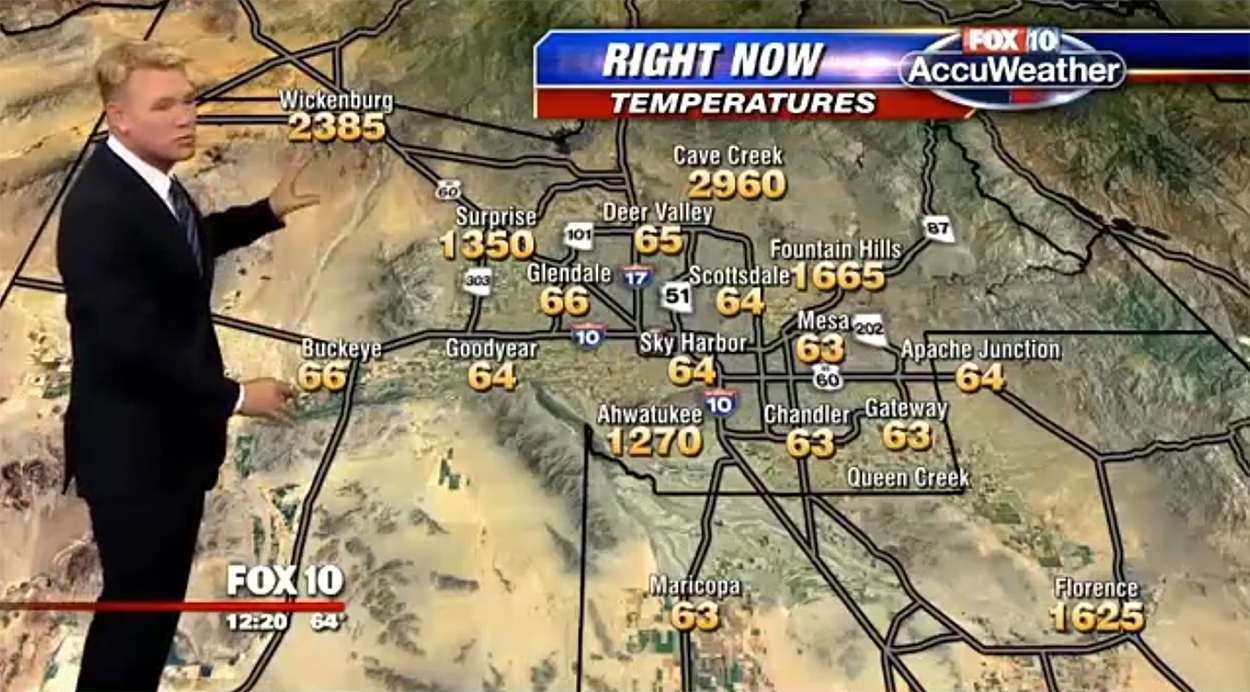
We all have our problems. Cave Creek’s evening temperature is hotter than molten steel at 2,960° F. (1,627 C.)

Cranking it up
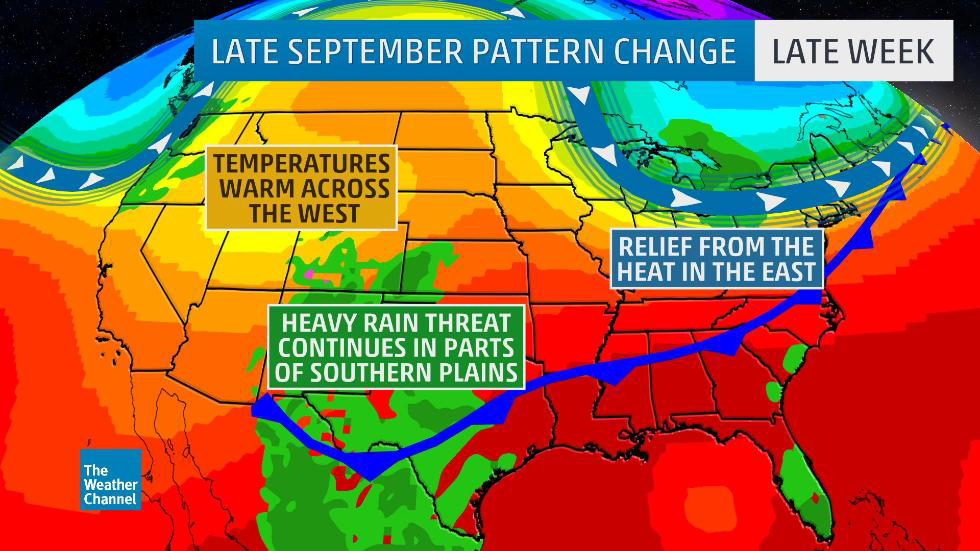
TV weather forecast graphics tend to be in the showbiz end of information design. They’re often very colorful, but don’t promote a feeling of reliability. (Well, not to me.) I guess it’s the result of a battle for viewers. Information graphic critique: There’s no key to the colors, and this is a problem. We assume (correctly) that the graphic goes from cool to hot in terms of temperature, but green has also been used to show rainfall. Two additional blues show a front and the jet stream. The visualization is not wrong, but it could be clearer.

Inconsistency
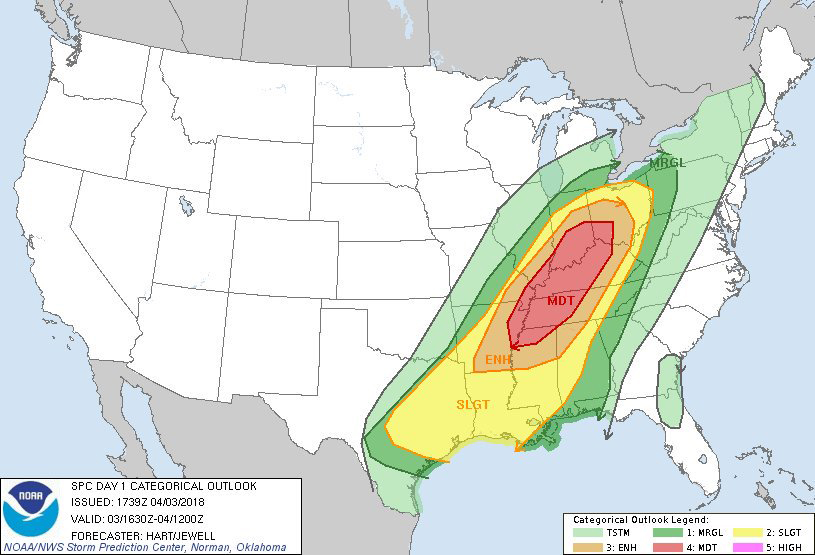
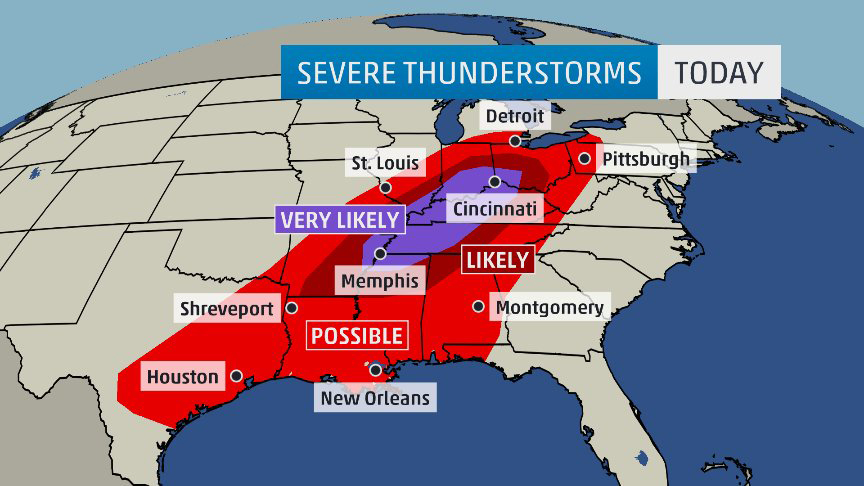
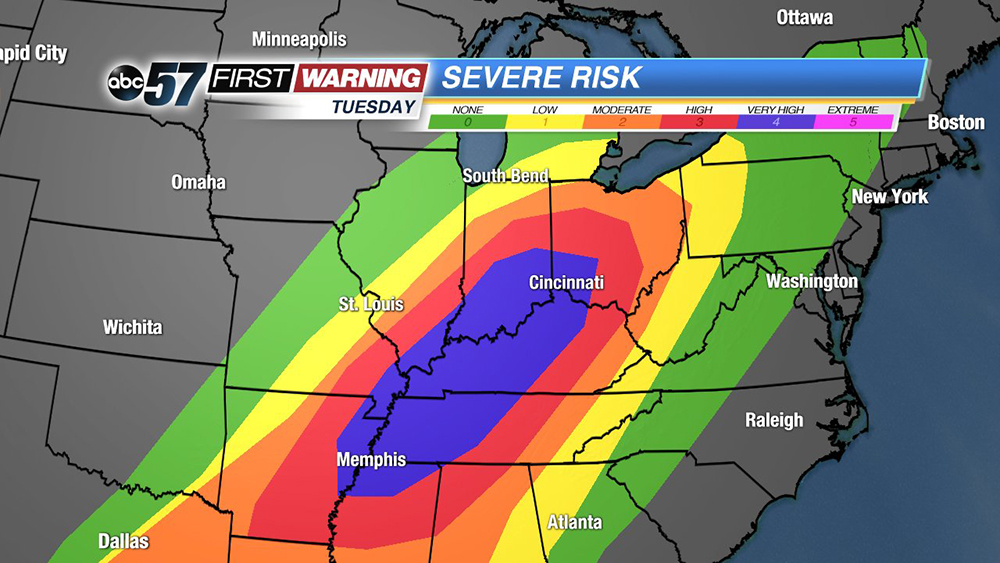
There’s a standard color scale to use for storm prediction in the U.S. (below). However, various outlets interpret it in different ways. These three forecasts are for the same severe weather pattern, in our area, earlier this year.

More accurate hurricane forecast maps
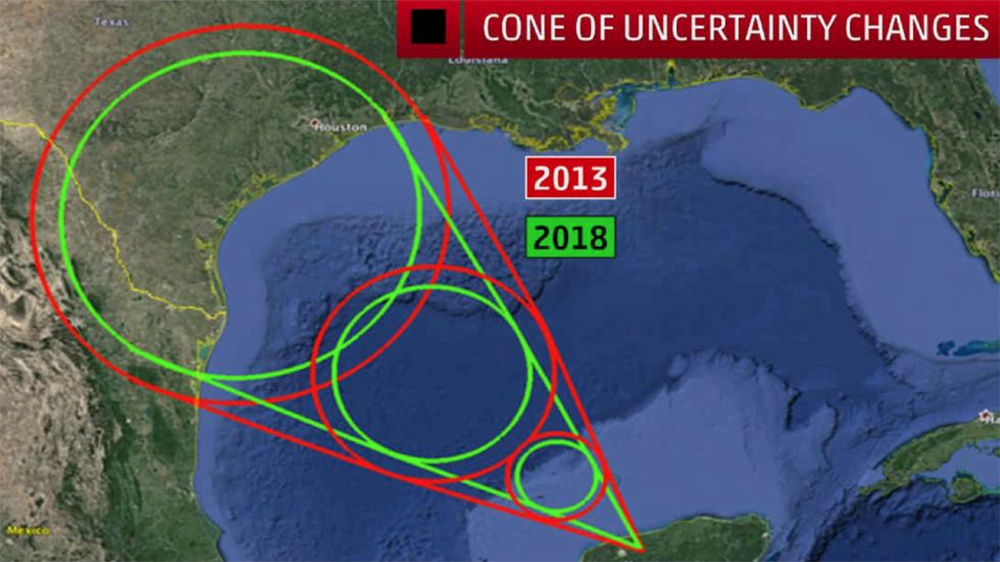
I’ll finish on a more positive note (for a change). This year, the National Hurricane Center is shrinking the “cone of uncertainty” that predicts the possible track of the center of a hurricane, by analyzing the previous five hurricane seasons.
Thank you to two former Ohio University students for help with elements of this post: Alex Hurley, M.S. Environmental Studies, and Ethan Emery, B.S. Meteorology.