Category: Infographics

Use this color

PANTONE MAKES THINGS EASY.

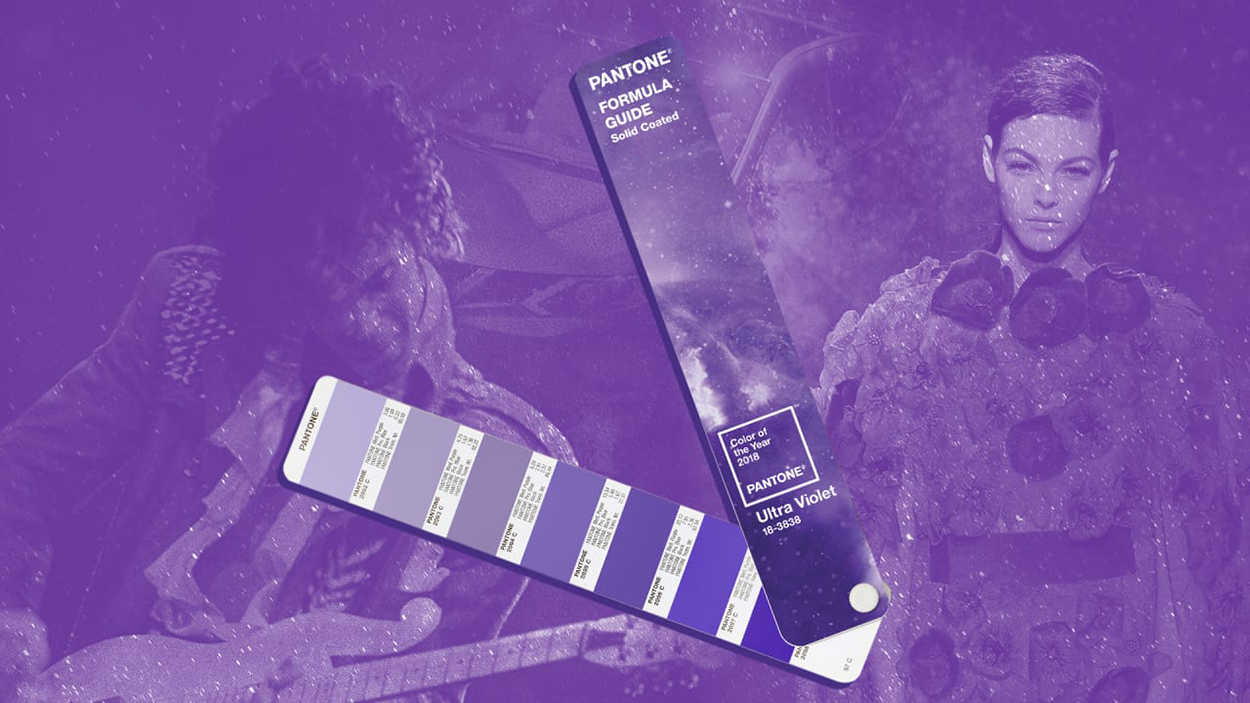
If you want to to win prizes with your 2018 infographics, there’s a simple answer: Use plenty of Pantone 18-3838 Ultra Violet.

From the Pantone website: “A dramatically provocative and thoughtful purple shade, Pantone 18-3838 Ultra Violet communicates originality, ingenuity, and visionary thinking that points us toward the future.”

This other home page statement is pretty meaningful: “Complex and contemplative, Ultra Violet suggests the mysteries of the cosmos, the intrigue of what lies ahead, and the discoveries beyond where we are now.”

Read more of these kind of insights here: https://www.pantone.com/color-of-the-year-2018

And get a mug to remind you each morning: goo.gl/KWx7VD

Of course, the real ultra violet is not in the visible area of the electromagnetic spectrum. However, it gives us a sun tan (or sun burn), and makes for interesting effects in night clubs. It’s also good for killing germs. But we can’t directly see it.

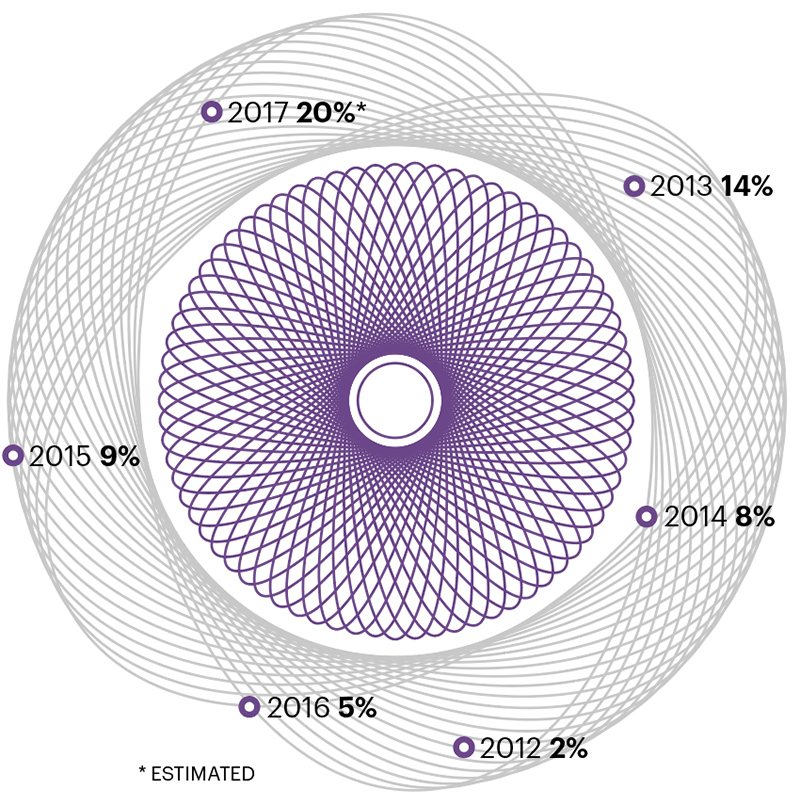
Anyway, a combination of Pantone 18-3838 and a Spirograph should be enough to clean up the top data viz awards this year.
See my advice on making fake data viz here: https://wp.me/p7LiLW-11q

A general post about Pantone: https://wp.me/p7LiLW-qq

Sweets (Candy)

CONFECTIONERY GRAPHICS.

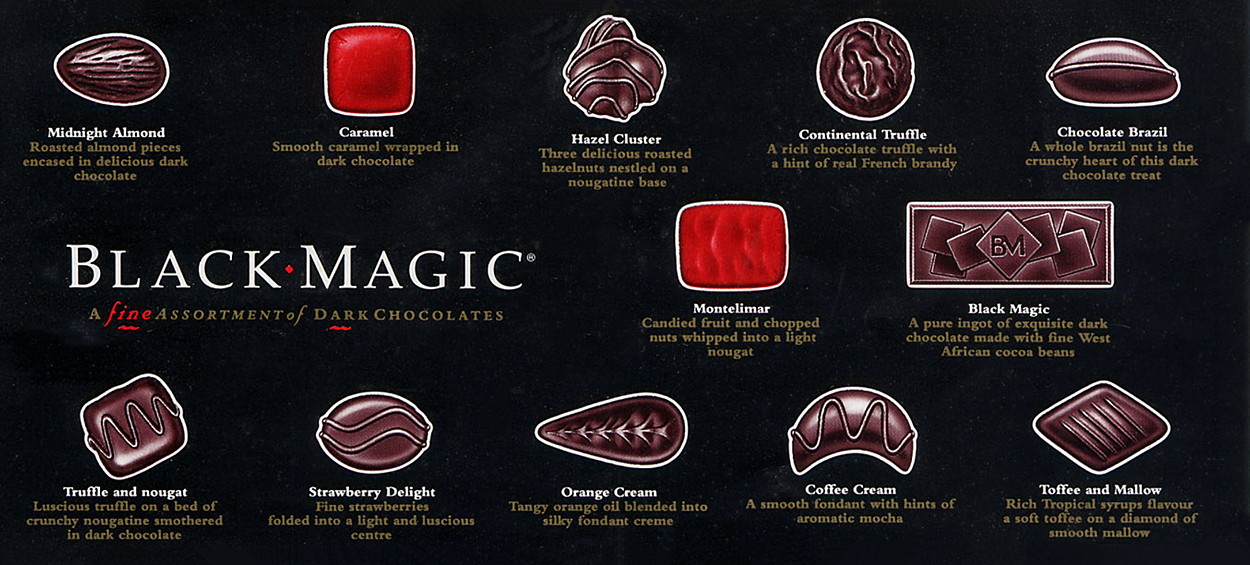
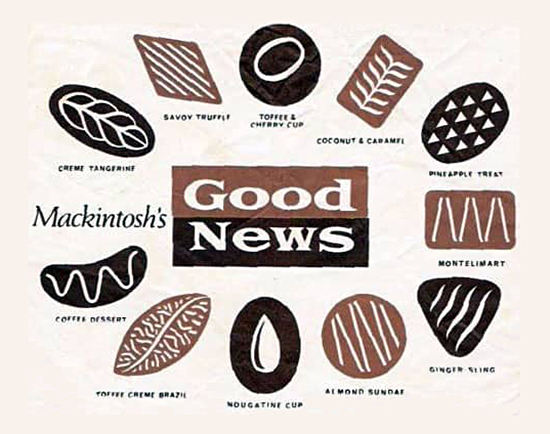
Selection guide A piece of simple, and useful, infographic magic. (Click on the image for a larger version.)

Savoy Truffle The lyrics of this 1968 Beatles’ song refer to Good News chocolates. They contain a warning about the risk of future dental problems: “…you’ll have to have them all pulled out.”

Creme Tangerine and Montelimar
A Ginger Sling with a pineapple heart
A Coffee Dessert, yes, you know it’s Good News
But you’ll have to have them all pulled out after the Savoy Truffle.

Hear it The section of “Savoy Truffle” described above is here: goo.gl/MdESas
Or get the full song on iTunes: goo.gl/hf4DsX

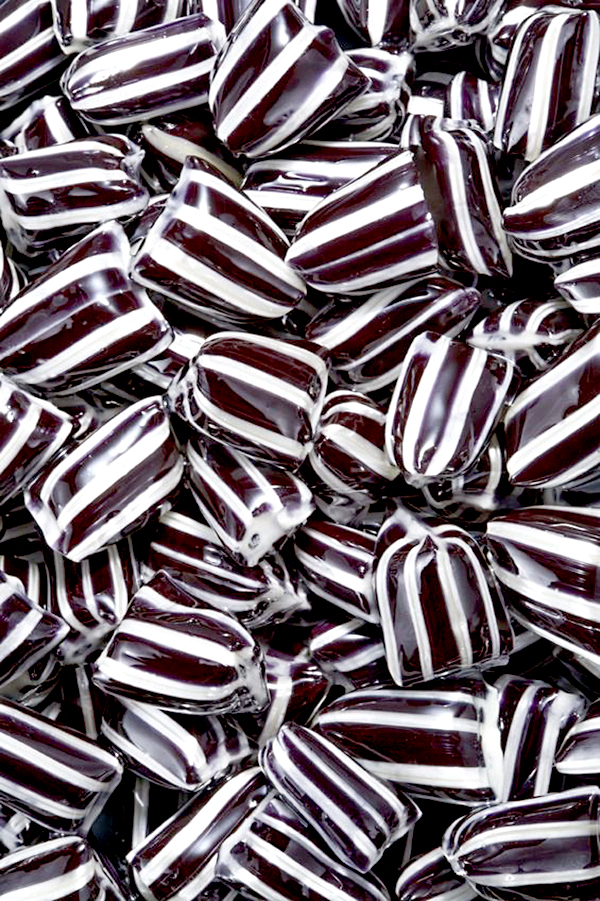
Sweet thesis My art school final project was called “Sweets.” I’m afraid that this unbelievably-great graphic artifact is lost deep in the vaults of the massive Grimwade Museum of Infographics (which is on the Isle of Sheppey), but I do remember that one component was photographs of Everton Mints. There’s something inherently graphic about many types of confectionary.

Photograph © Mark Fairey/123rf

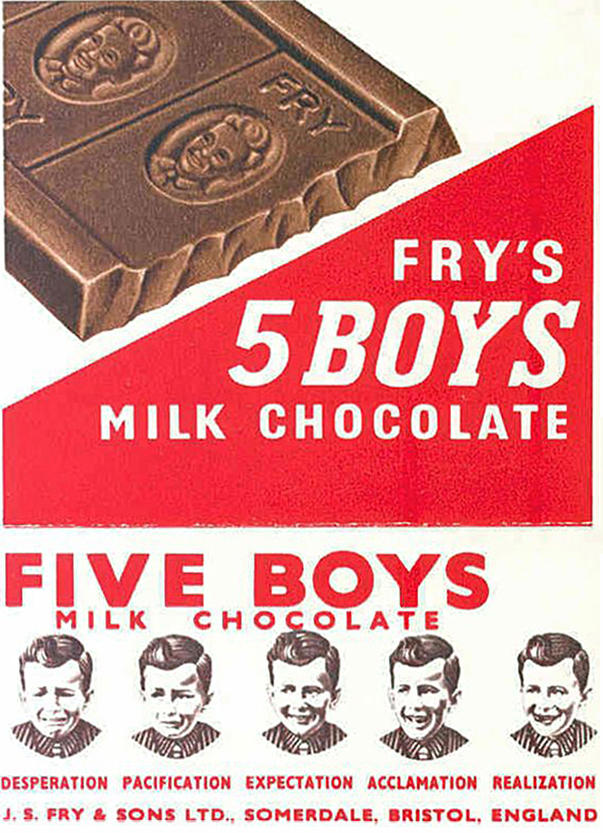
Five Boys My favorite vintage candy label contains a strange message. What does it mean?
Are these the five stages of an infographic project?

Timeline

VISUALIZING SEQUENCES.

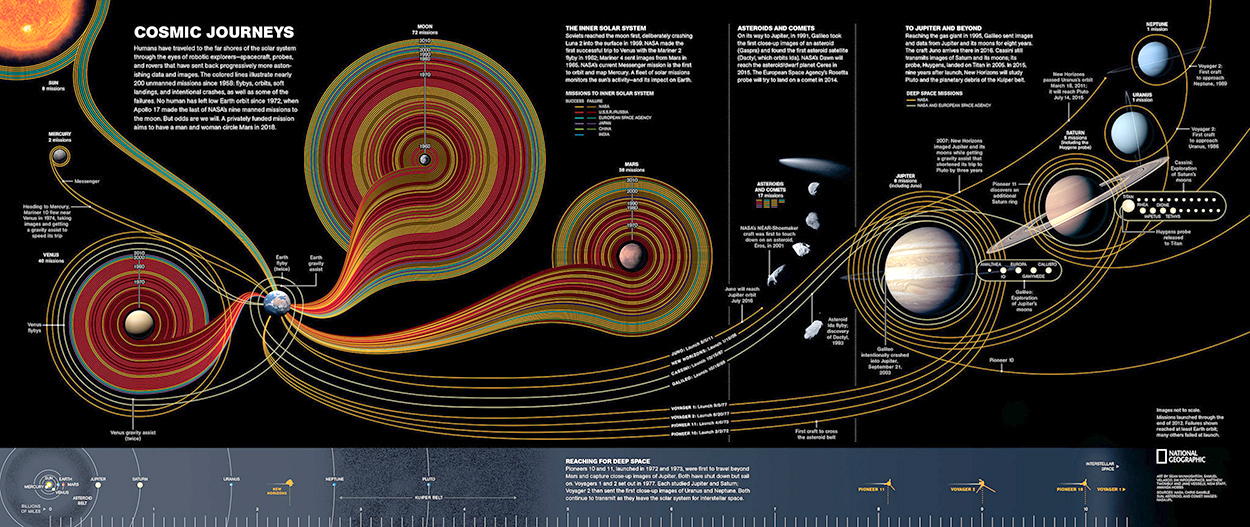
Space travels 54 years of exploration. Click on the image for a larger version. By Sean McNaughton, Samuel Velasco (5W Infographics), Matthew Twombly, Jane Vessels and Amanda Hobbs for National Geographic magazine.

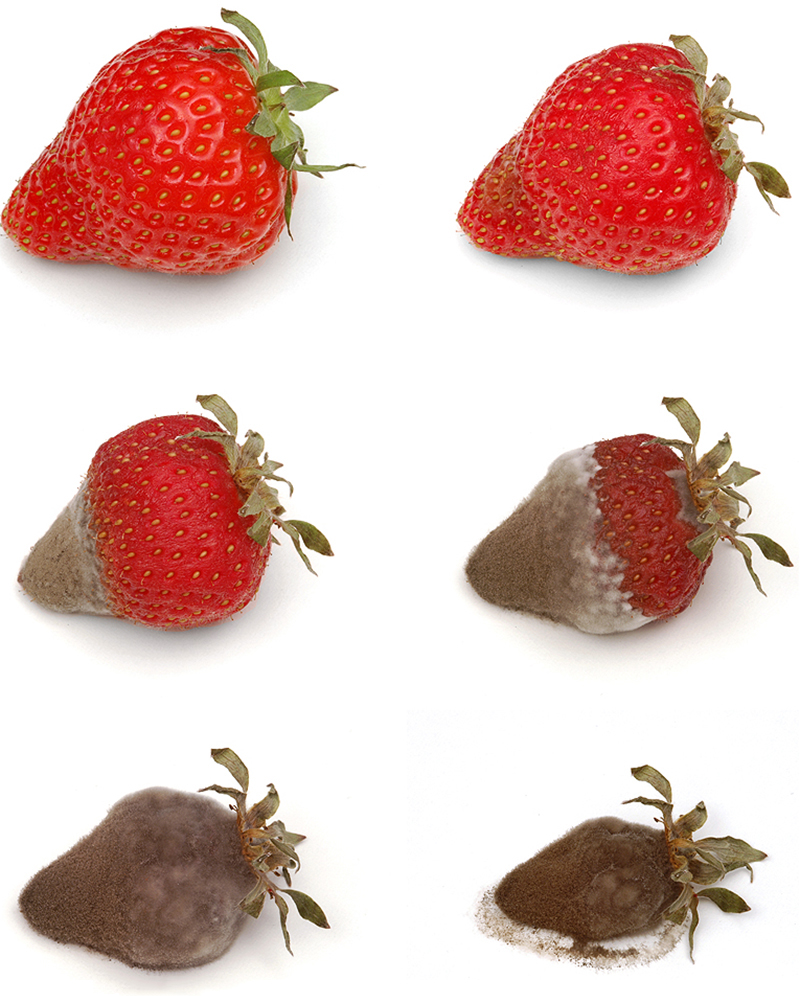
Decay Fruit soon displays the passage of time. Slowing down this process is the subject of a lot of research.

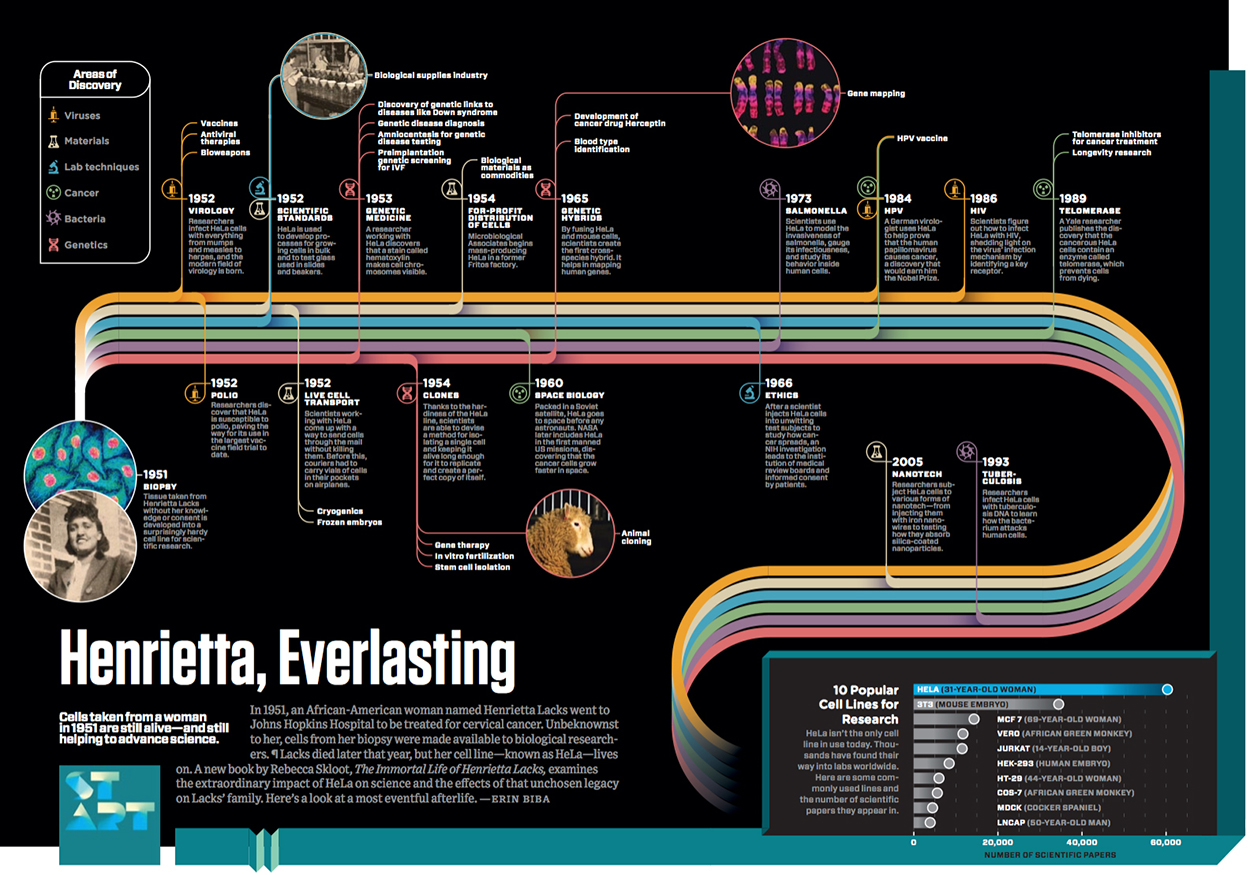
Cell line An African-American woman’s stem cells (taken without her knowing in 1951) have had a huge effect on medical science. Click on the image for a larger version. By Walbaum, for WIRED magazine.

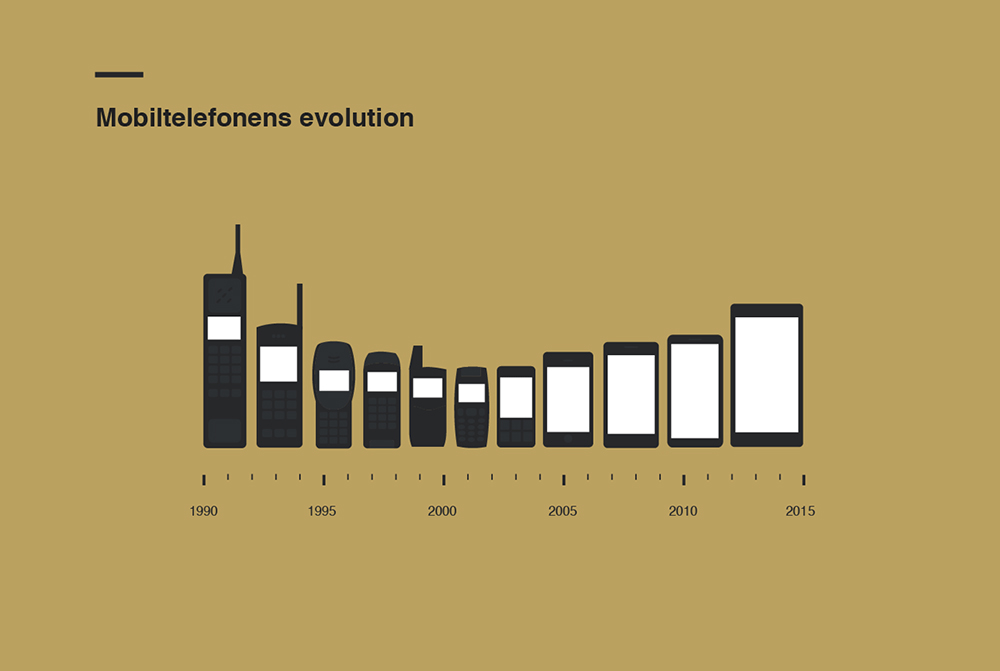
Cellphone history By Fremtidens Business.

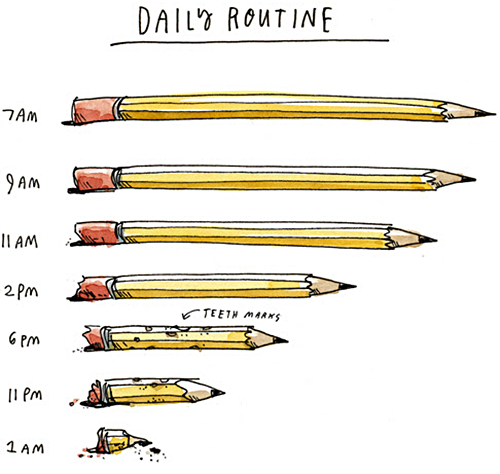
Routine Wendy MacNaughton captures the anxiety of the creative process.

Time-lapse Flowers opening. Click on the image to see the video. I think it’s worth it.

Building a massive container ship. See the video here: https://bit.ly/3aab4WR

The view from my New York studio, which was a room in my apartment. (I’m not there any more, but I miss it.)
Click on the image to see the video.

Eight by Eight: Issue 12

THE BEAUTIFUL GAME IN PRINT.

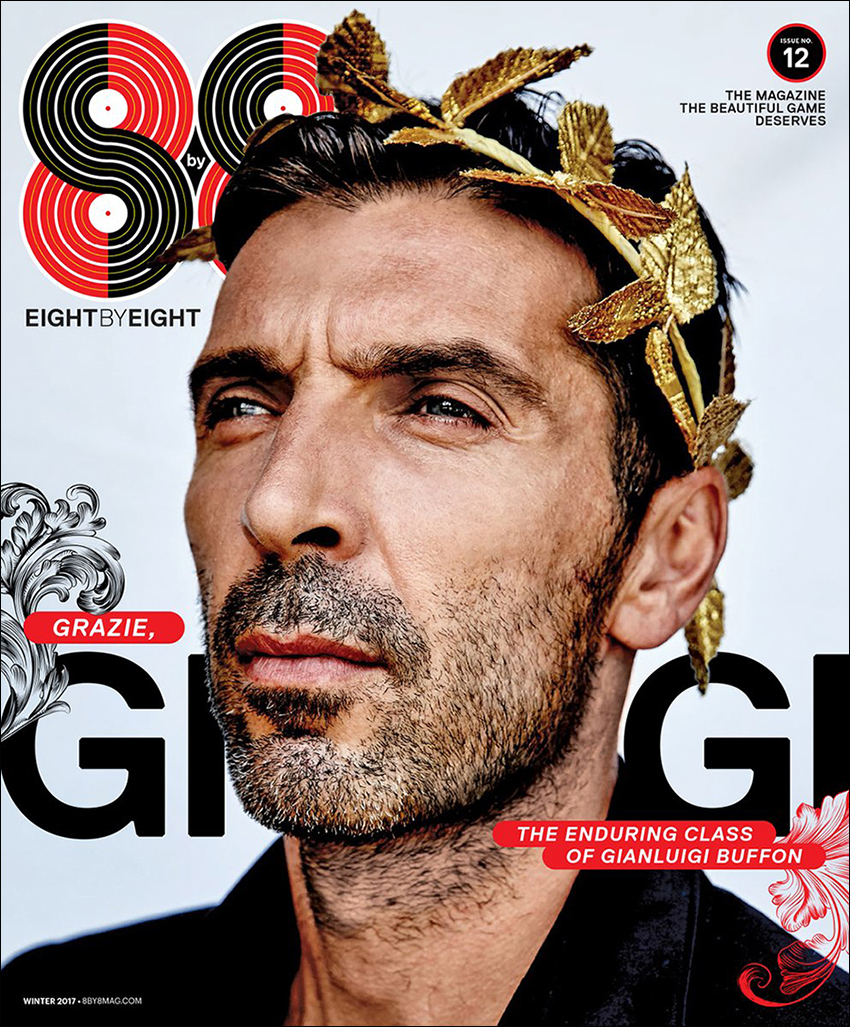
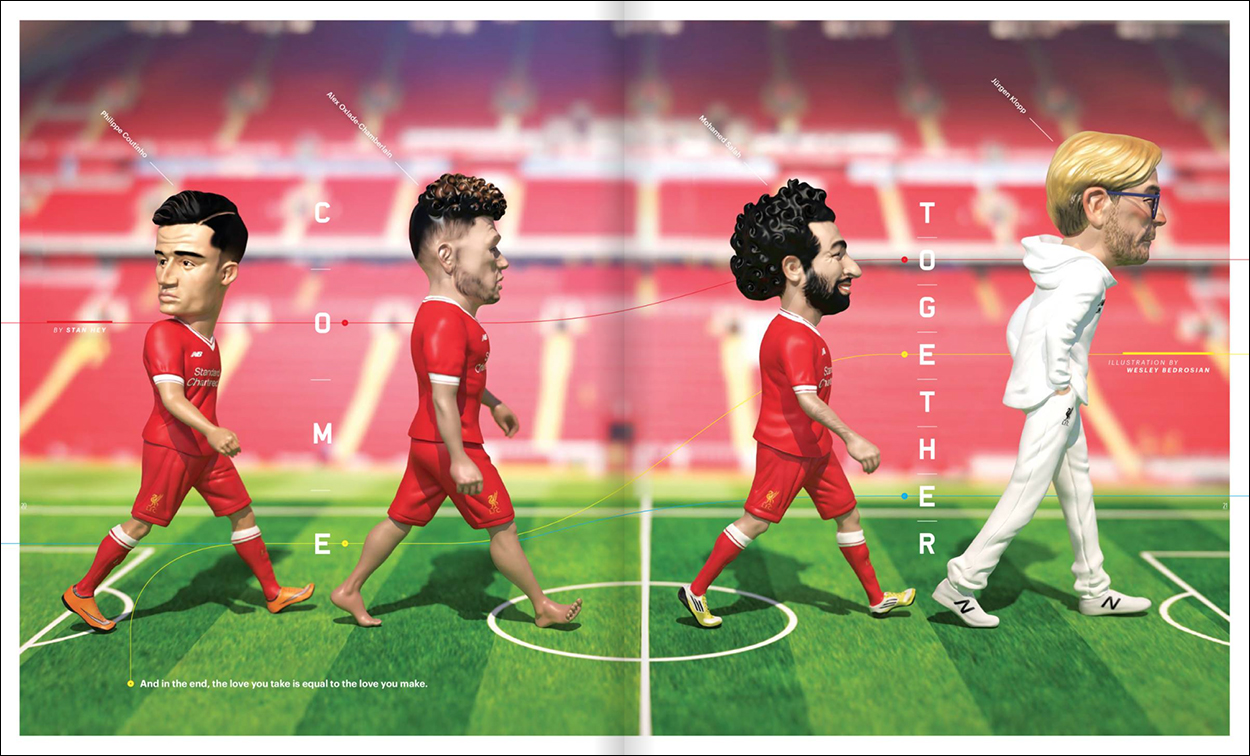
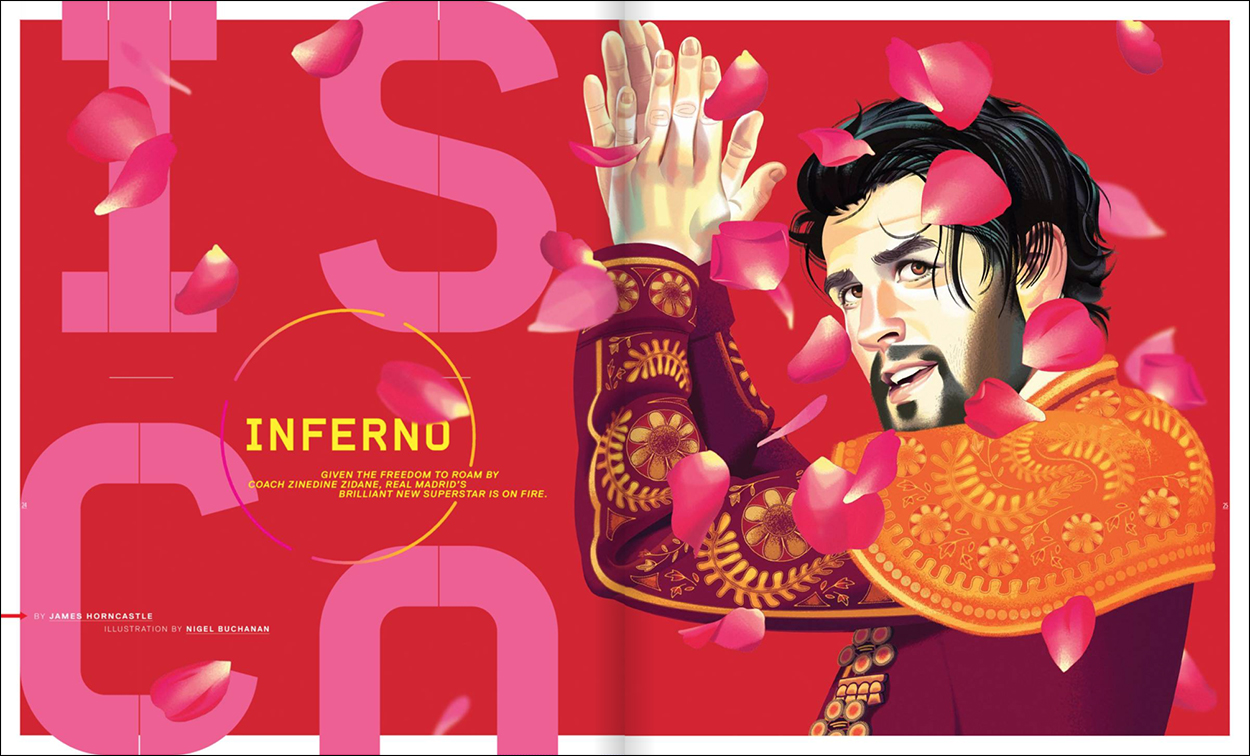
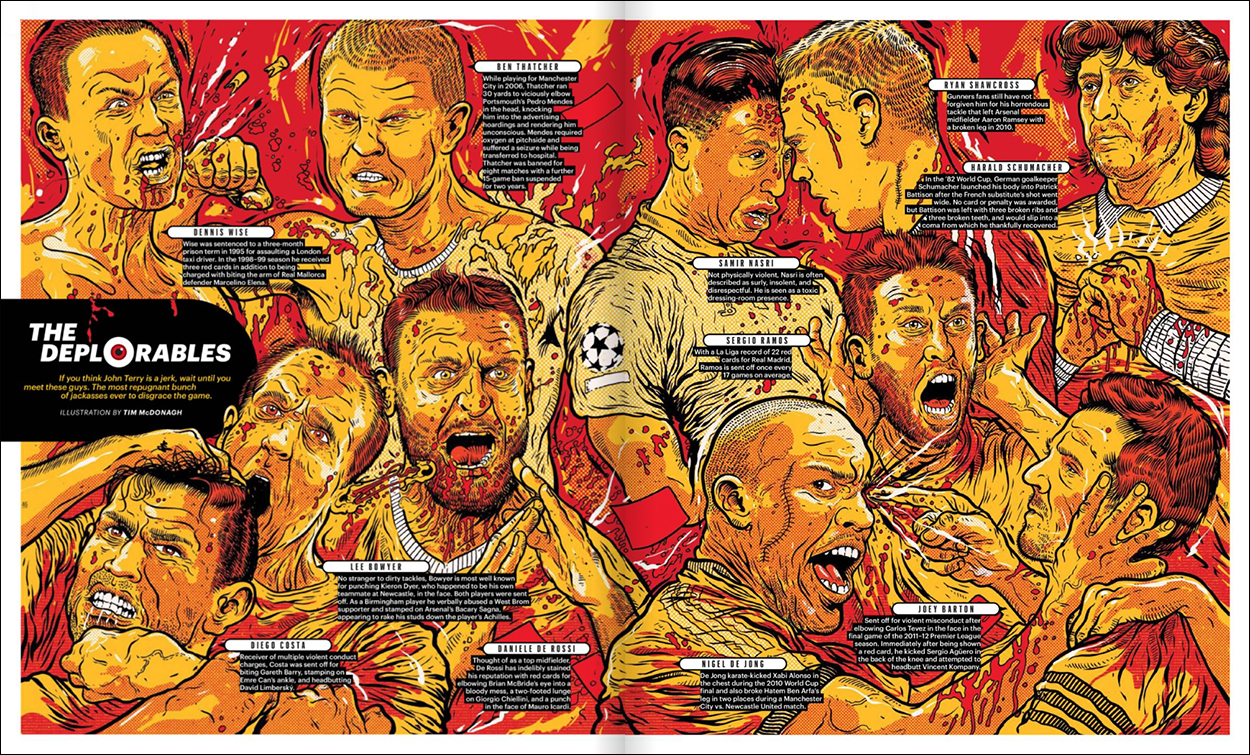
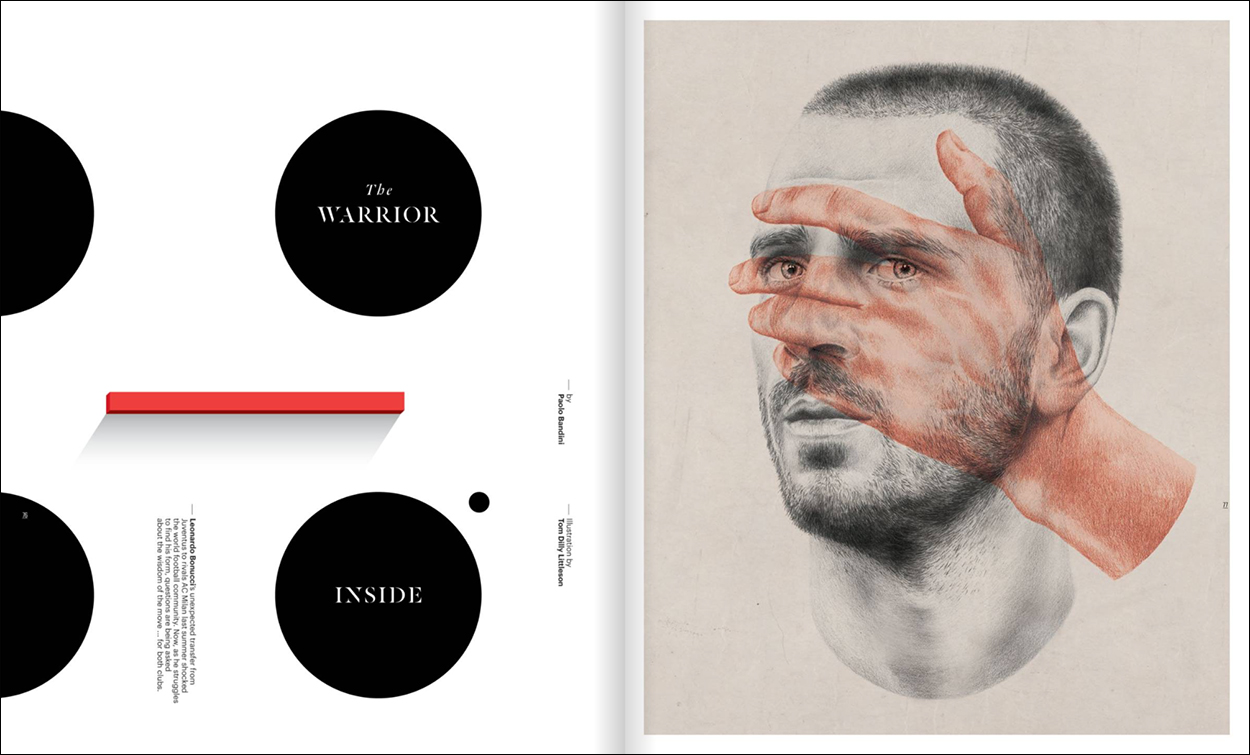
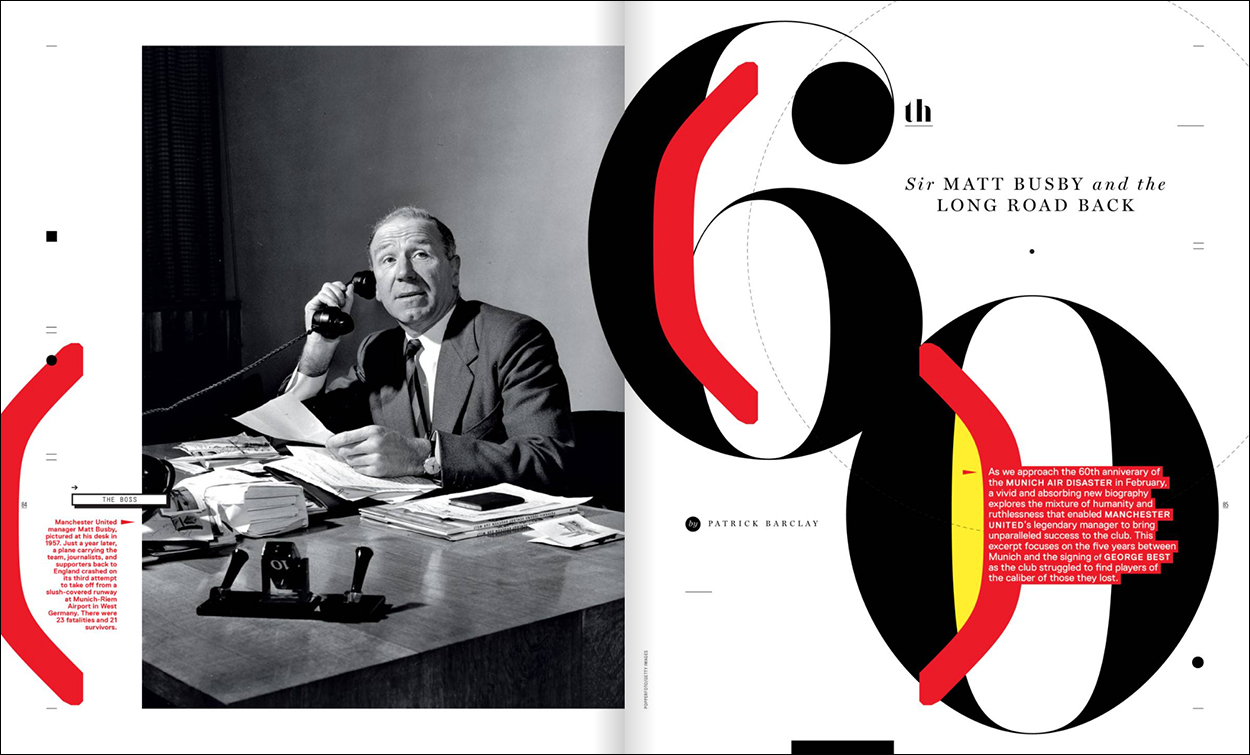
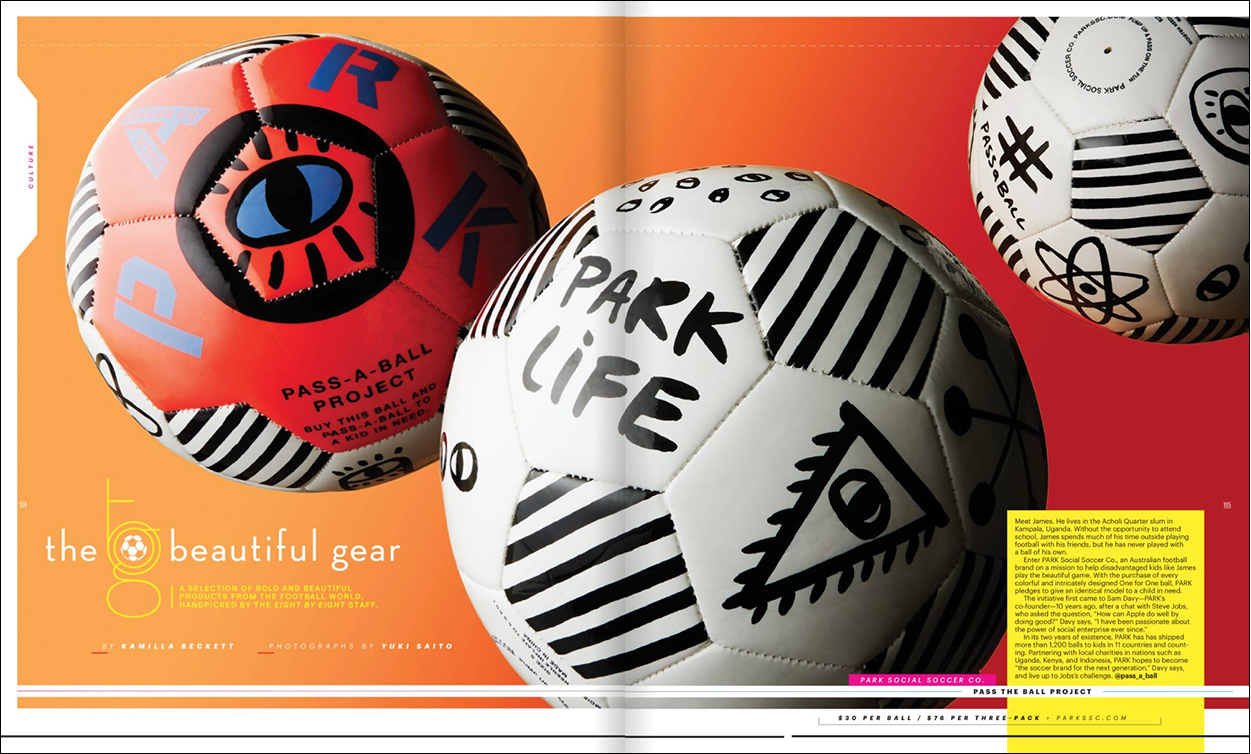
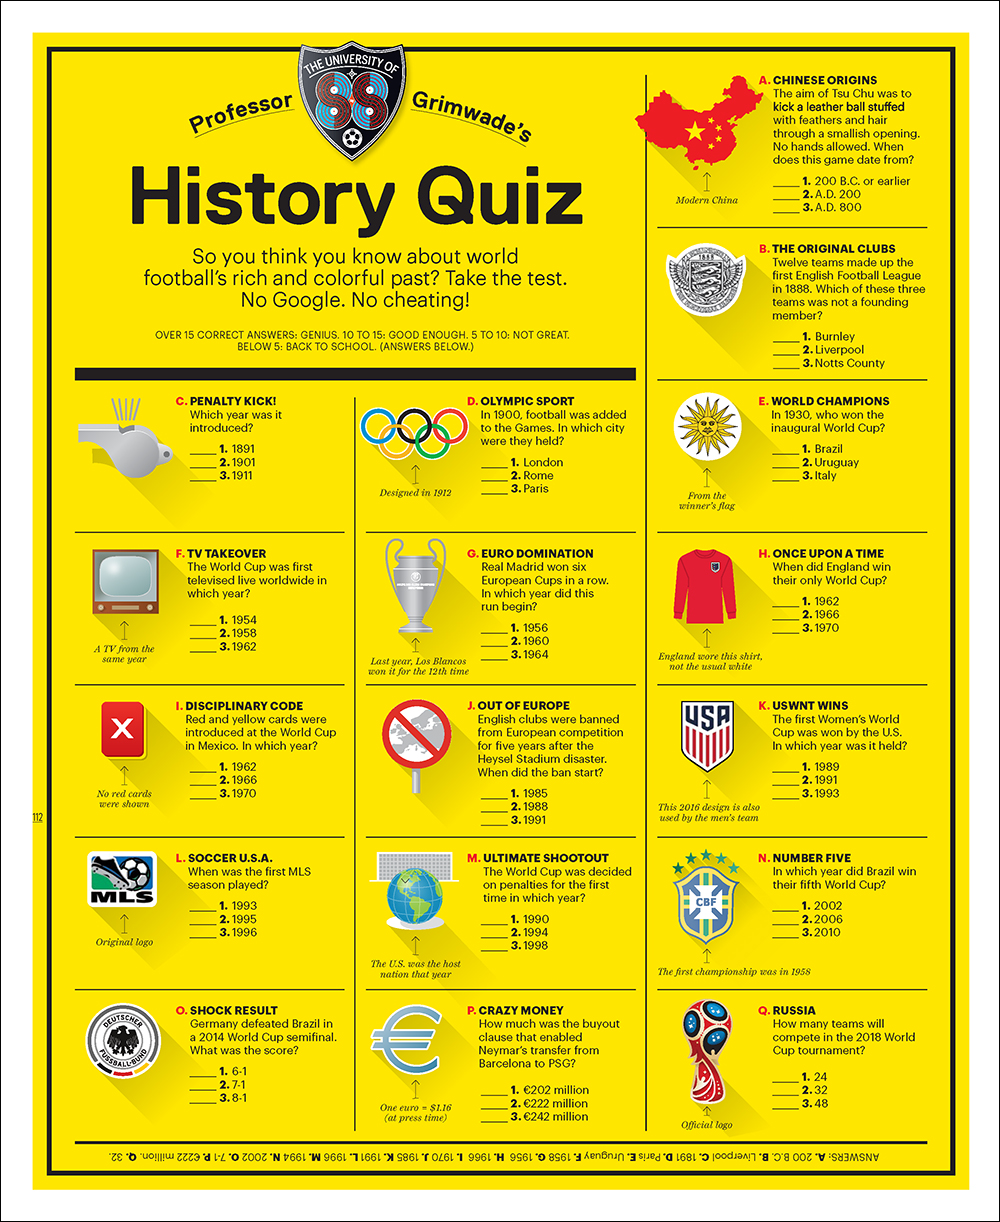
Time for another issue of Eight by Eight magazine, full of great content for the football (soccer) fan. Design and illustration of peerless quality is expected now, and here it comes. Below, some spreads from the issue. Subscribe here: https://shop.8by8mag.com/collections/subscribe

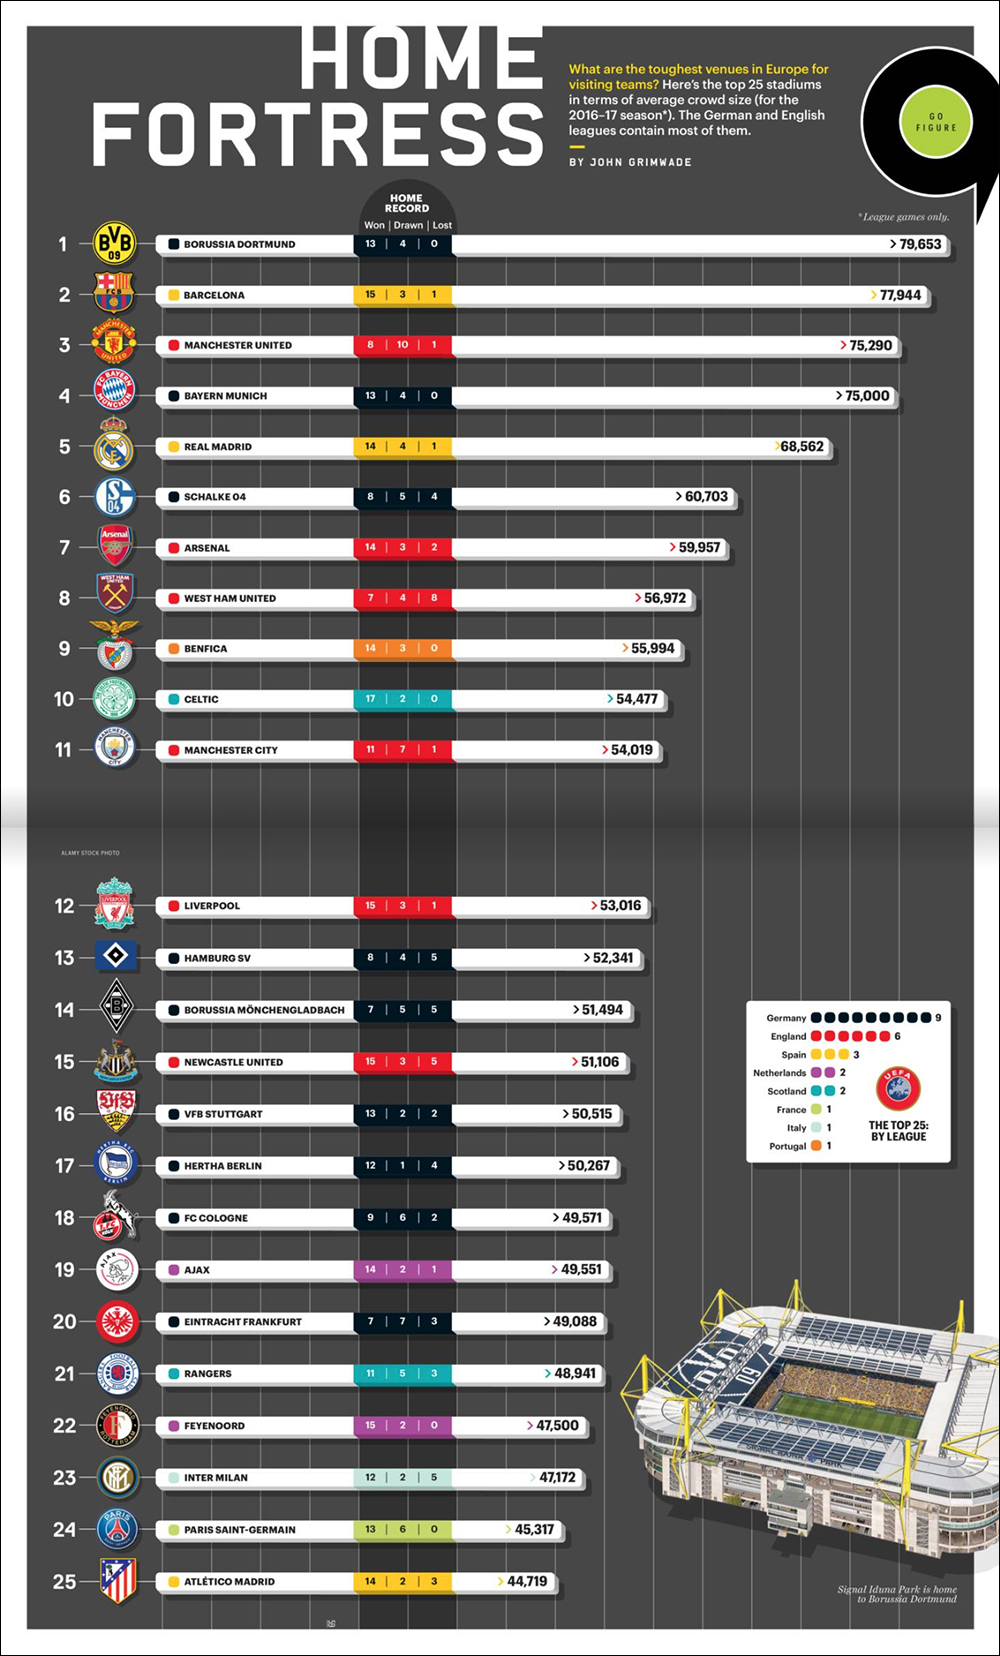
Below is a very big bar chart about the best supported teams in Europe that I put together for this issue. (A thank you to the super-talented Grace Lee for design improvements.)

Professor Grimwade, from the University of Eight by Eight, doing his teaching thing. Pay attention, no cheating!

Leonardo who?

THE FIRST, AND THE GREATEST, GRAPHICS DIRECTOR

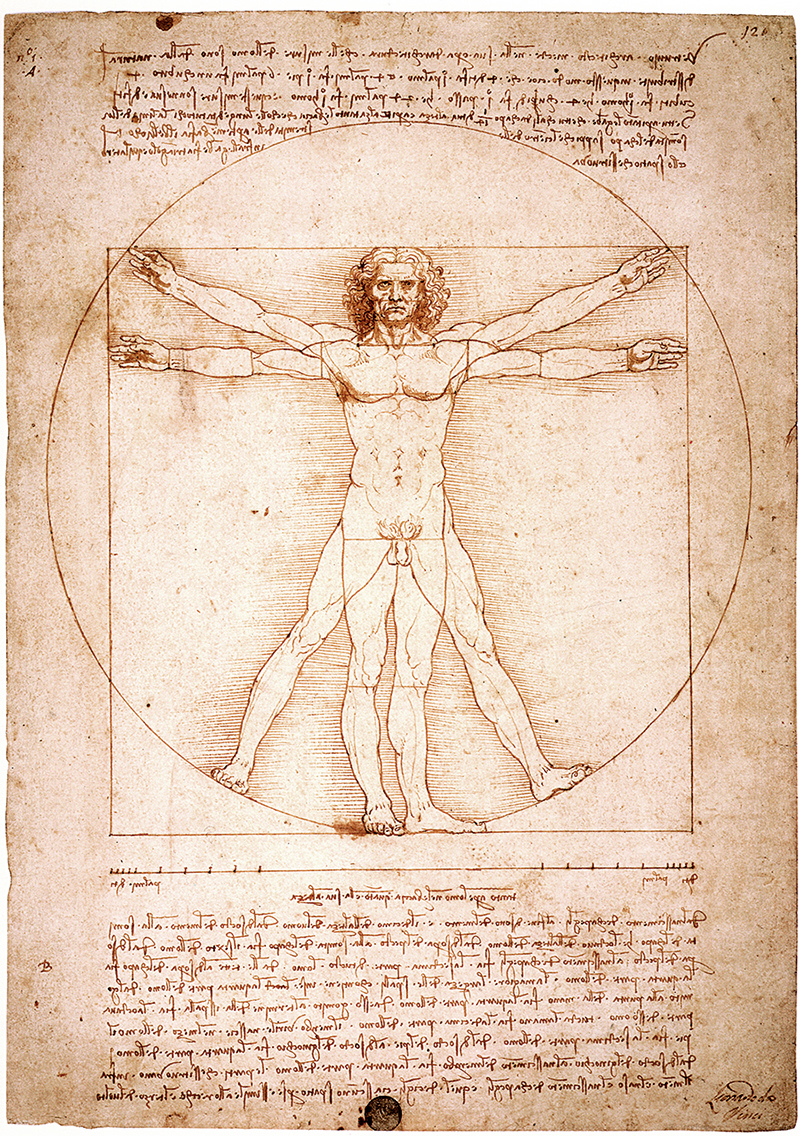
Leonardo da Vinci (1452–1519) was so ridiculously multi-talented, that it’s hard to believe he existed. Leonardo often wrote backwards for reasons that are not entirely clear, perhaps as he was left-handed, it meant that he didn’t smudge the ink. Anyway, a genius of his magnitude can do whatever the hell he wants. The Vitruvian Man (above) is just one of many iconic images Leonardo created (the Mona Lisa is top of that list). The drawing is based on the relationship of ideal human proportions to geometry, as described by the Roman architect, Vitruvius, who considered them to be fundamental to classical architecture.
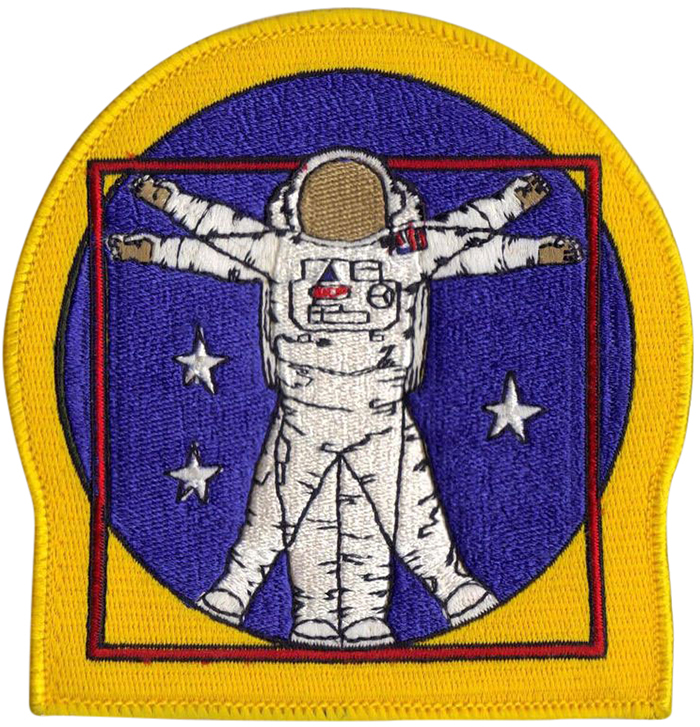
References to the Vitruvian Man appear all over the place. An example: NASA’s extravehicular activity (EVA) arm patch.

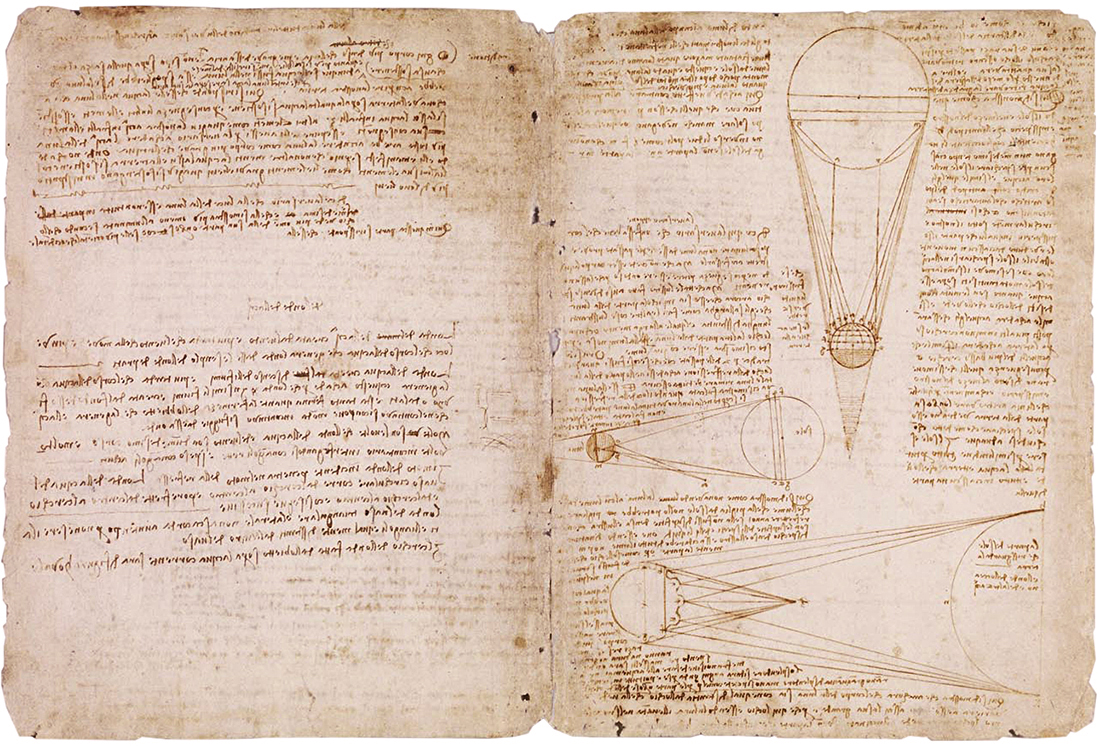
From the Codex Leicester (also known as the Codex Hammer), which is owned by Bill Gates. 18 sheets of paper full of ideas and observations about topics like water, geology, and light from the moon.

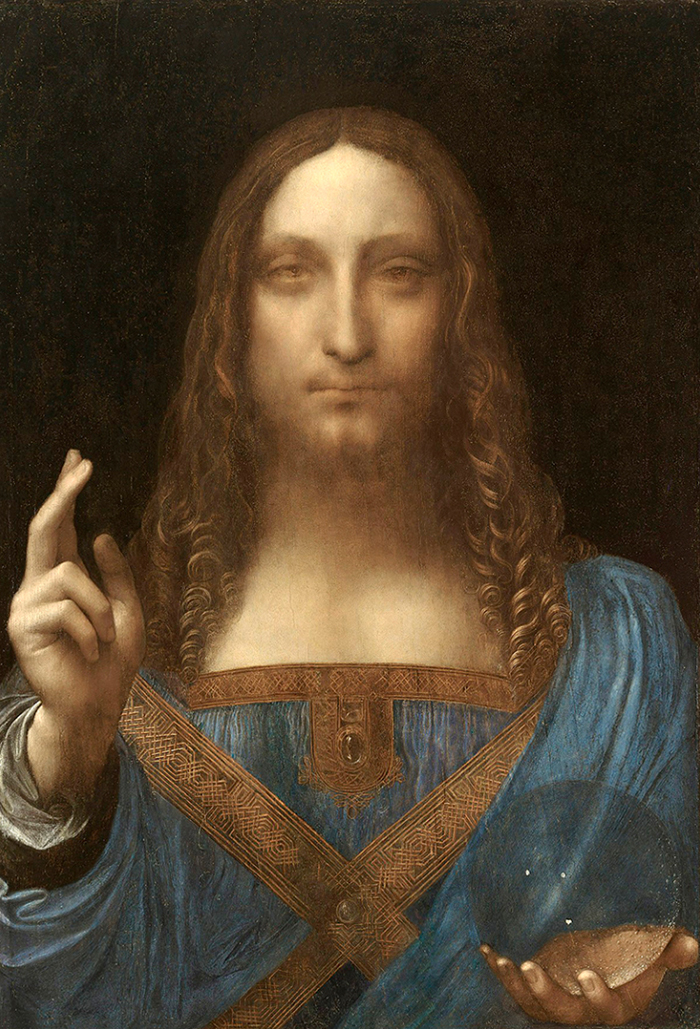
“Salvator Mundi,” sold for $450.3 million on November 15, which is a new world auction record for any piece of art.

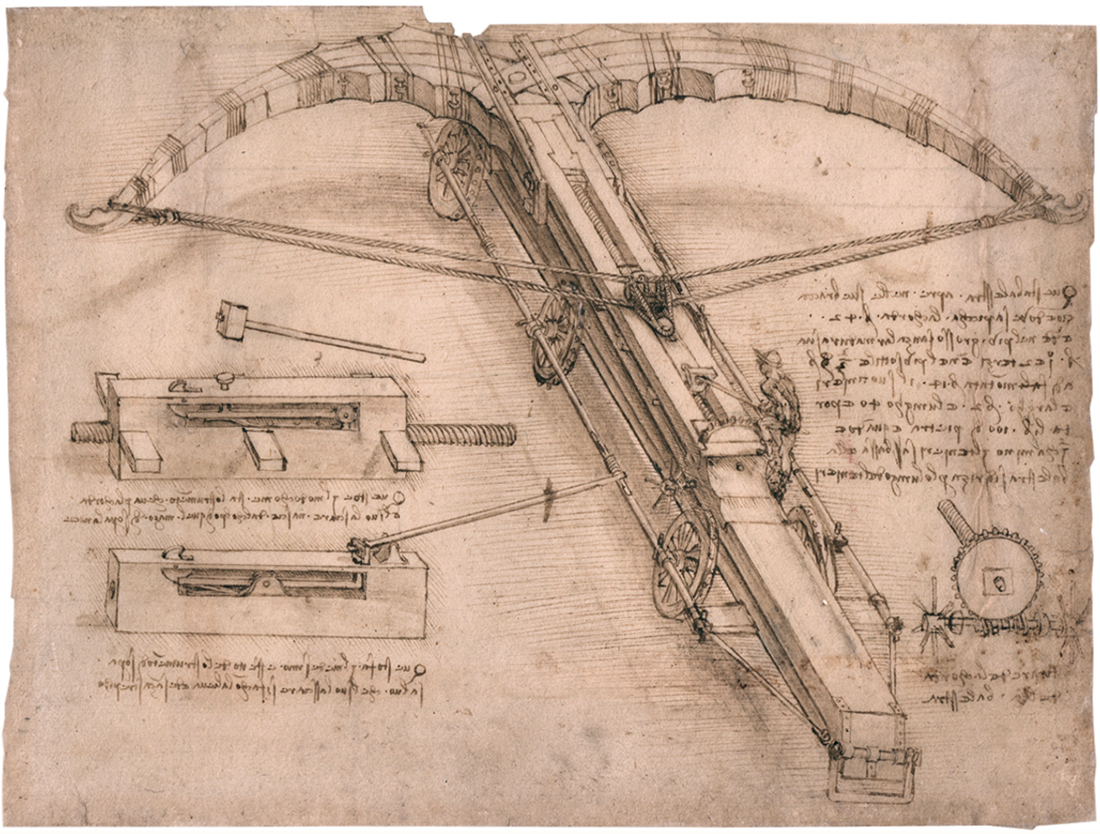
We all know about Leonardo’s many inventions: flying machines, solar power etc. In an era of conflicts all over Europe, it’s not surprising that war machines were on his mind. Hence this design for a giant crossbow. Note the size of the operator.

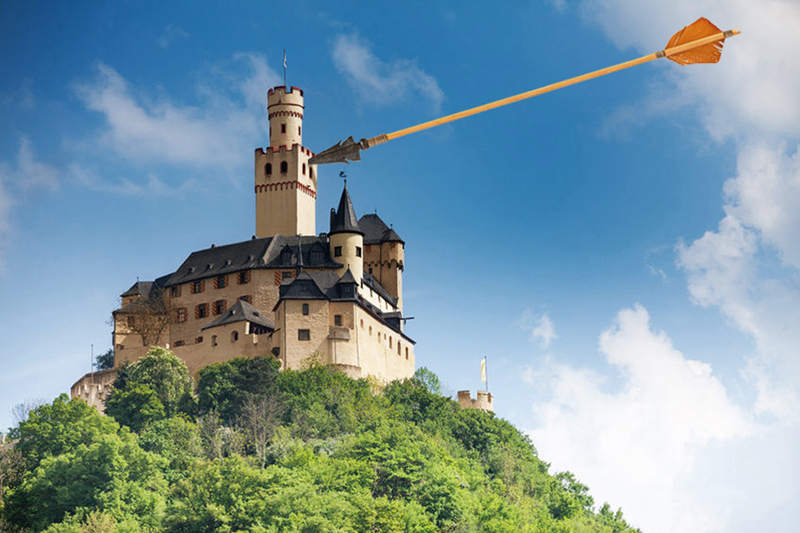
Had this weapon ever been put into use, the results would have been interesting.

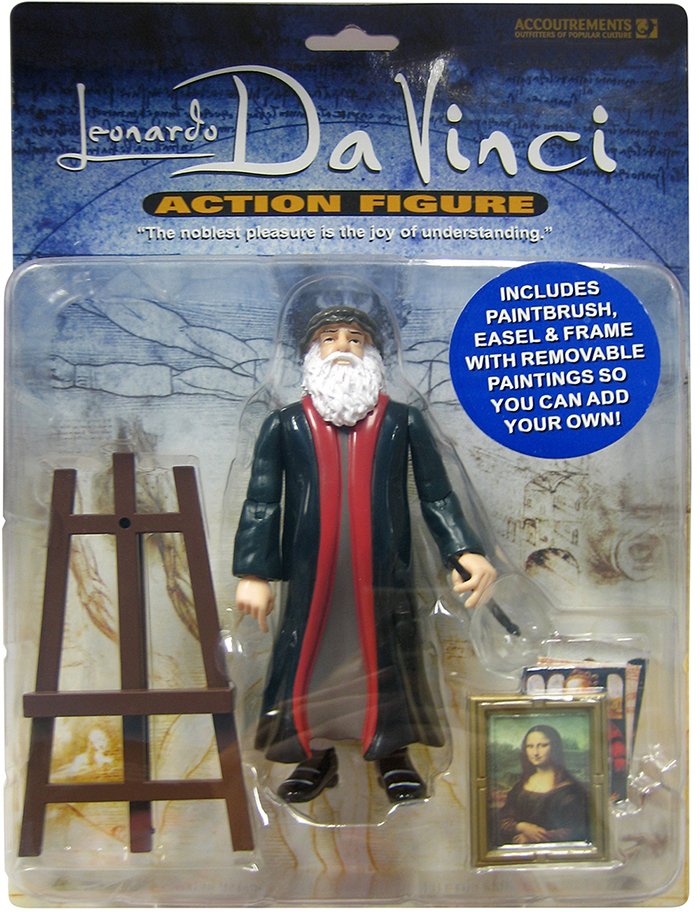
Perhaps it’s time to get your Leonardo action figure. The quote on the box says it all.

Photographs above © Sergey Novikov/123rf, Burmakin Andrey/123rf

Color wheels

TRADITIONAL THEORY FOR ARTISTS AND DESIGNERS.

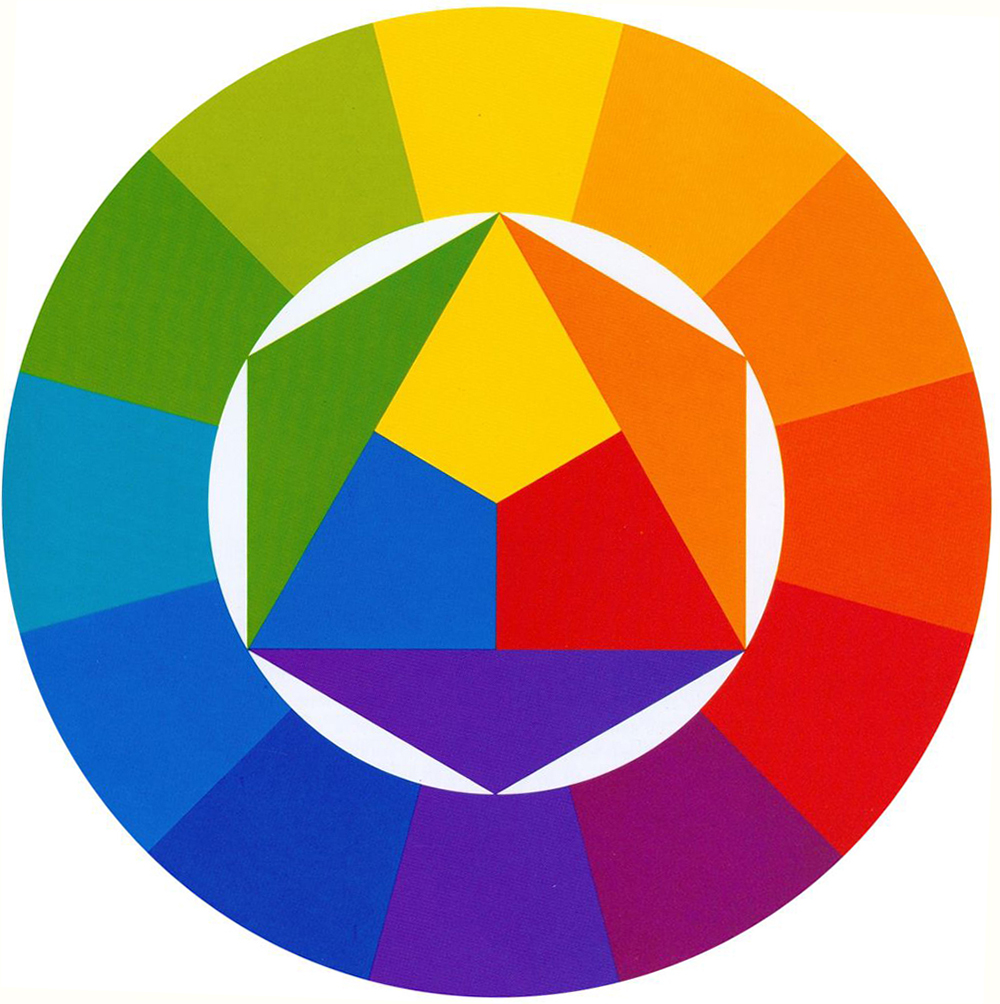
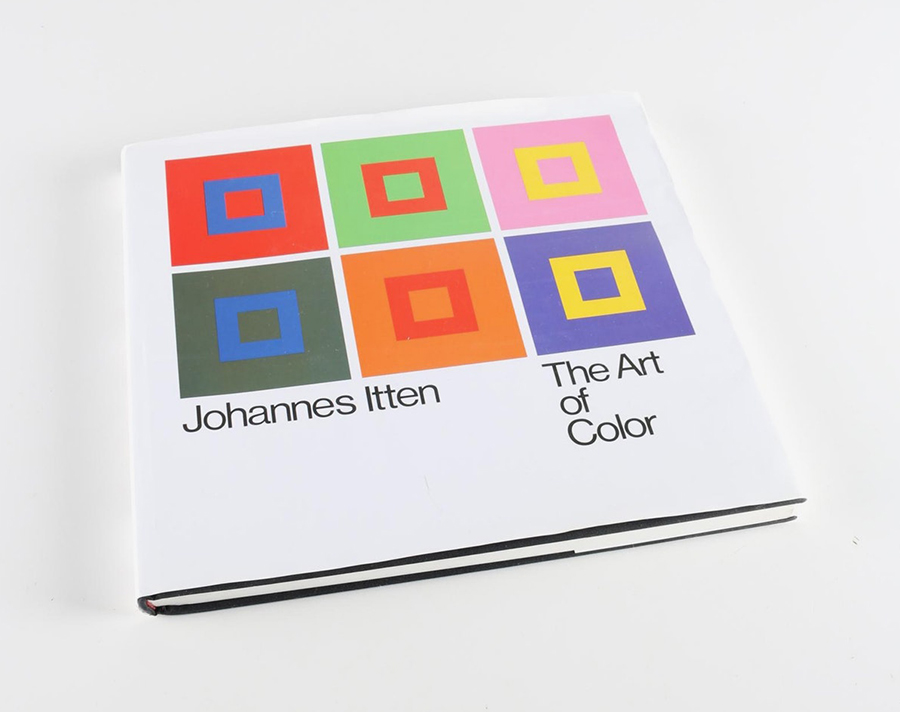
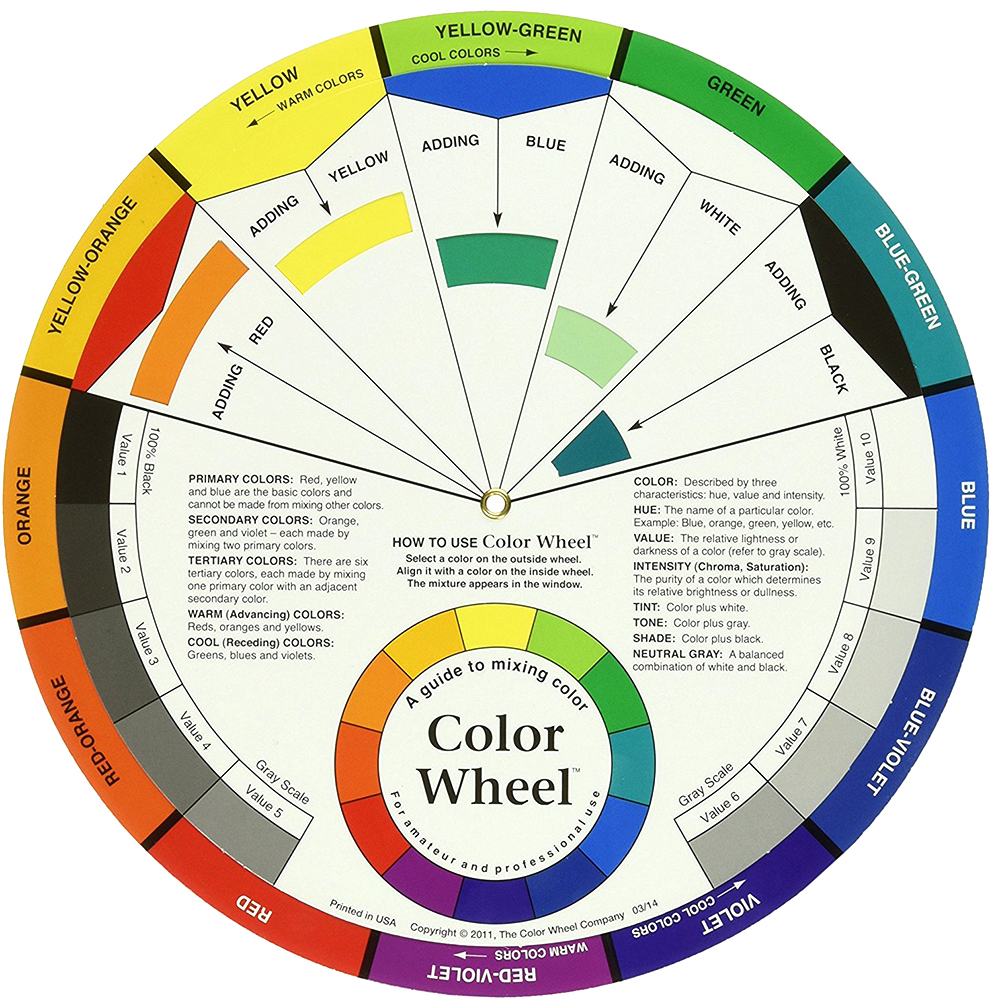
Above,“Farbkreis” from “The Art of Color” (1961), by Johannes Itten, a Swiss painter and theorist who taught at the Bauhaus. This 12-hue circle is made up of three primary, three secondary and six tertiary colors.

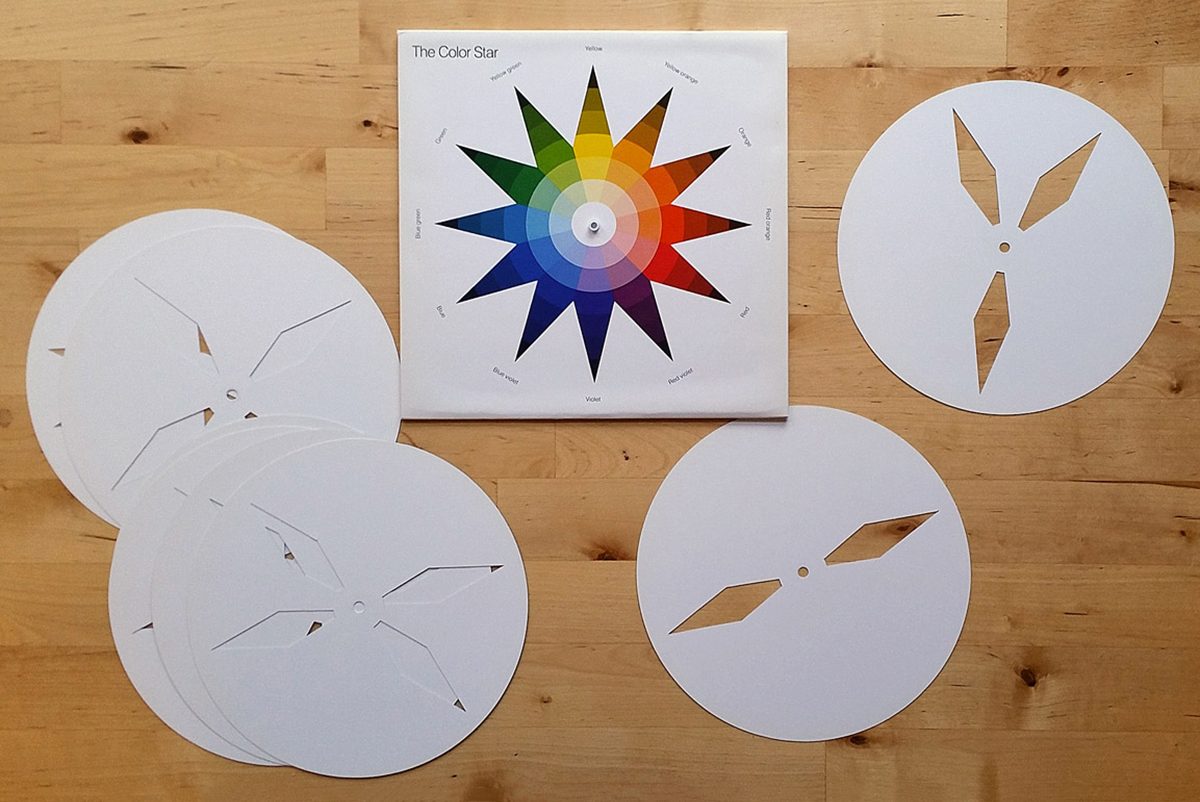
“The Color Star” (1986) has eight disks with cut-outs that can be rotated over Itten’s star to compare colors.

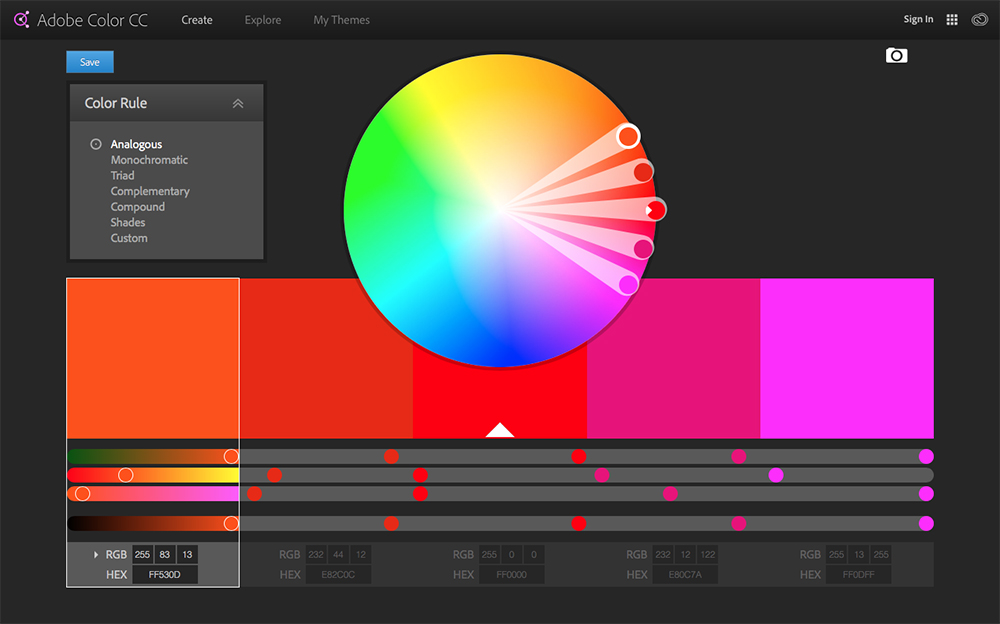
Now we have so many excellent digital color aids, like Adobe Color: https://color.adobe.com/create/color-wheel/

But… I still remember art theory classes way back in art college. They were not that easy (we used to moan about them), but in retrospect, it was important knowledge. The basic concepts: primary, secondary, and tertiary colors (primary and secondary mixed). Hue, saturation, temperature, and so on. I know I sound like a dinosaur (and I do certainly fit that description), but I wish my students had a color theory class. These are valuable lessons to learn.

Color Wheel 101: Complimentary colors are opposite each other. Analagous colors are next to each other. White, which represents all color, is in the center.

Some historical examples:

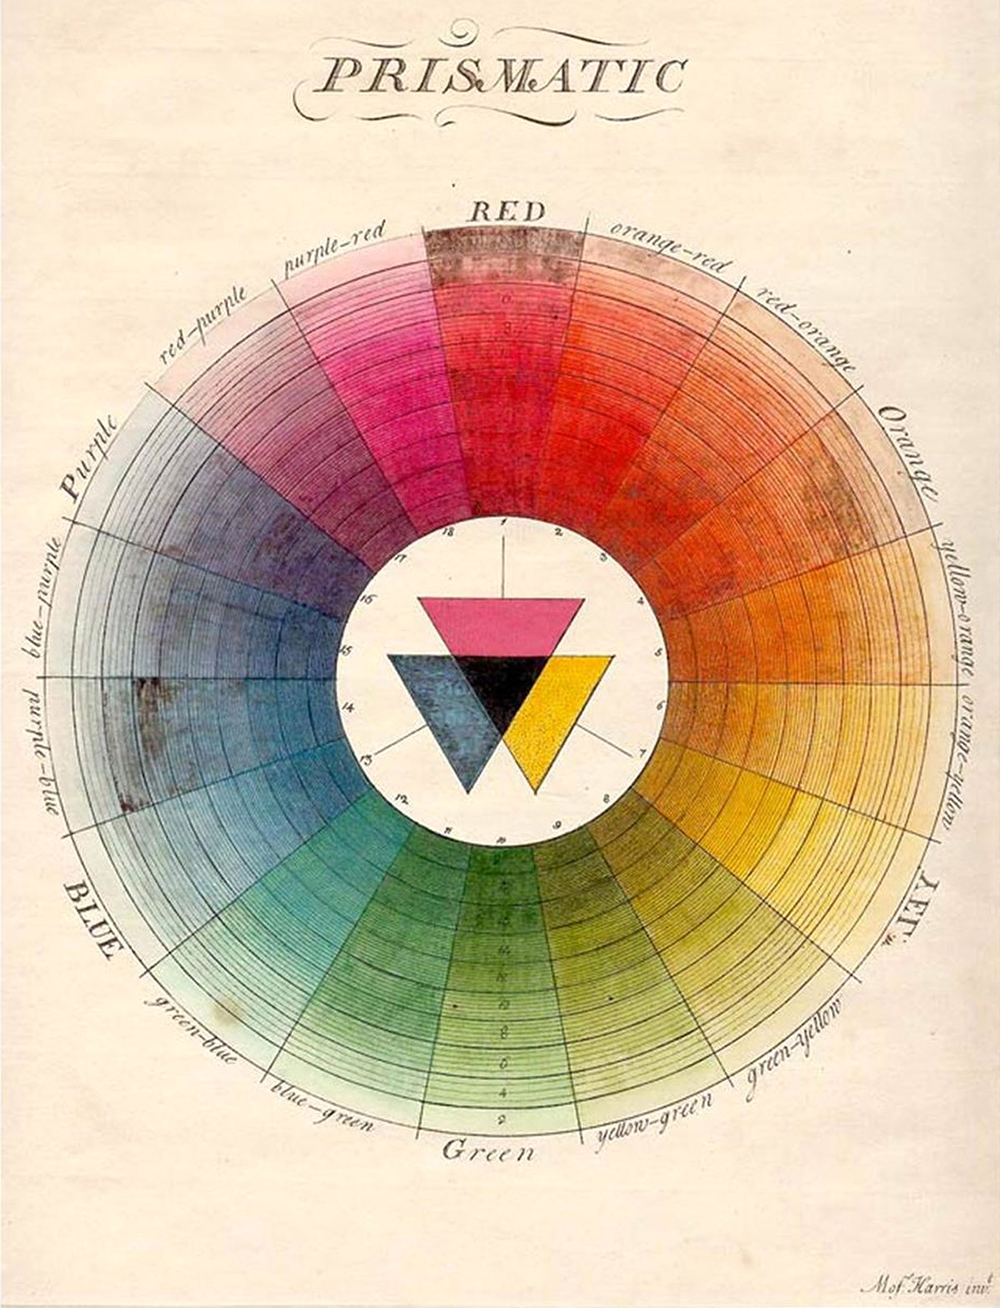
From “The Natural System of Colors” by Moses Harris, 1776.

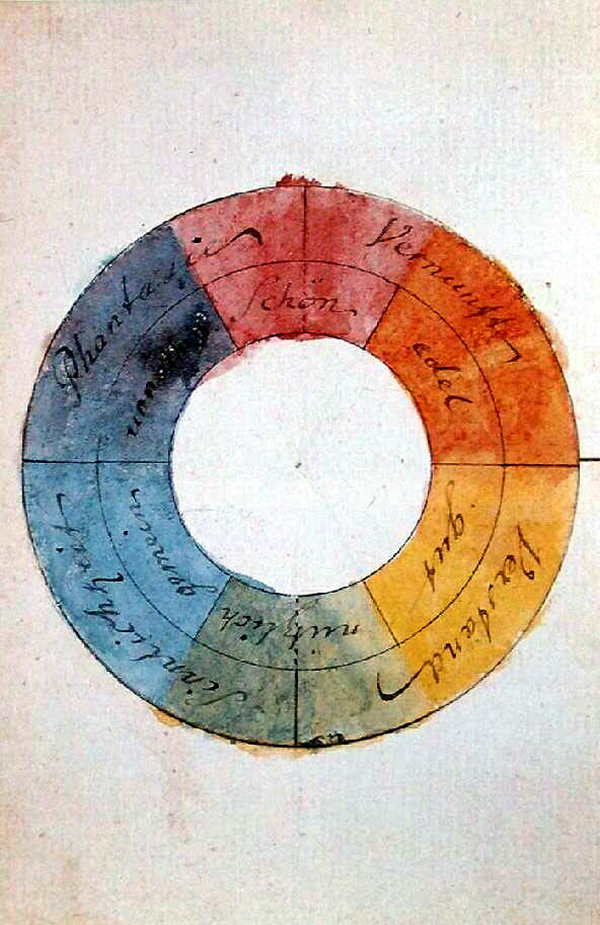
From “Theory of Colors” by Johann Wolfgang von Geothe,1810.

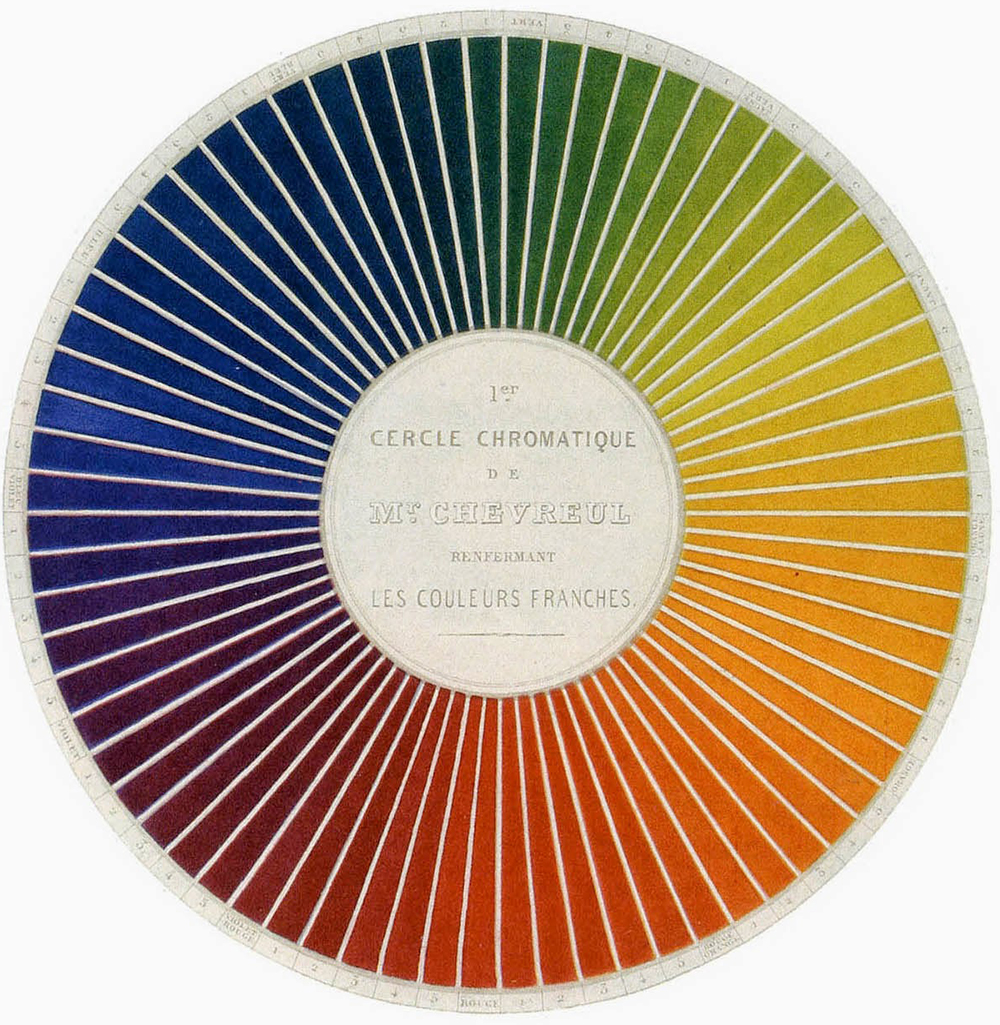
From “The Principles of Harmony and Contrast of Colors” by Michel Chevreul, 1839. A 72-part circle.

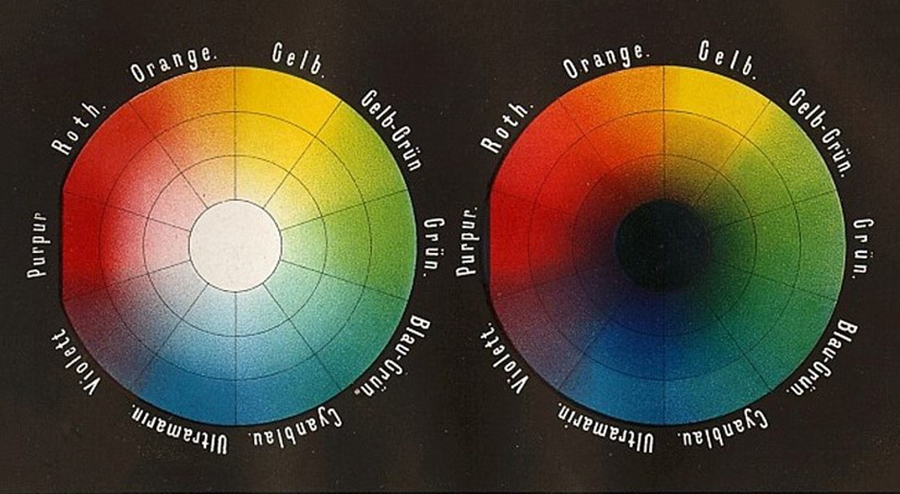
“Color Panel” by Wilhelm von Bezold from “The Theory of Colors in Arts and Crafts,” 1874.

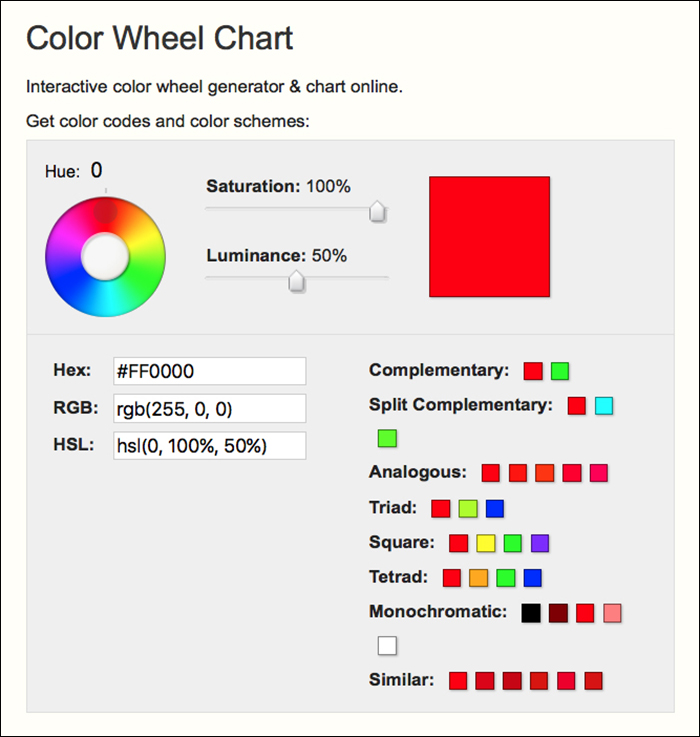
There are many online color wheels like this one, in RGB: goo.gl/xeK49A

And analog ones are available, like this: goo.gl/CQjvDd

A previous post about the color books used to choose CMYK colors in the pre-computer era: https://wp.me/s7LiLW-cmyk

Jack Medway

A CHANGE OF INFOGRAPHIC IDENTITY.

Above, Professor Jack Medway, a leading authority on data visualization and infographics. Below, his famous blog.

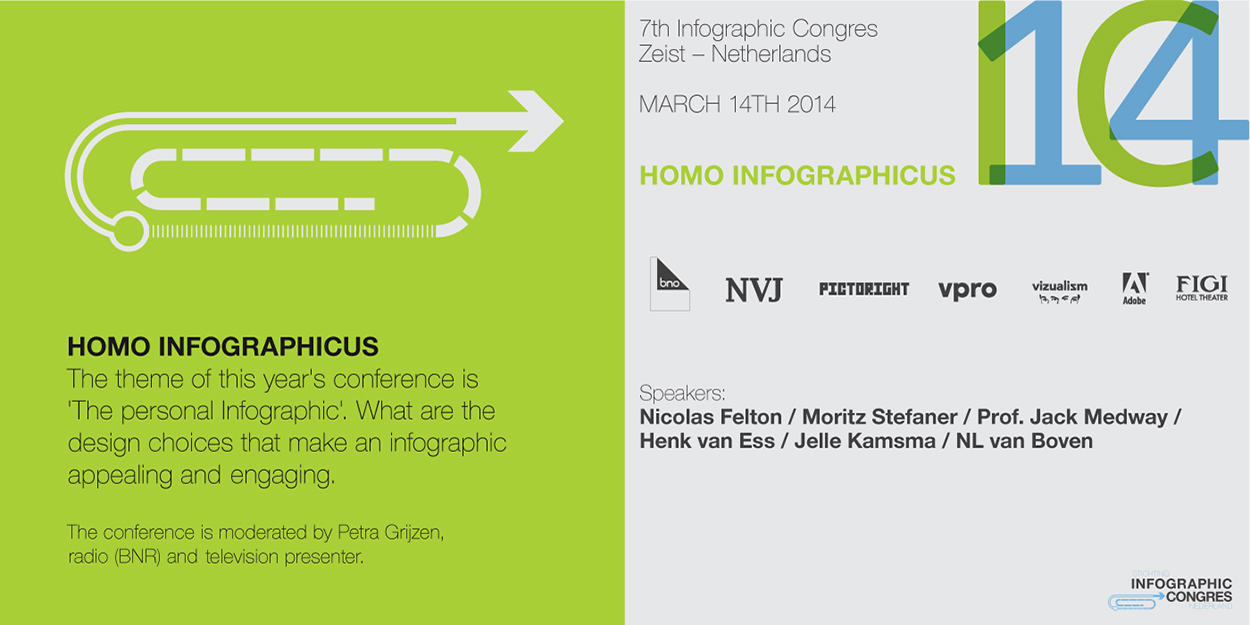
For IC14, the Dutch infographics conference, the organizers decided (correctly) that as I had presented at the six previous conferences, it was time for someone new. Then Frédérik Ruys had the idea that I could still be part of the program if I appeared as someone else. A change of identity began there. Frédérik created a blog so that I could rant on about infographics for a few weeks before the conference. As an opinionated professor from the (fictitious) University for the Graphic Arts in London. The blog title was my chance to make an over-the-top statement, which later became the more focused “Infographics for the People.”
It’s still online: http://www.jackmedway.co.uk

There was even a Facebook page for Jack.

Below, the conference program, with two very big data viz names in front of me.

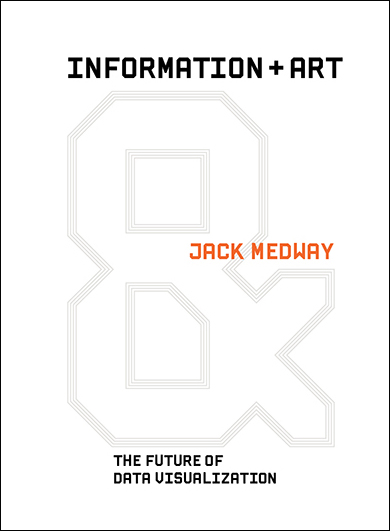
I promoted a fake yet-to-be-published book: “Information and Art” on the blog…

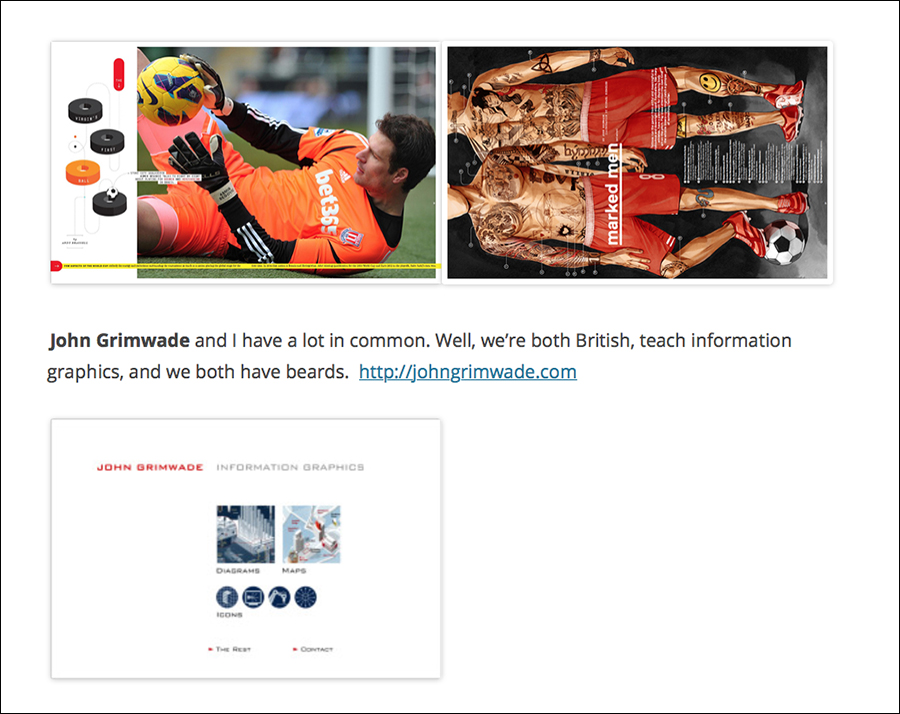
…and referred to my real self in one of the posts.

On the day of the conference, I appeared on stage after being given a new look (and a lot more hair) by a professional makeup artist. A video of the transformation (in reverse) is here: goo.gl/d27R8Q

Some people were fooled, some were skeptical, but it was a lot of fun. I even criticized my real self during the presentation. “I’m sick of hearing Grimwade’s opinions on infographics. What makes him such a big authority?” (To be honest, that has a ring of truth about it, so let’s move quickly on.)

Why Jack Medway? Jack is a form of John, and I lived for a number of years in the Medway Towns, which are a group of towns on the River Medway in Kent, a county in south-eastern England.

UGA is a reference to UCA, the University for the Creative Arts, which is the modern name for the place where I studied Graphic Design. I used Walthamstow Town Hall as a stand-in for the UGA campus. (Photograph by Russ London)

Wall charts

IMPRESSIVE EXAMPLES FROM THE LAST CENTURY.

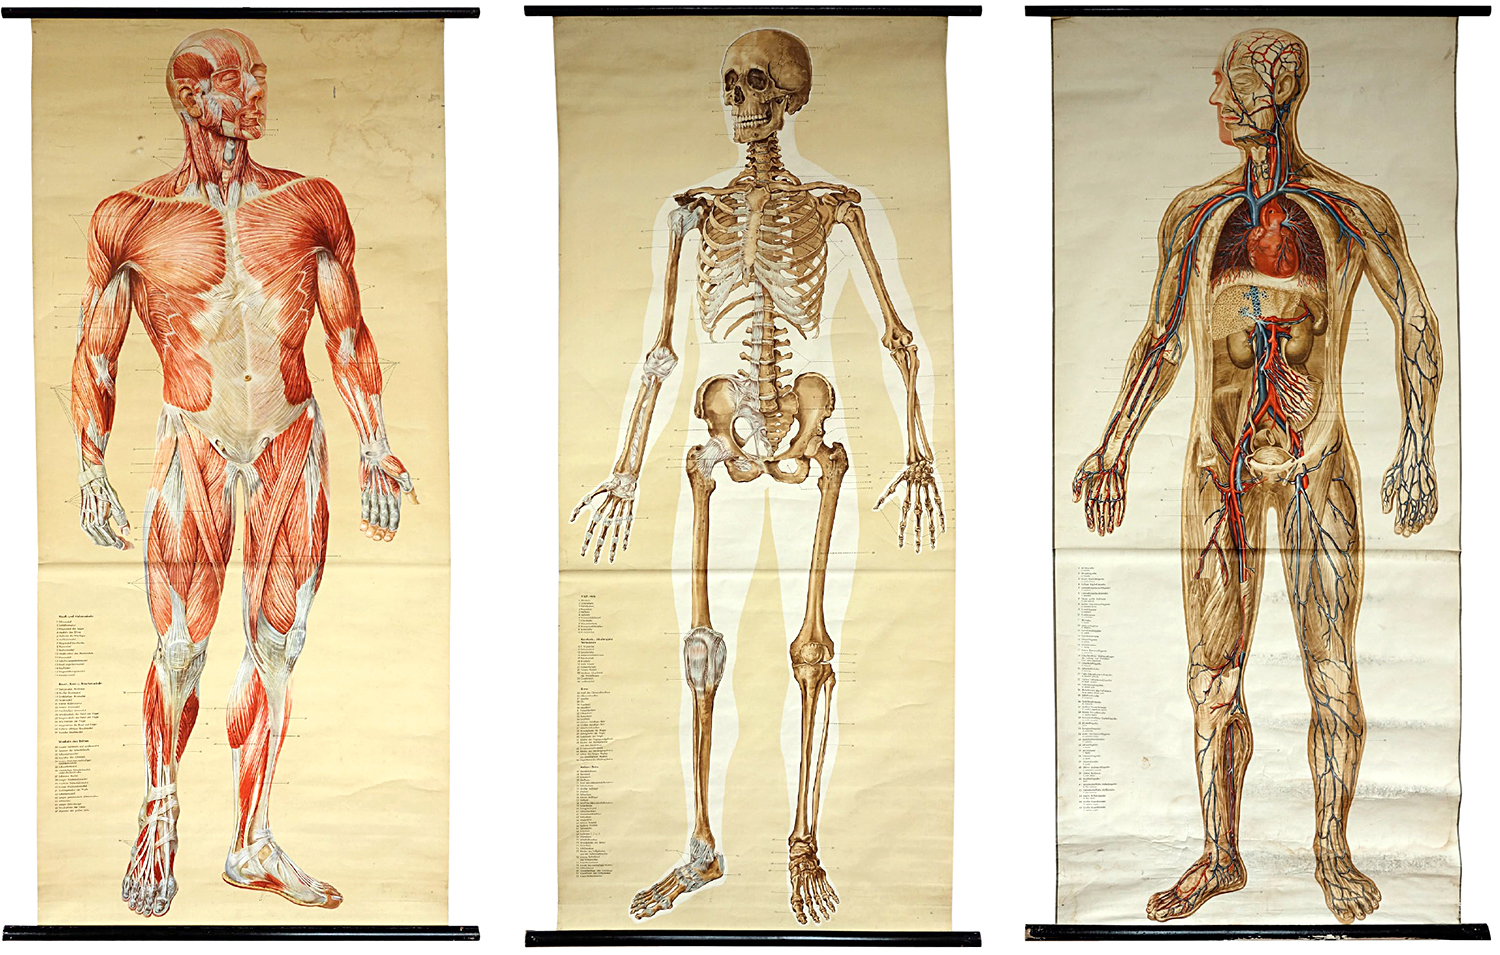
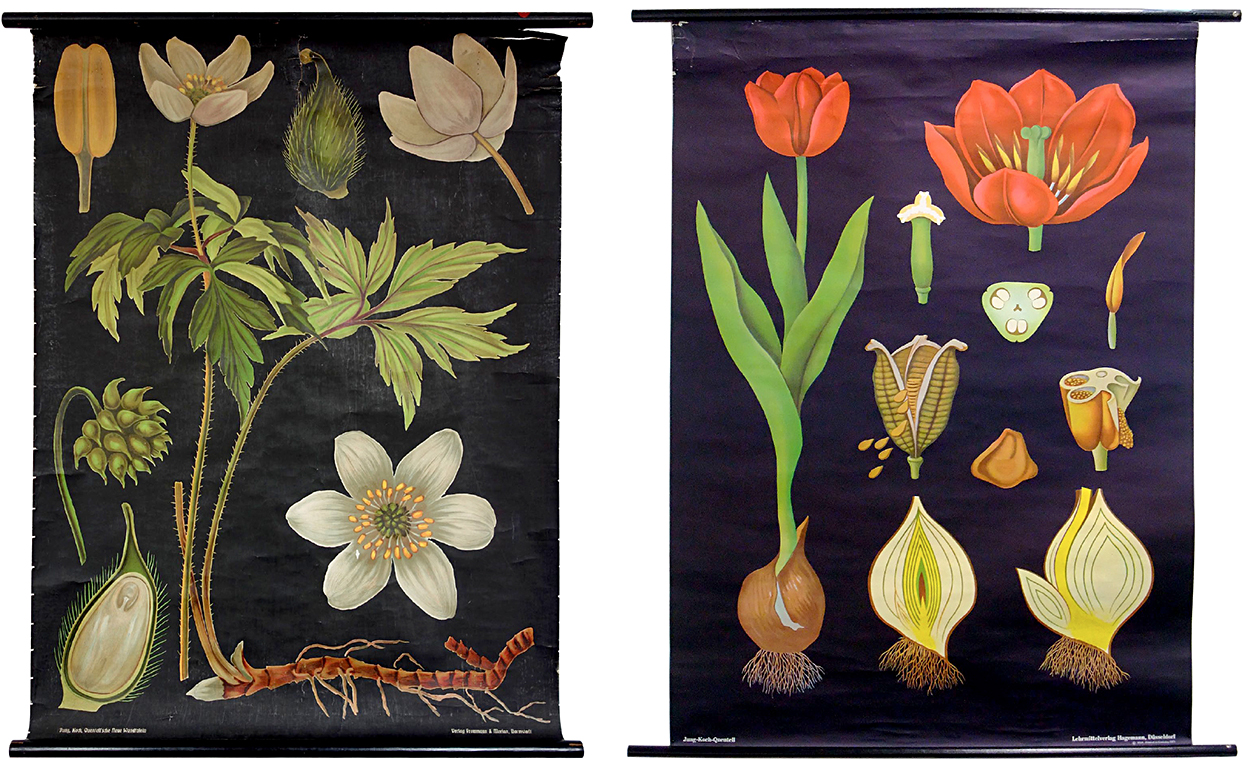
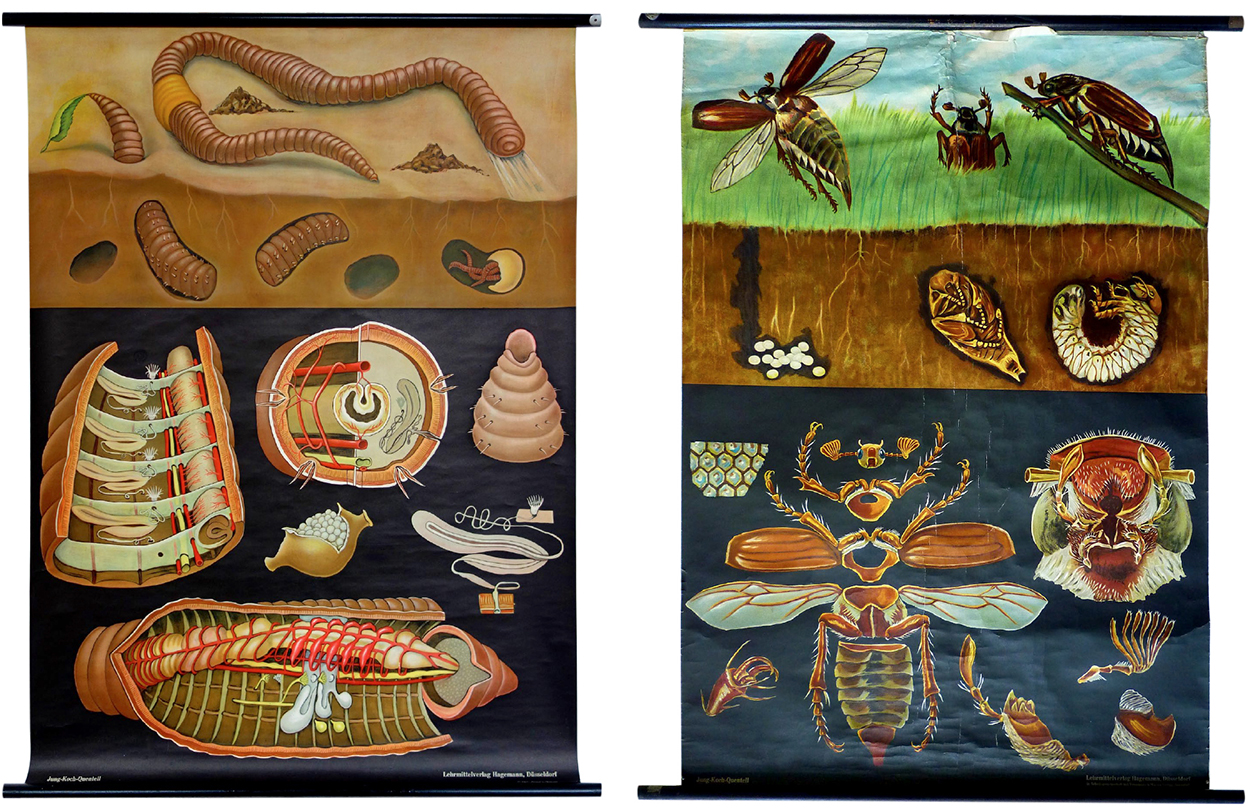
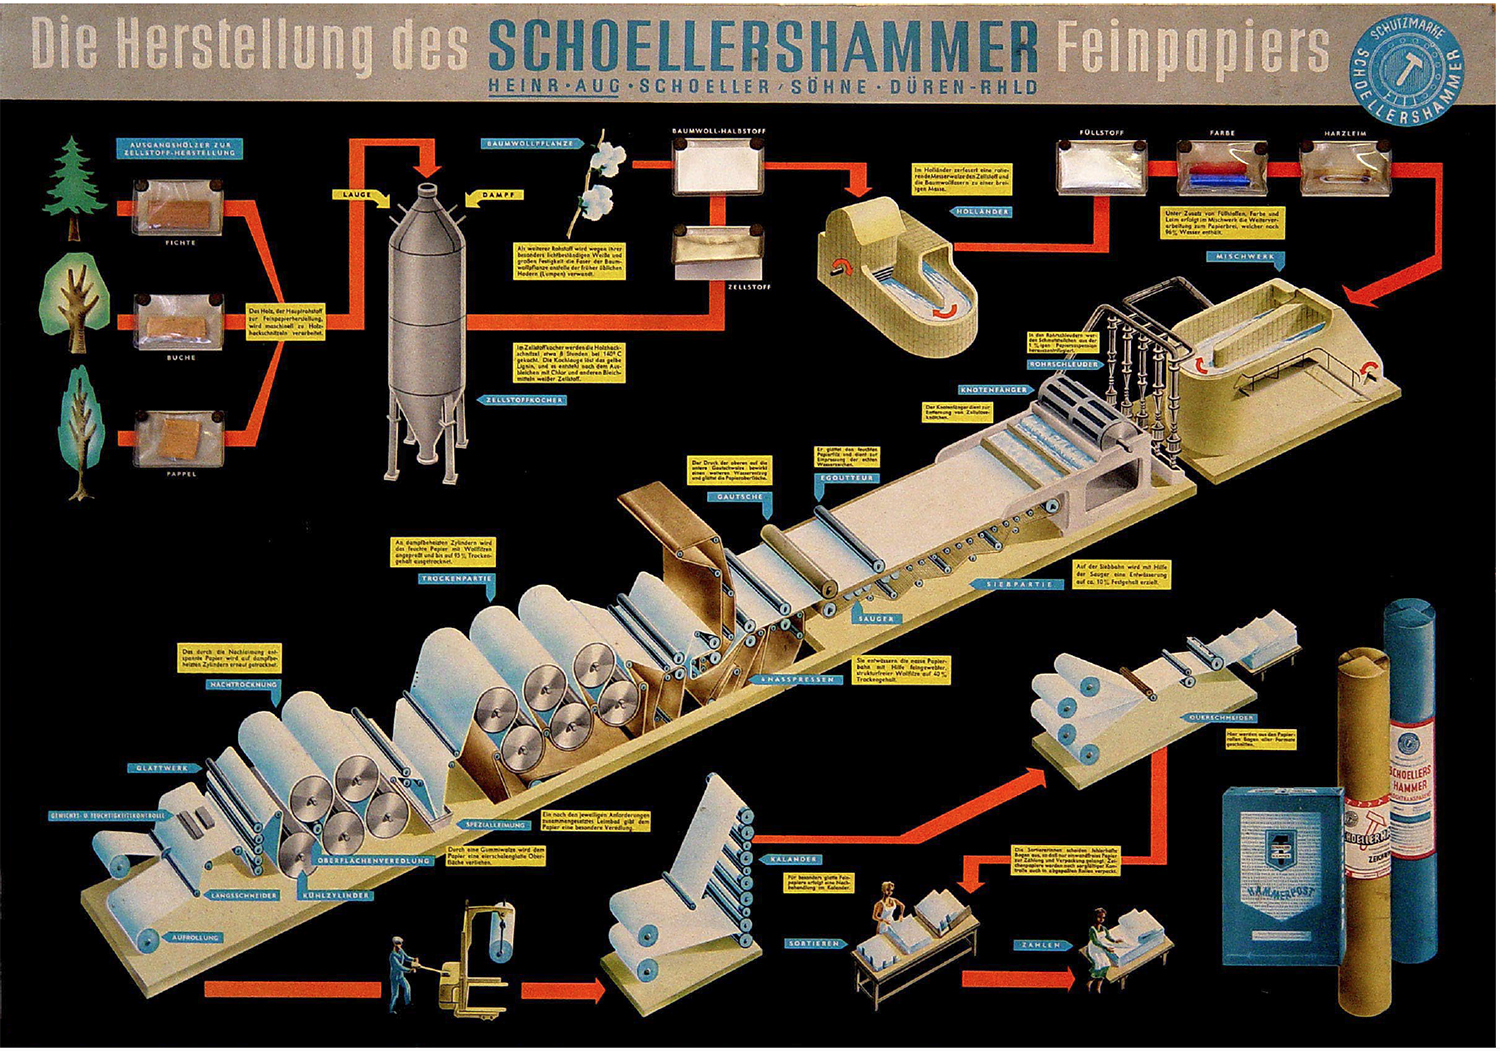
It’s time for another visit to Michael Stoll’s superb collection of historical graphics. Before the computer, these big infographics were essential teaching aids. Of course, their (mostly inferior) descendants are common in classrooms today. I asked Michael for his general thoughts about this genre and some comments about these examples.

“Wall charts are a dying species in an era where everything is digitized and online. This is a shame, because having something physically present in a classroom and encouraging a conversation about it, makes more of an impression than a screen, especially as these charts are so large.

I remember being sent by a teacher to the wall chart room at our school to get a particular example. I spent more time just looking at the other charts (there were a huge number of them) instead of concentrating on the task. As a teacher myself, I often wonder how other teachers used these charts to explain things to their pupils. A wall chart can be seen as a didactic element. It emphasizes visualization over explanation. Wall charts were also used as promotional material by companies, that wanted to enable deeper understanding of their products, or provide background information.”

Anatomy (Shown above) Naturalien und Lehrmittel, Anatomie, Biologie Tanck & Wegelin, Hamburg Altona. c.1950
“These are considered to be the most accurate anatomical charts. While each one will work on its own, I love the effect of the series. The reader can jump between them and make comparisons or draw conclusions.”

Botany (Shown below) Jung, Koch, Quentell—Lehrmittelverlag Hagemann, Düsseldorf. c.1963
“Two rather old examples from the world-famous publisher. While the newer ones are offset printed, the older ones were produced using lithographic printing, which provides a lot of detail. The arrangement is fascinating, in that the chart still works although the parts of the plants are not to scale. This is called adaptive scaling. And the items stand out clearly against the black background.

Insects Jung, Koch, Quentell. c.1963
“The layout is set up in three logical stages: what we normally see (which references what the reader recognizes), what is going on hidden from the human eye (which connects this information to what we normally see), and a very detailed deconstruction of the animal (which has the highest density of information).”

Paper production “Mounted onto stiff cardboard, this chart takes one further step: there are samples of real wood, chemicals and colors sealed in small plastic bags which are attached to the poster.”
(Editor’s note: I’ve used the red line a lot in my graphics: http://wp.me/p7LiLW-IP)

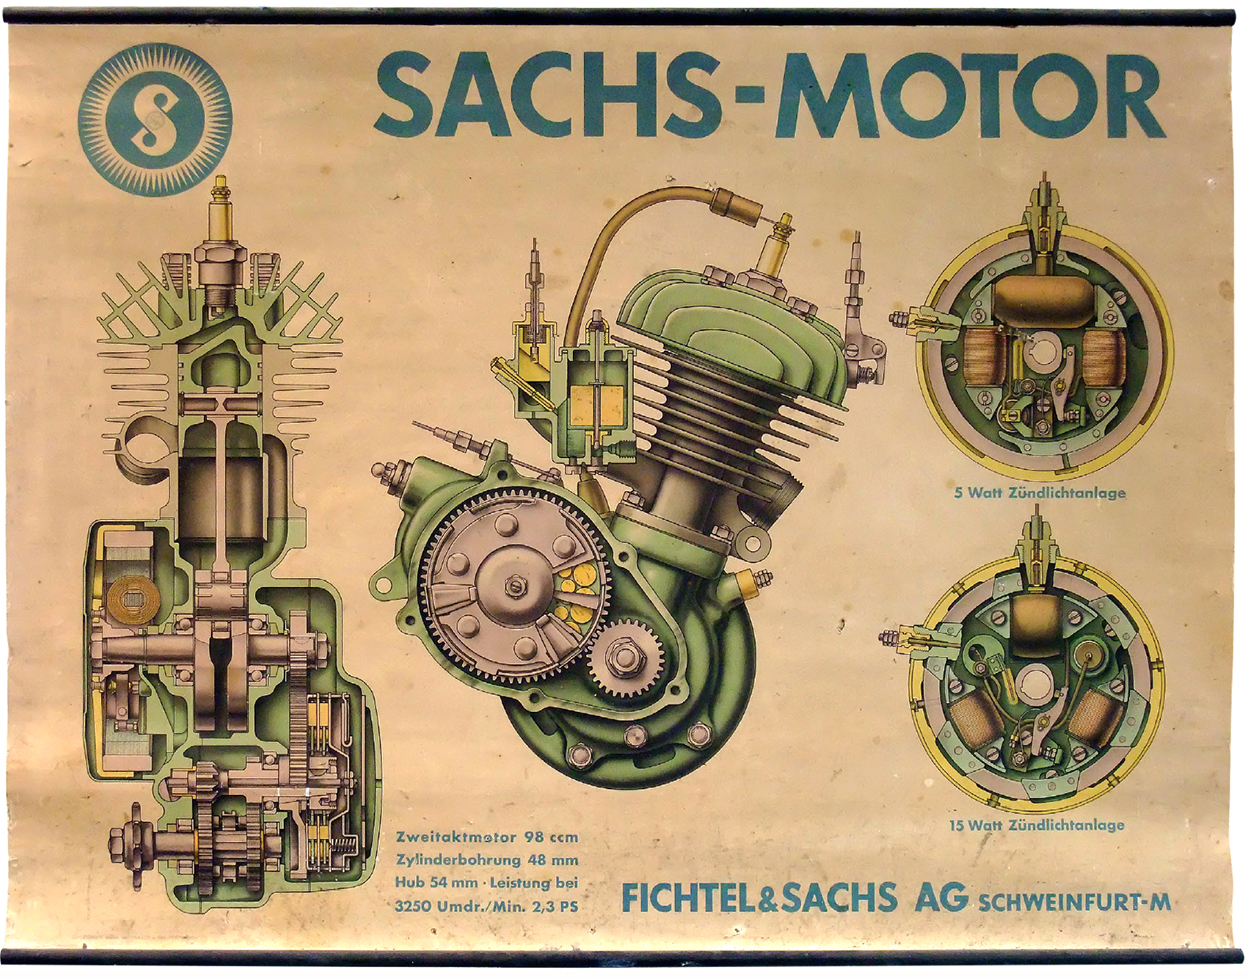
Engine Beautifully rendered, lithographic printing. Larger than actual size. This scaling allows more detail.

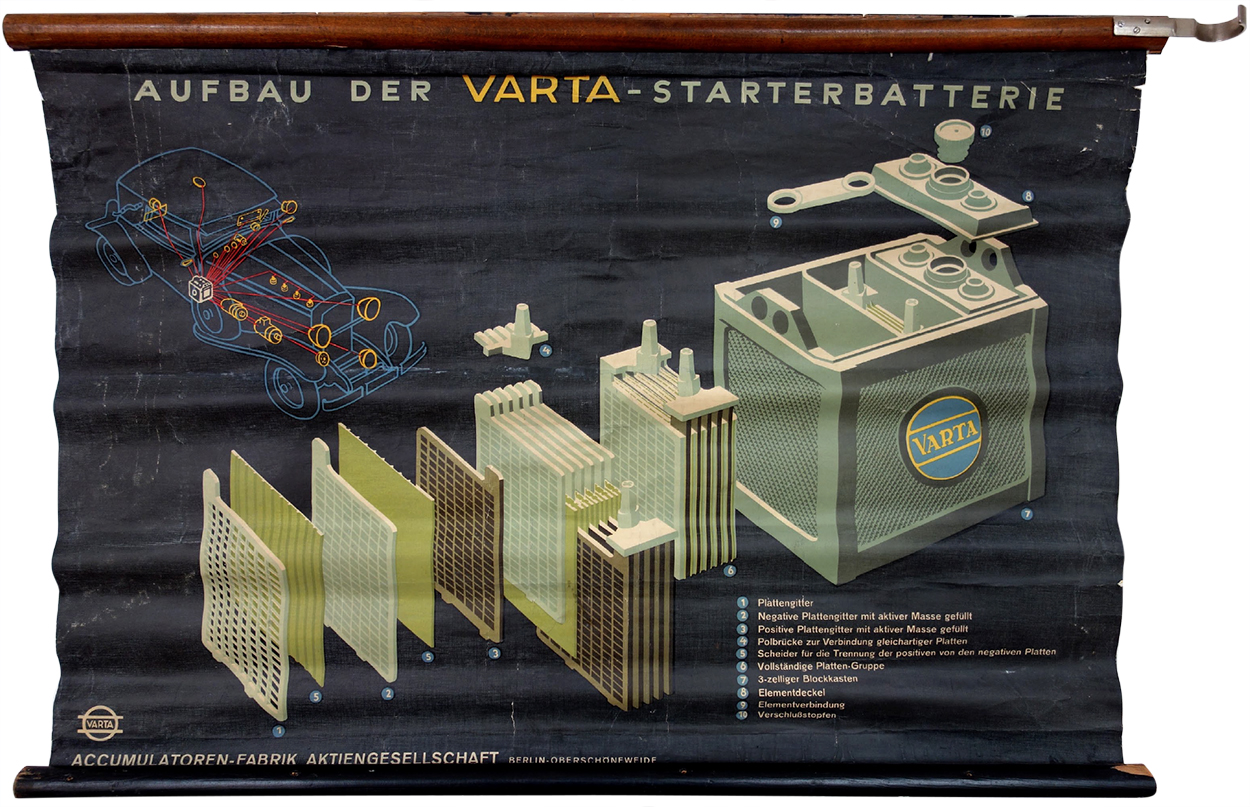
Battery “Also printed using the lithographic process. The car diagram shows the relevance of a battery like this. This chart is a visual depiction of how important electricity was for cars back then.”

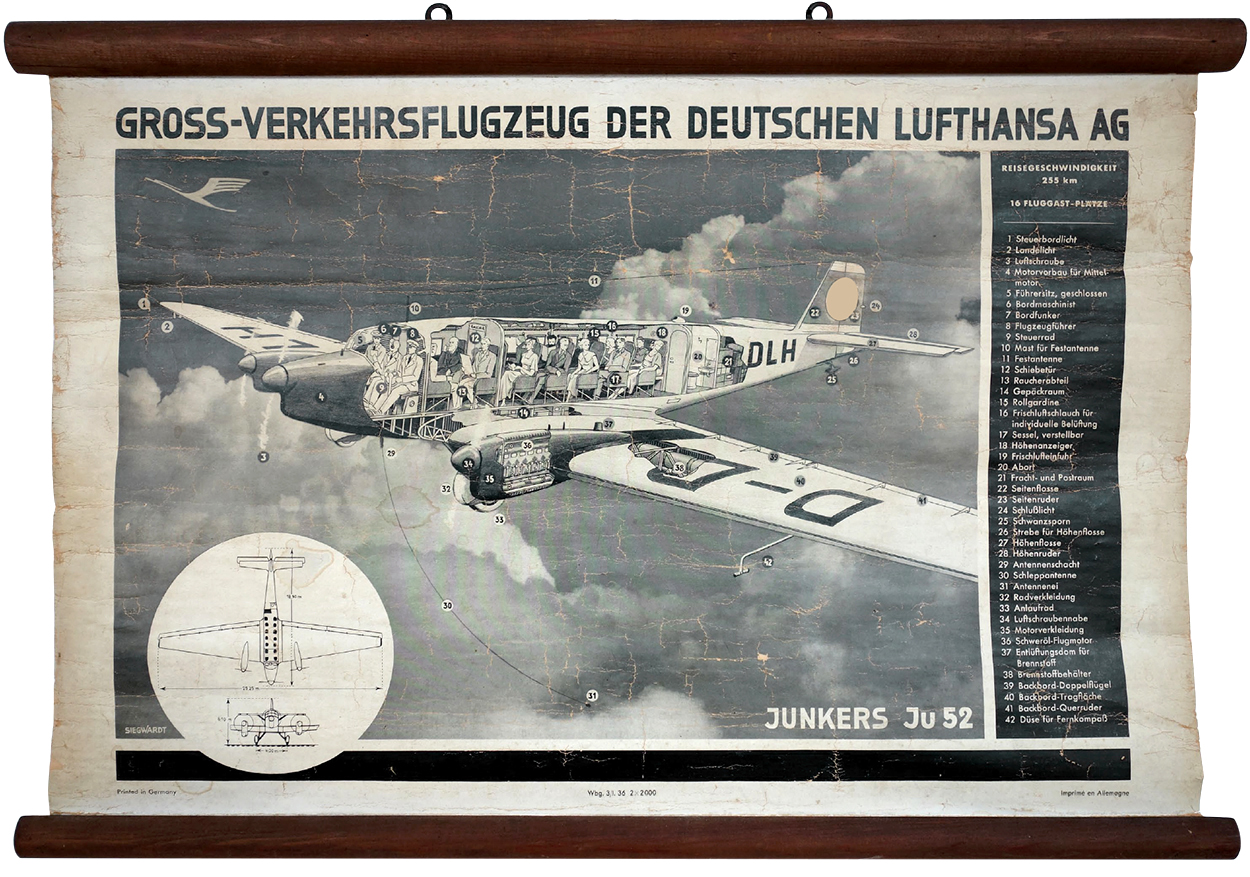
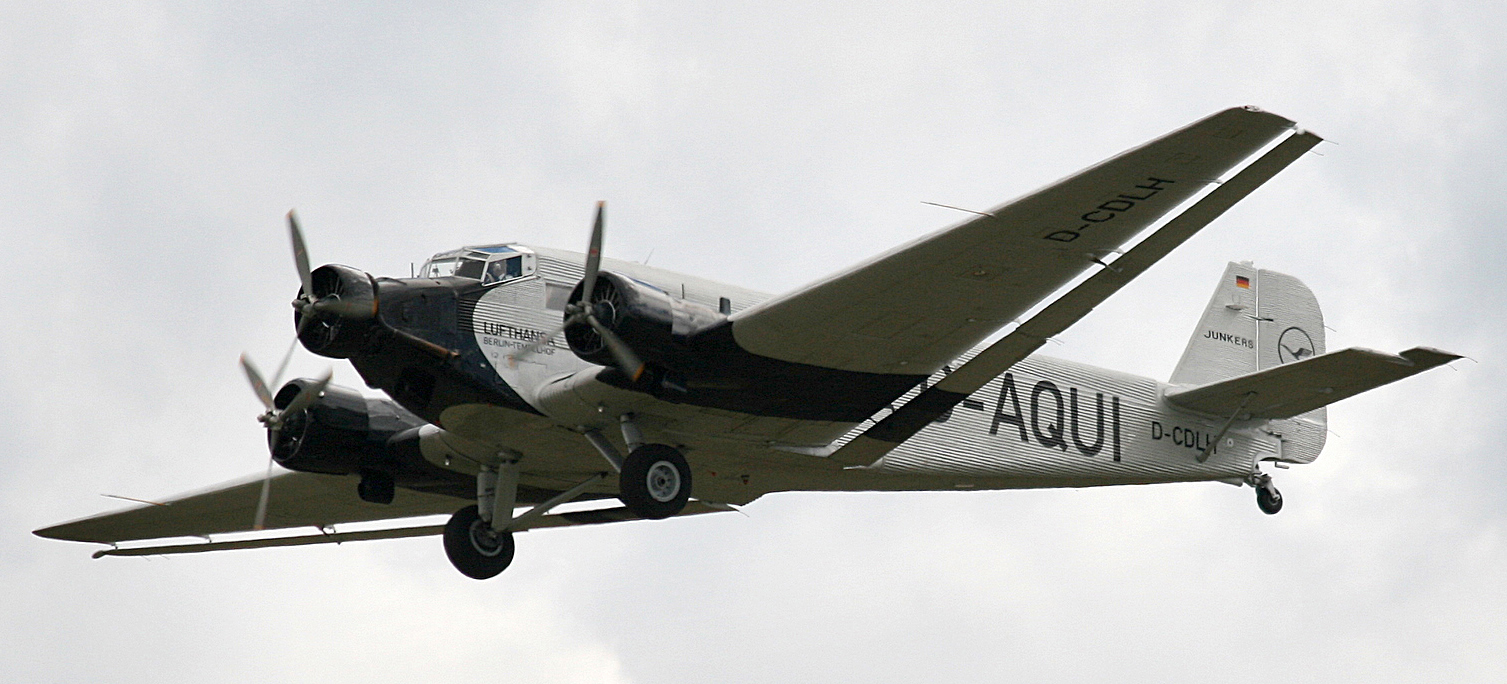
Aircraft “The chassis of this plane was made entirely from aluminum. I followed this example on eBay, and the price skyrocketed. I eventually bought it, but wondered about the high price. So I contacted the manufacturer, and found out that these charts were delivered with the aircraft. And there were only two models with these engines delivered.”

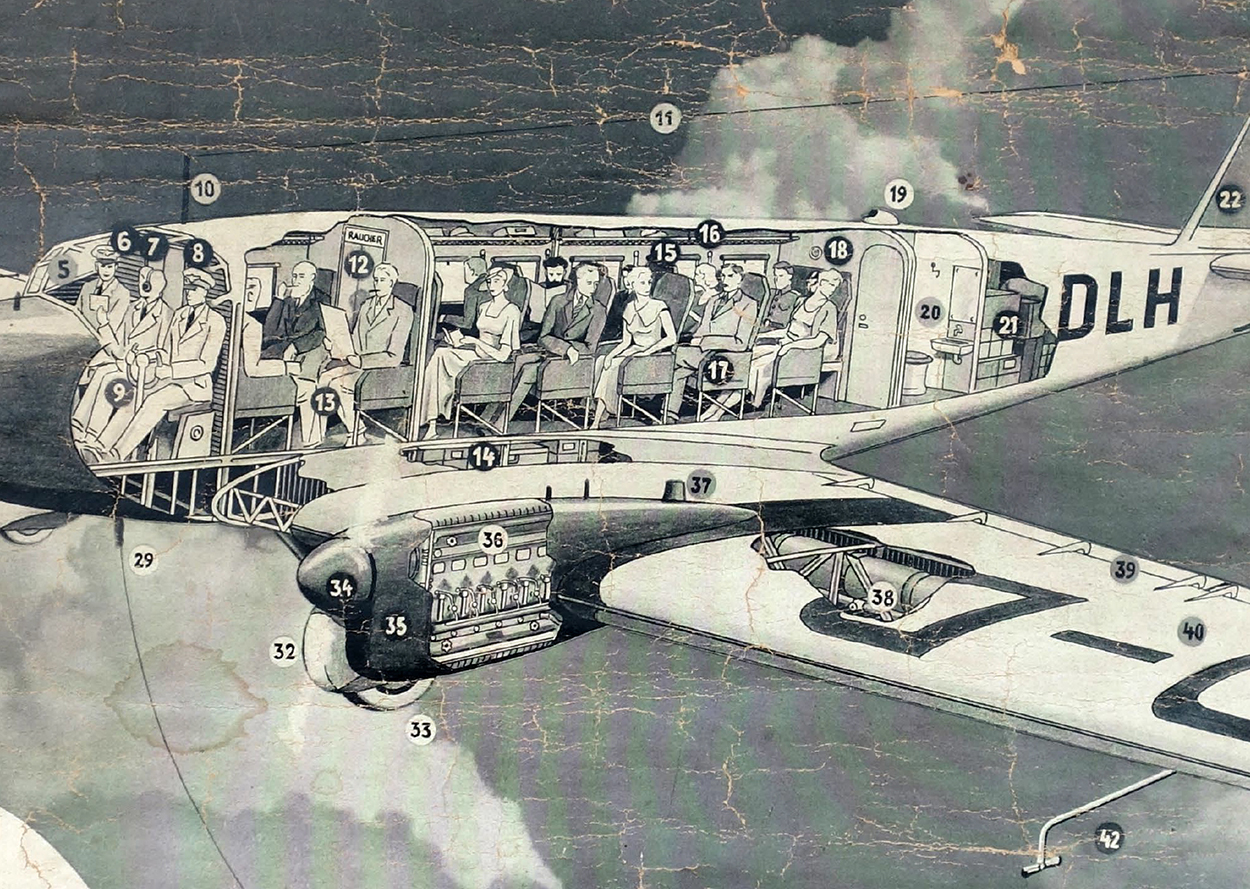
Detail.

The much more common Ju52/m3.


Photograph by Rror.

Previous posts from Michael’s collection:
Eye model: http://wp.me/p7LiLW-1yx
Flap books: http://wp.me/p7LiLW-IV
Flight thru Instruments: http://wp.me/p7LiLW-Rr
Herbert Bayer’s Geo-Graphic Atlas: http://wp.me/p7LiLW-xO
The Atlas to Alexander von Humboldt’s “Kosmos”: http://wp.me/p7LiLW-jO

Michael Stoll teaches media theory and infographics at the Augsburg University of Applied Sciences, where he is head of the information design study track in the Department of Design.

Visual Conceit

CREATIVE VISUAL SOLUTIONS BY ADONIS DURADO.

We’re very fortunate that our Knight Fellow for this academic year is Adonis Durado, whose design and infographics work at the Times of Oman, and several other publications, is widely admired. He currently has a terrific exhibition in our gallery called “Visual Conceit.” Here’s some examples from the show, along with his comments. The selection here has an infographic bias that does not reflect the balance of the show, and of course that’s because it’s on this particular blog.

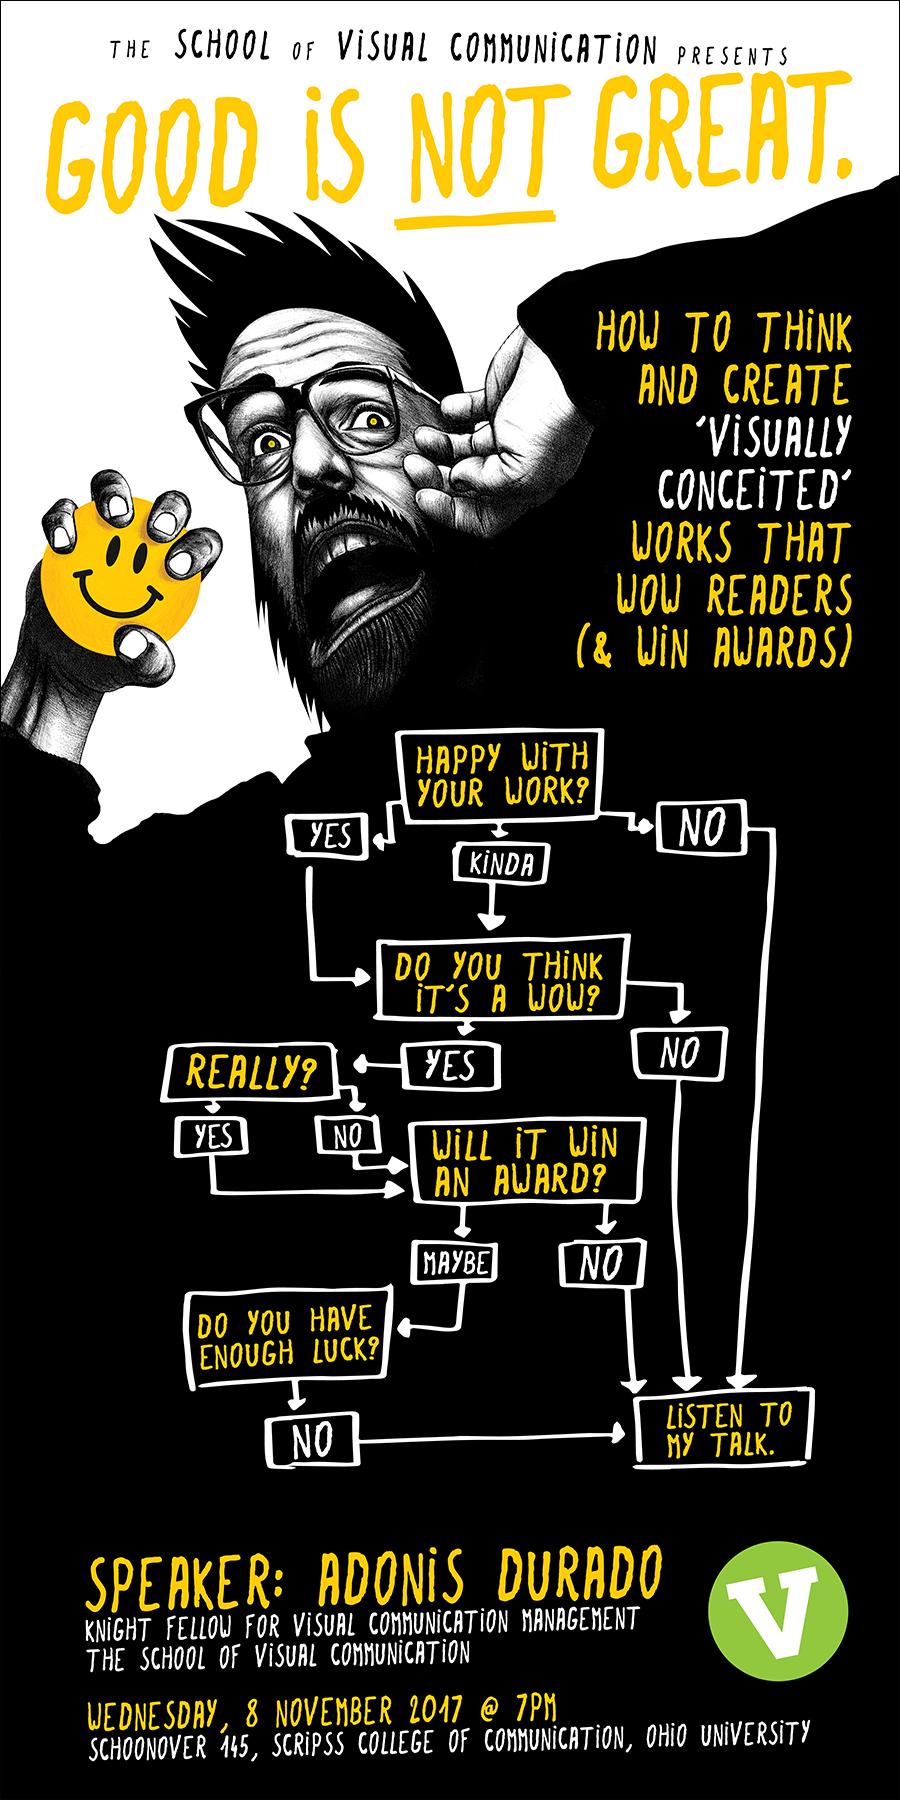
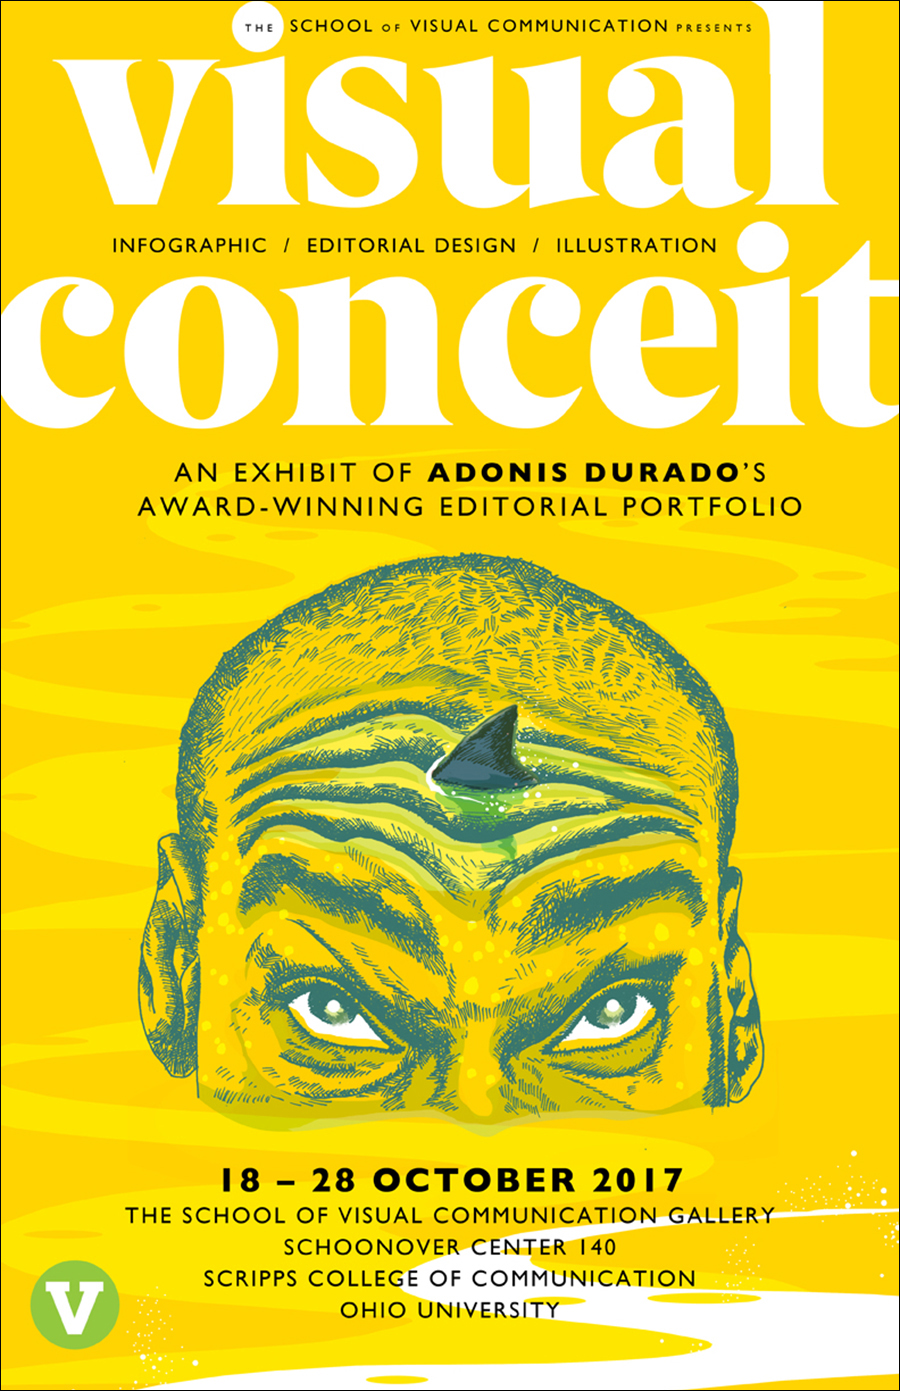
Adonis is talking about his work on Wednesday in our auditorium (poster shown above). This is a terrific opportunity for our students to learn from a world-class designer.

SOME OF HIS INFOGRAPHICS…

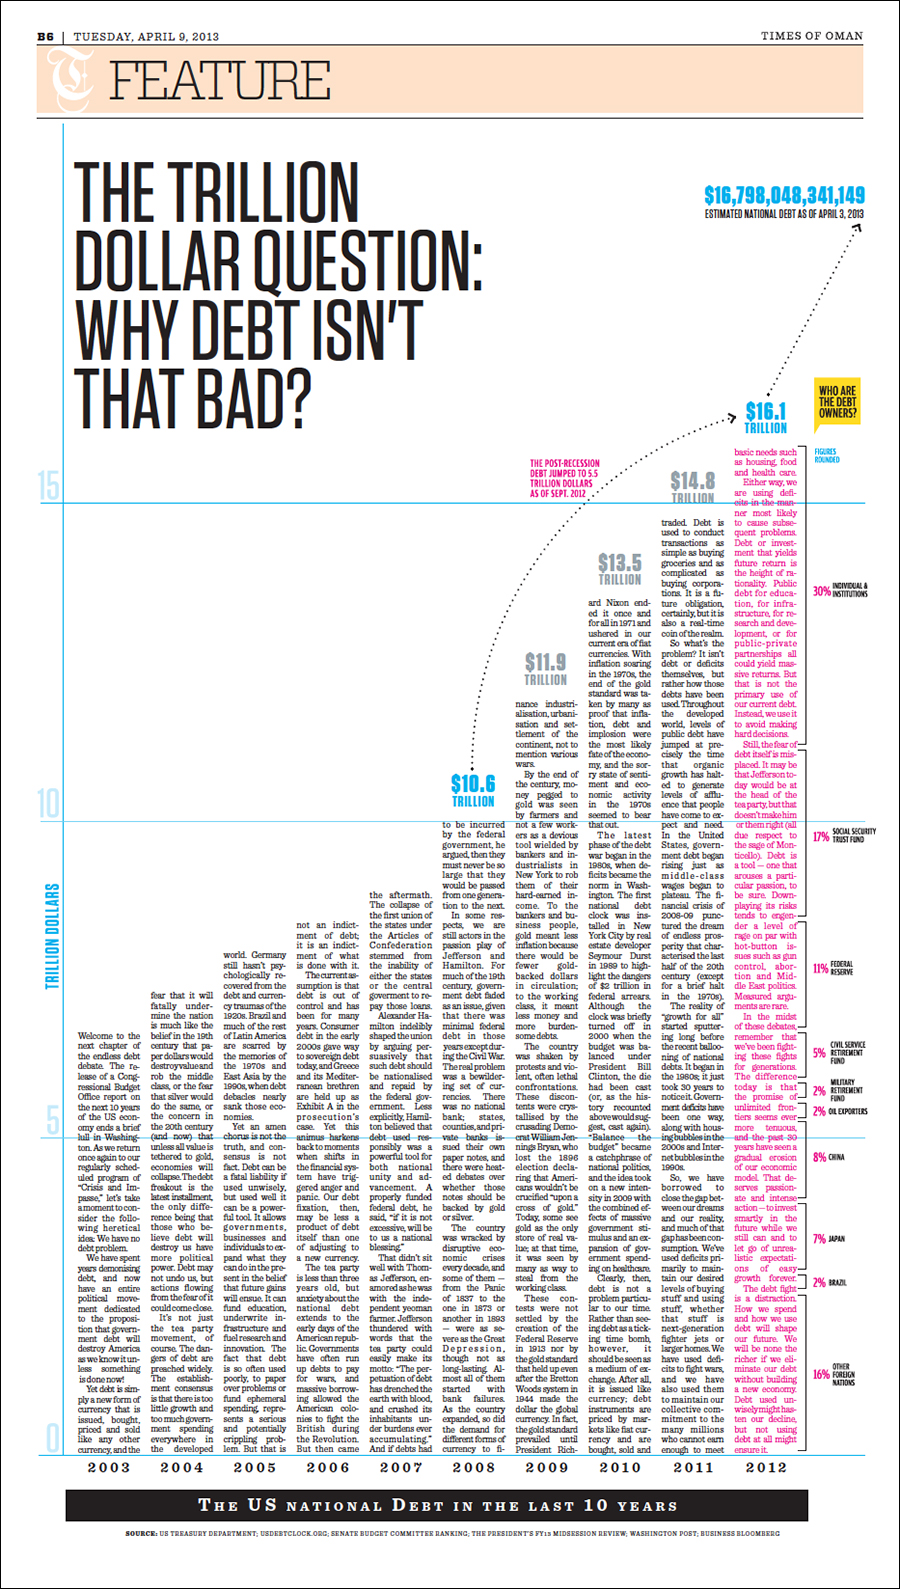
Mega-debt “My conceit here is to use the bars in the chart as body text columns, giving the page an organic or architectonic quality. It’s possible to read the article and the graphic at the same time. This is arguably the biggest bar chart ever published in a newspaper.”

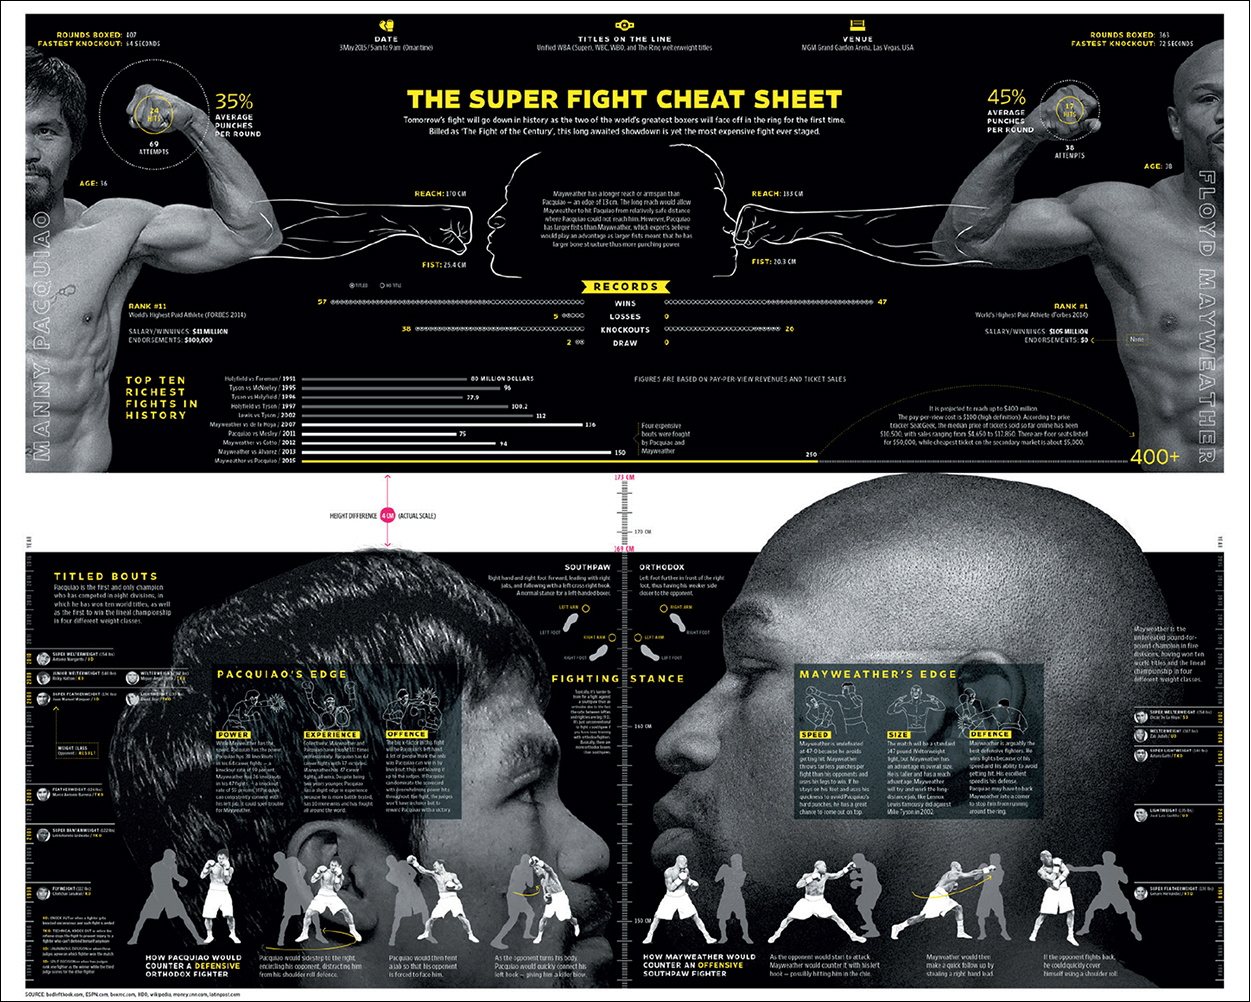
Boxing matchup “This preview presents, at actual scale, the height difference between the two boxers, which is shown as a white strip that runs across the spread. Height difference matters because a taller boxer has longer limbs, giving him a reach advantage.”

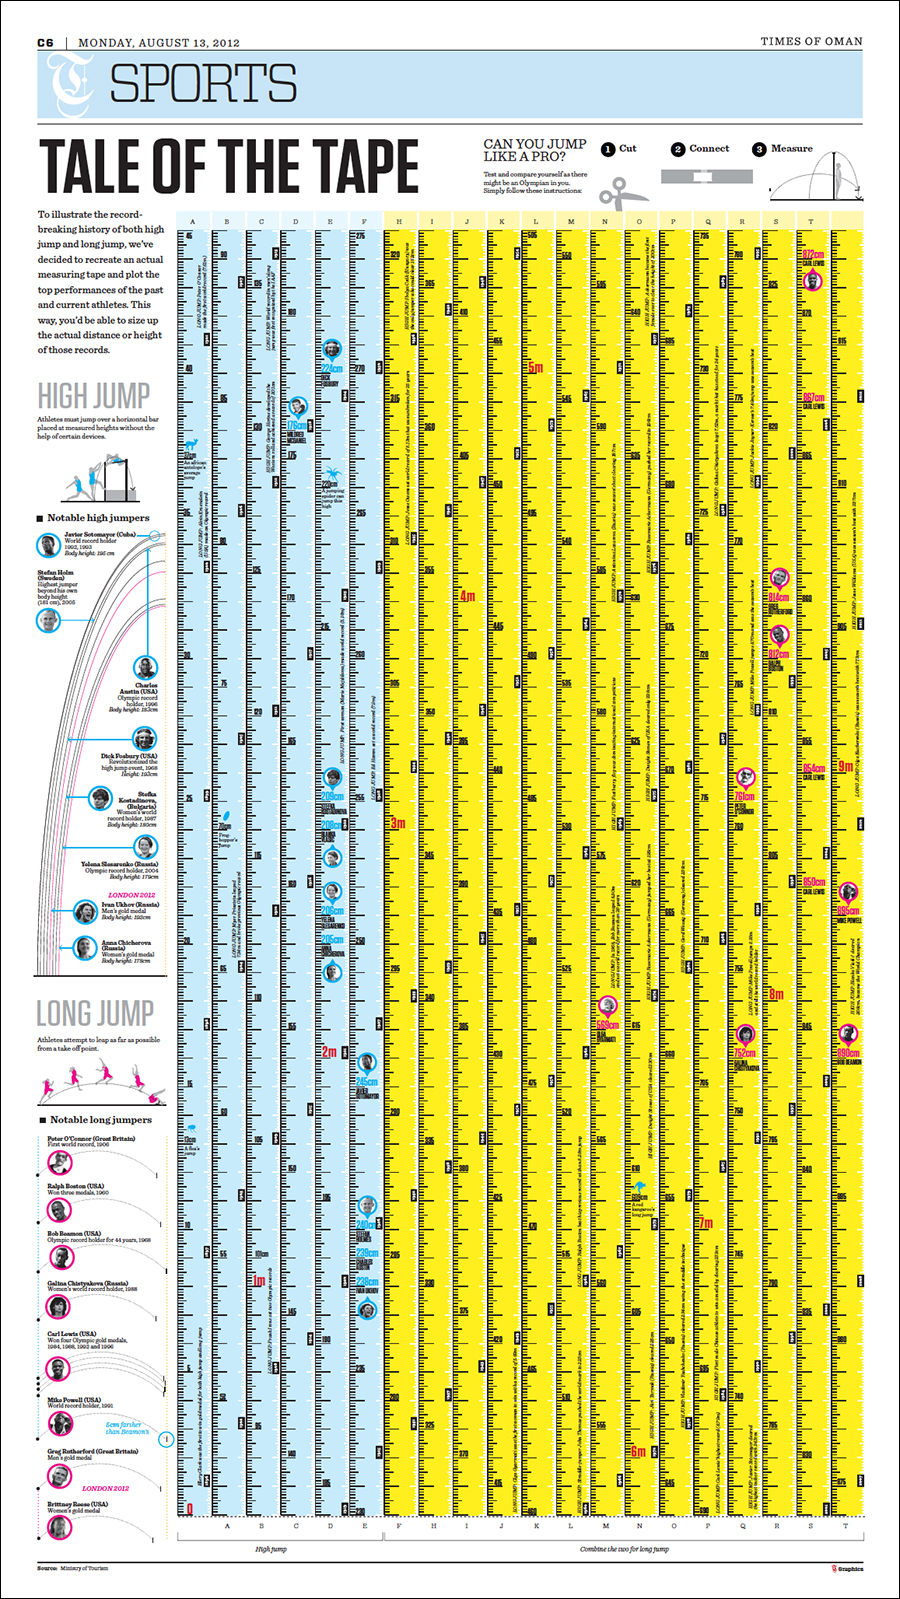
Olympic records “An infographic about the record-breaking history of the Olympic long jump and high jump. To add fun and interactivity, I invited readers to cut up the page and transform it into a measuring tape, then see for themselves if they can jump like a pro.” (Click on the image to see a detail.)

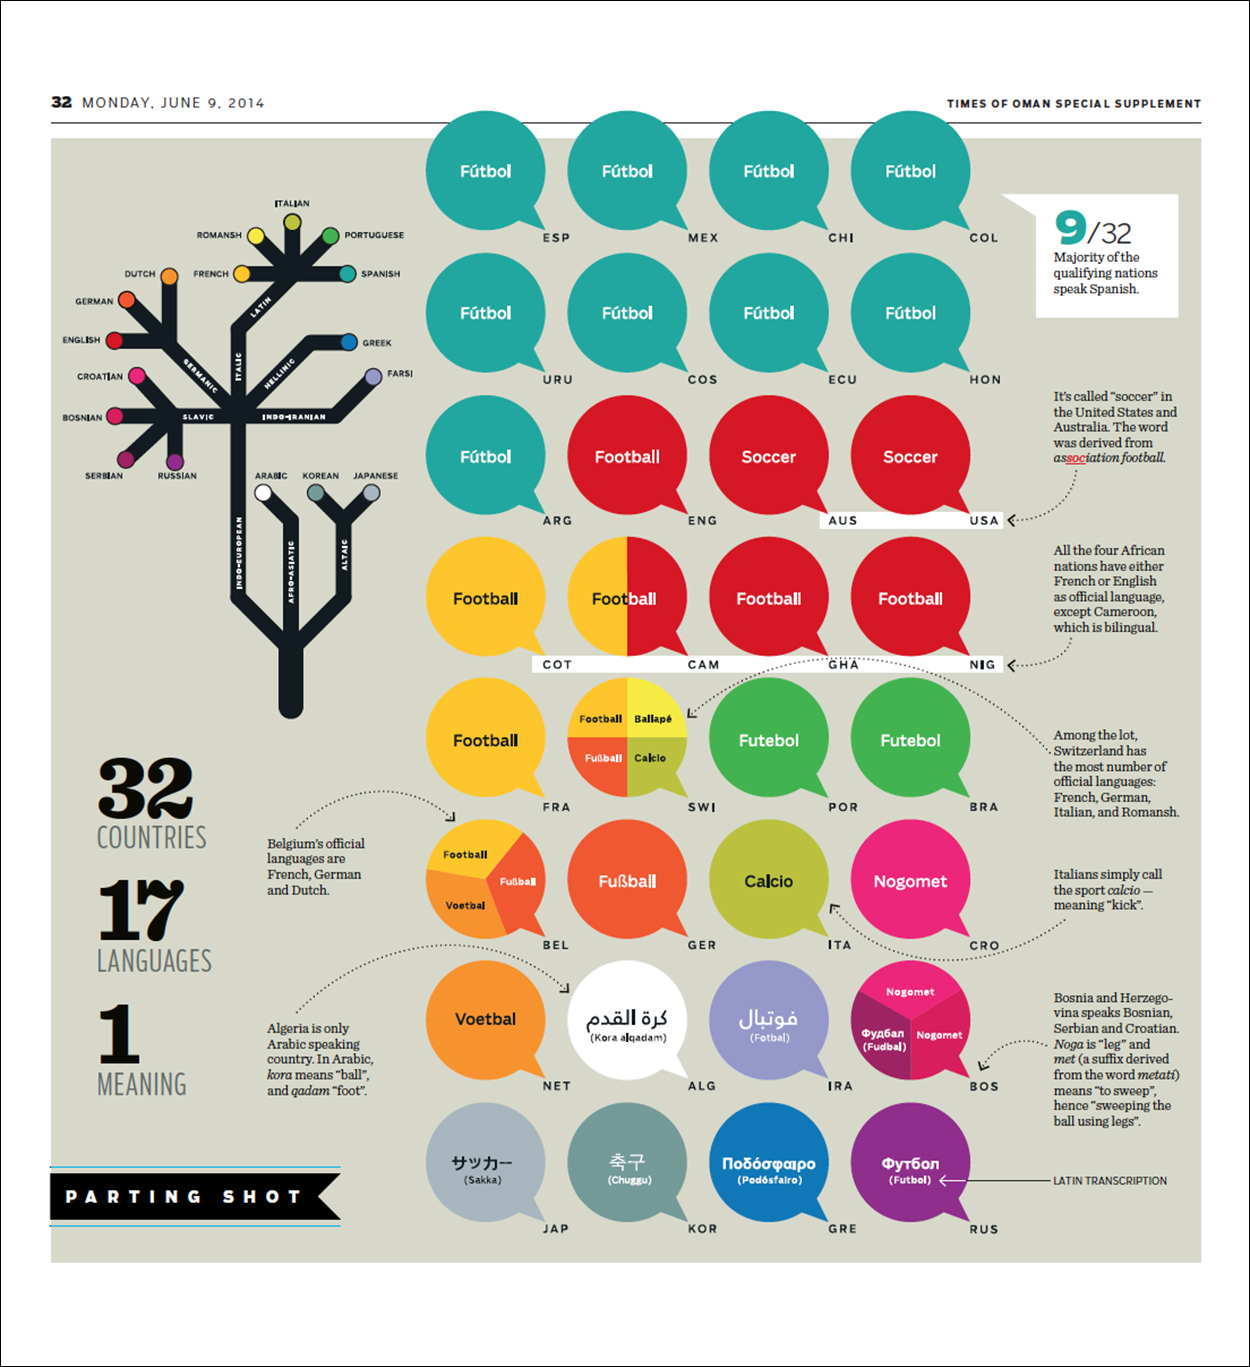
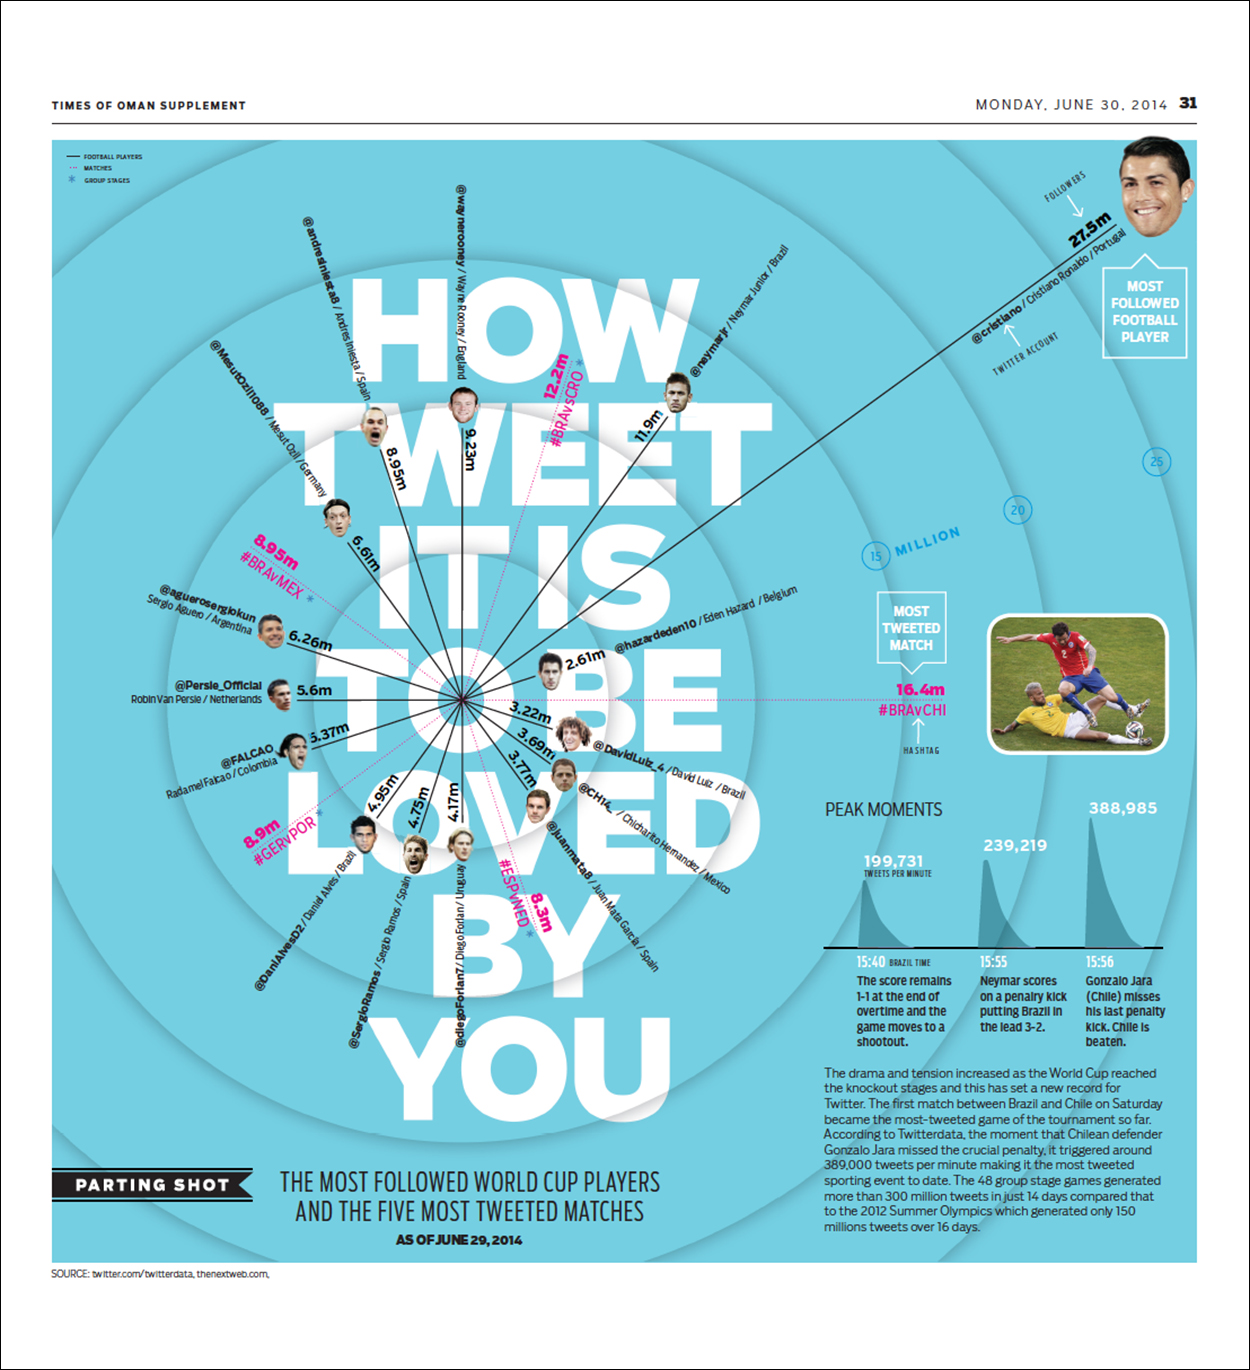
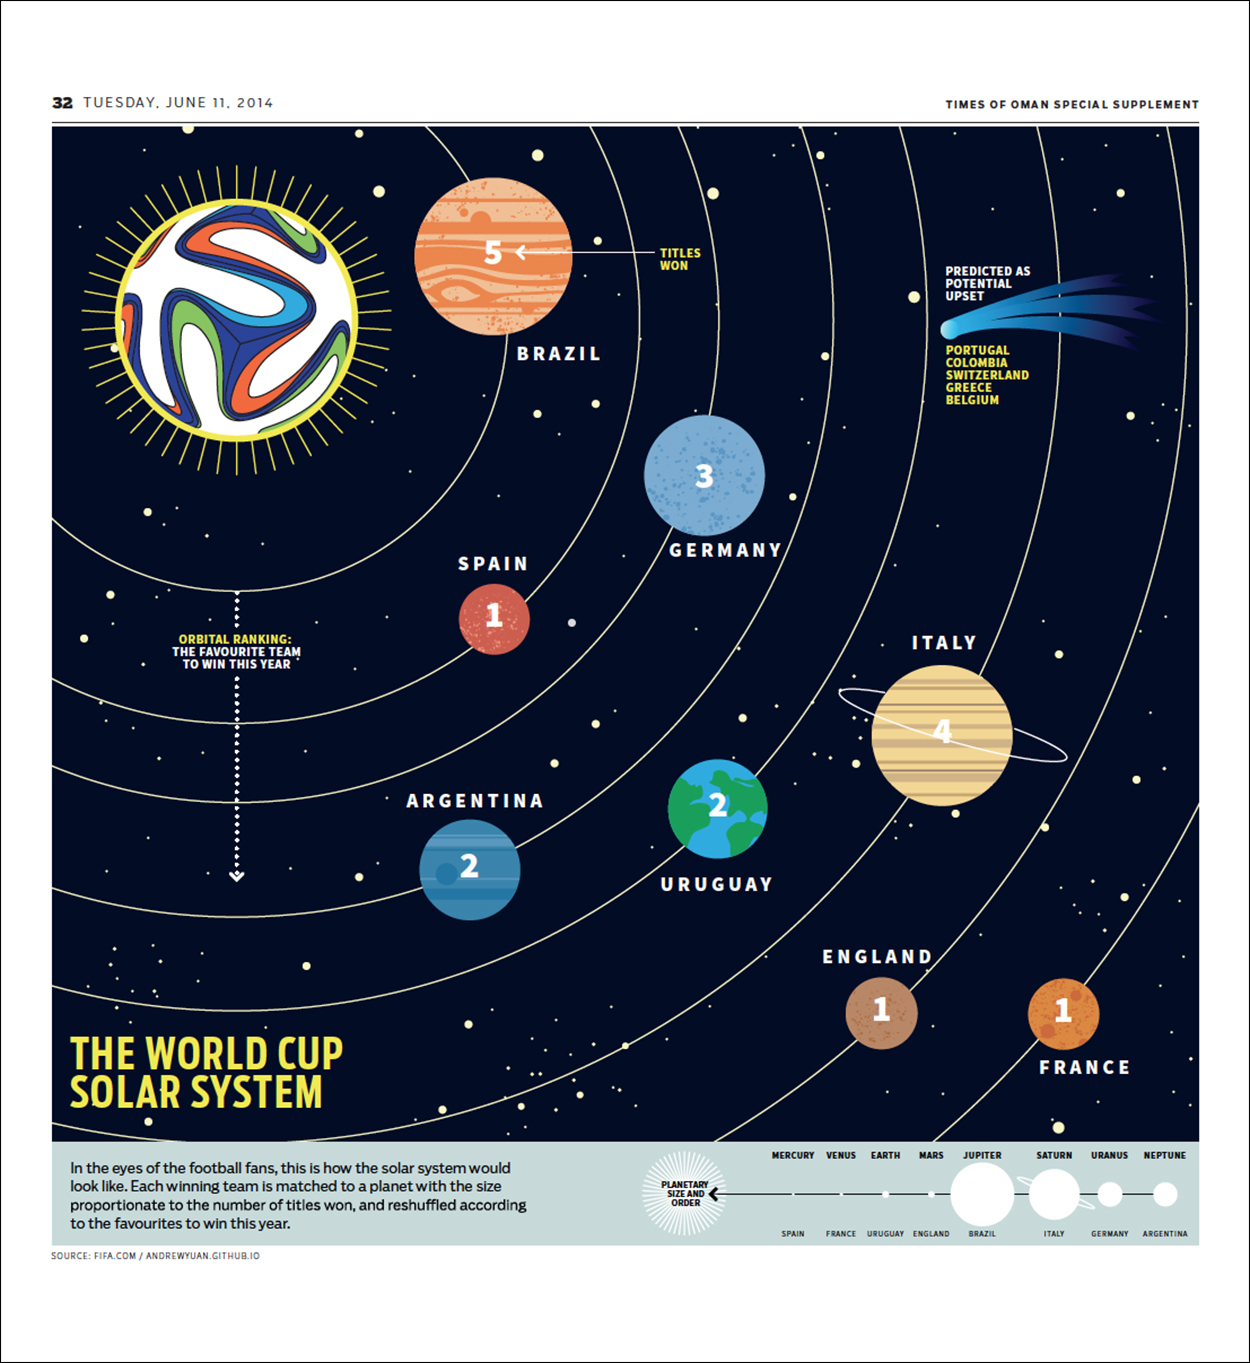
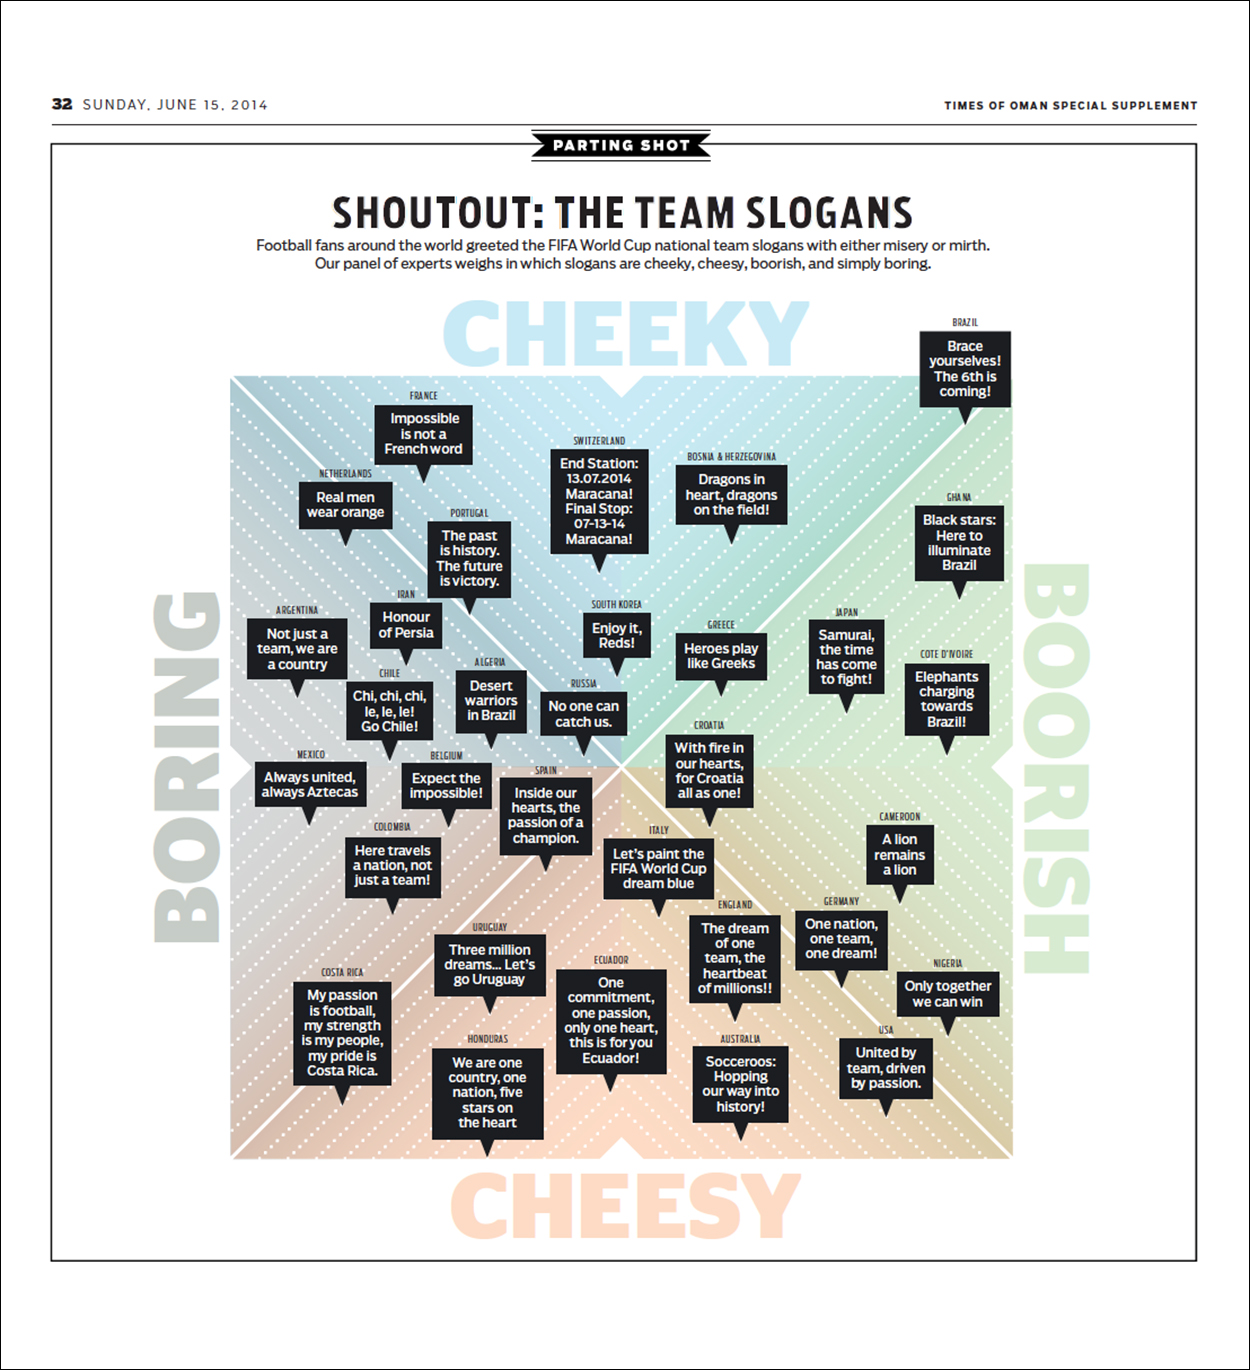
World Cup insights “A series of infographics that were published in the back of our World Cup supplement. In this section, called “Parting Shot,” we tried visualizing content that is considered non-serious or off-beat.”

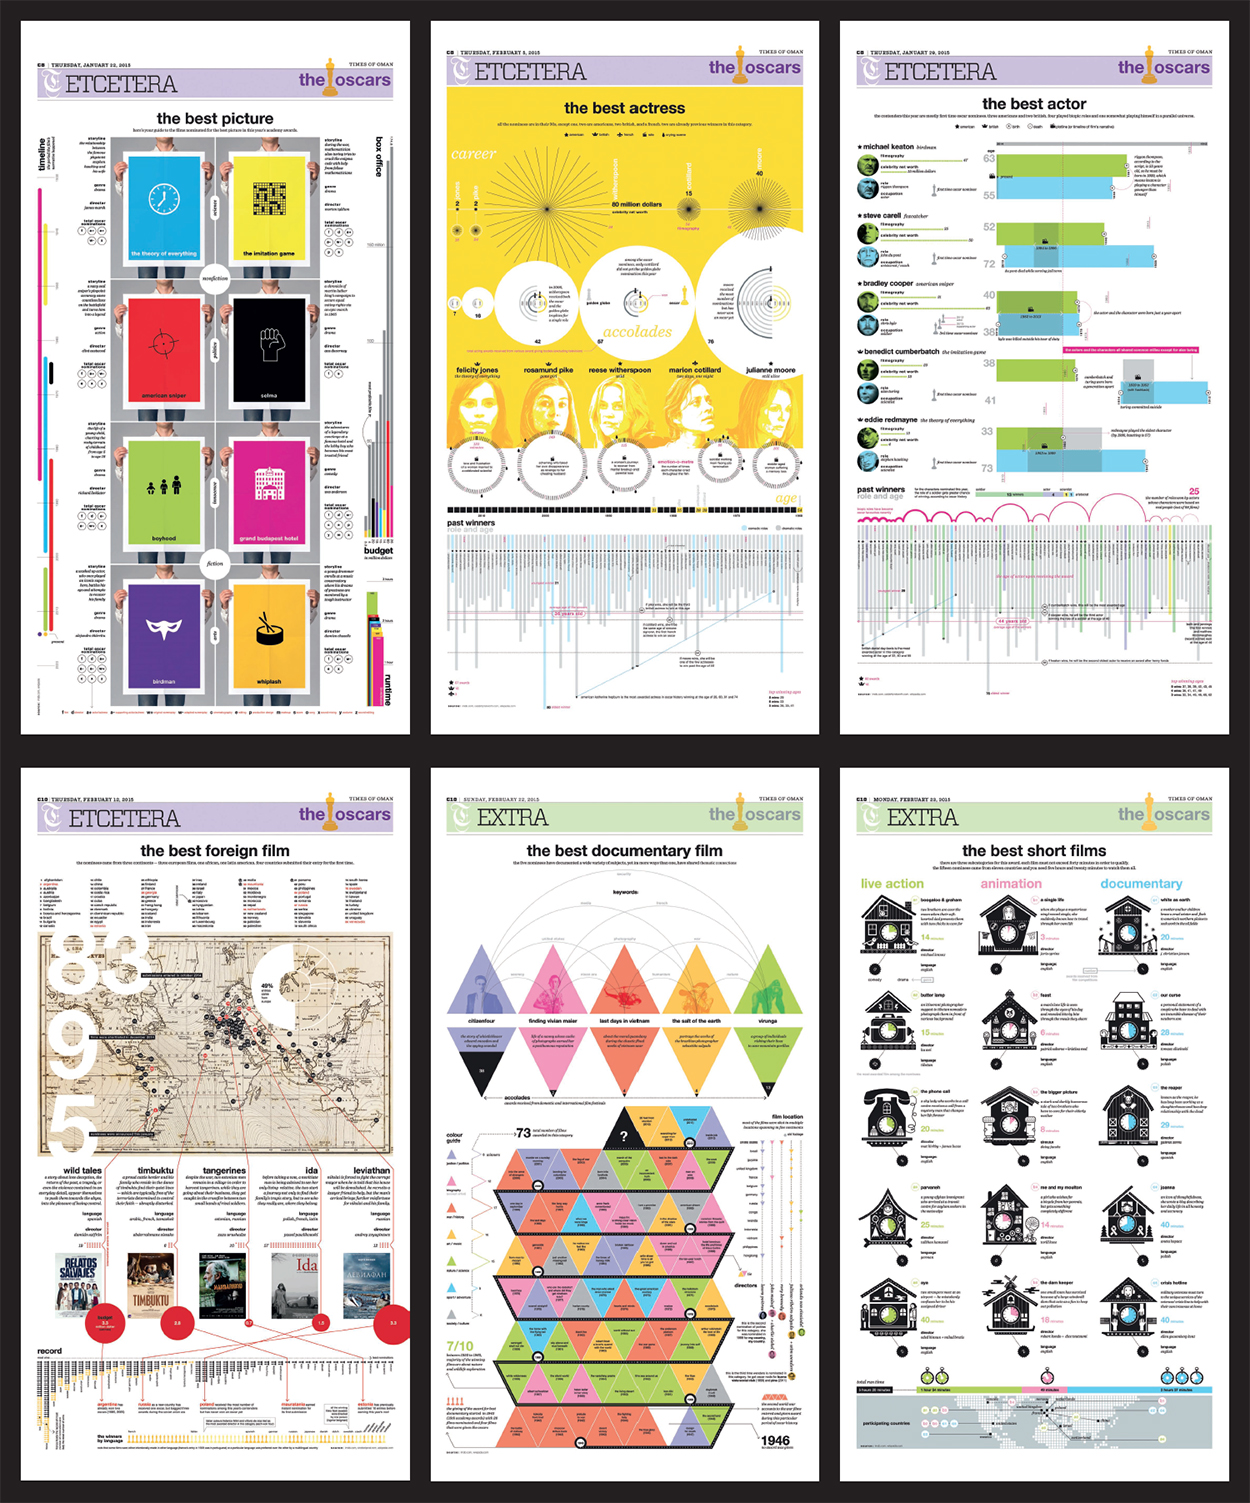
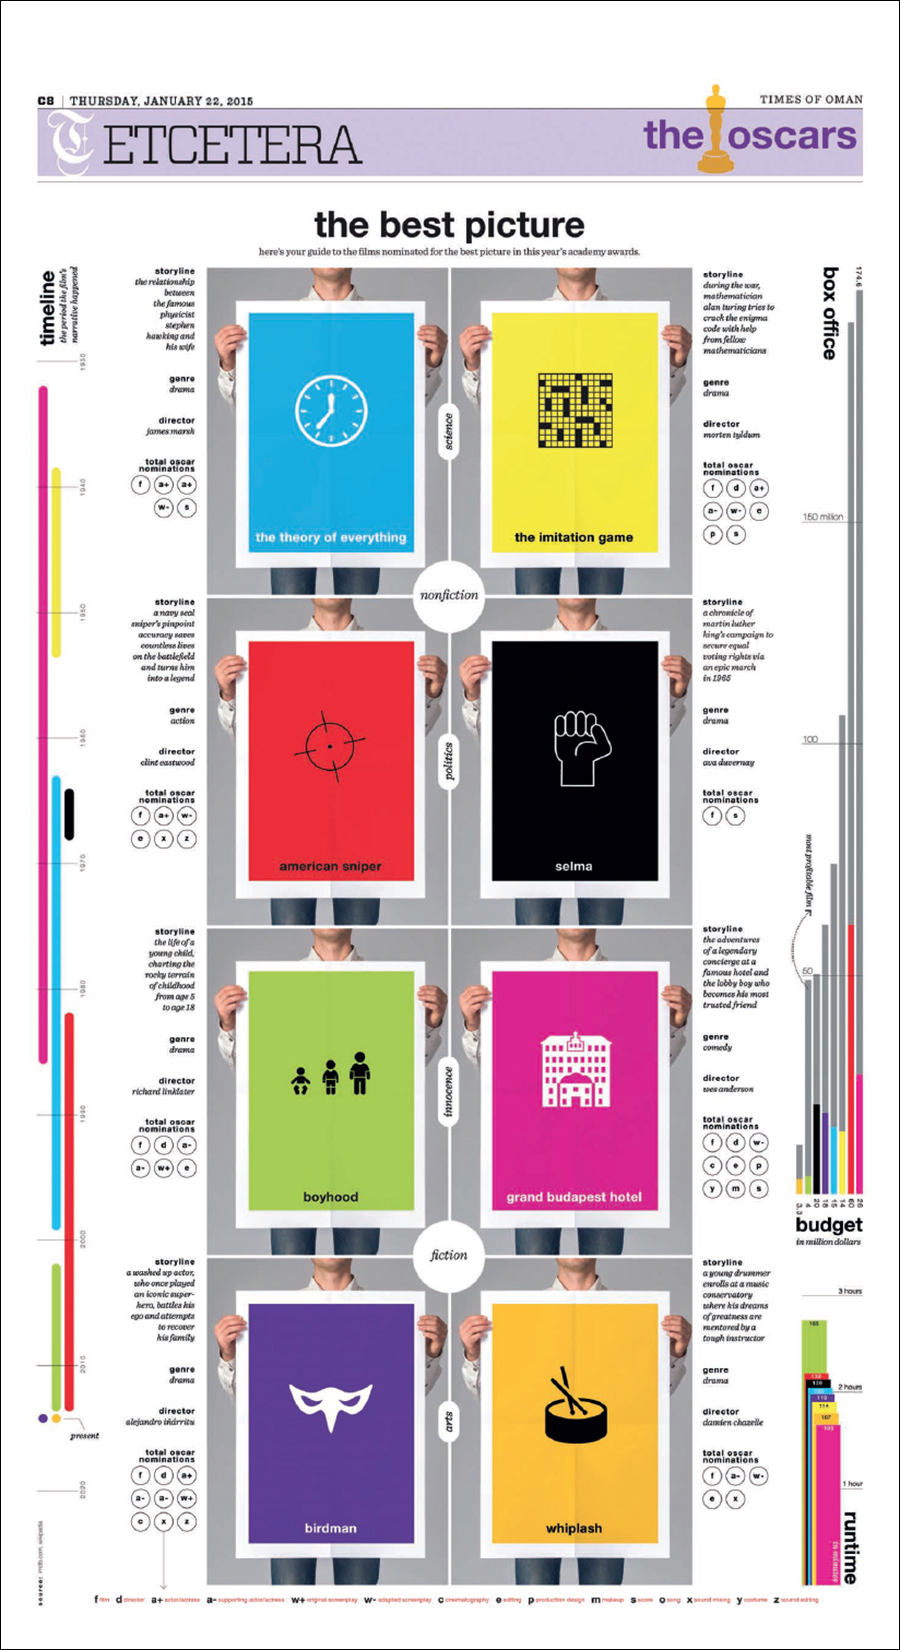
The Oscars “A series of infographics published daily leading up to the Academy Awards ceremony. I employed a variety of conceits for each category page. For example, in “The Best Picture,” I asked myself: Would it be possible to make the graph’s color legend the most dominant element of a page? The legend is a discreet element in all graphics, but not in this case.”

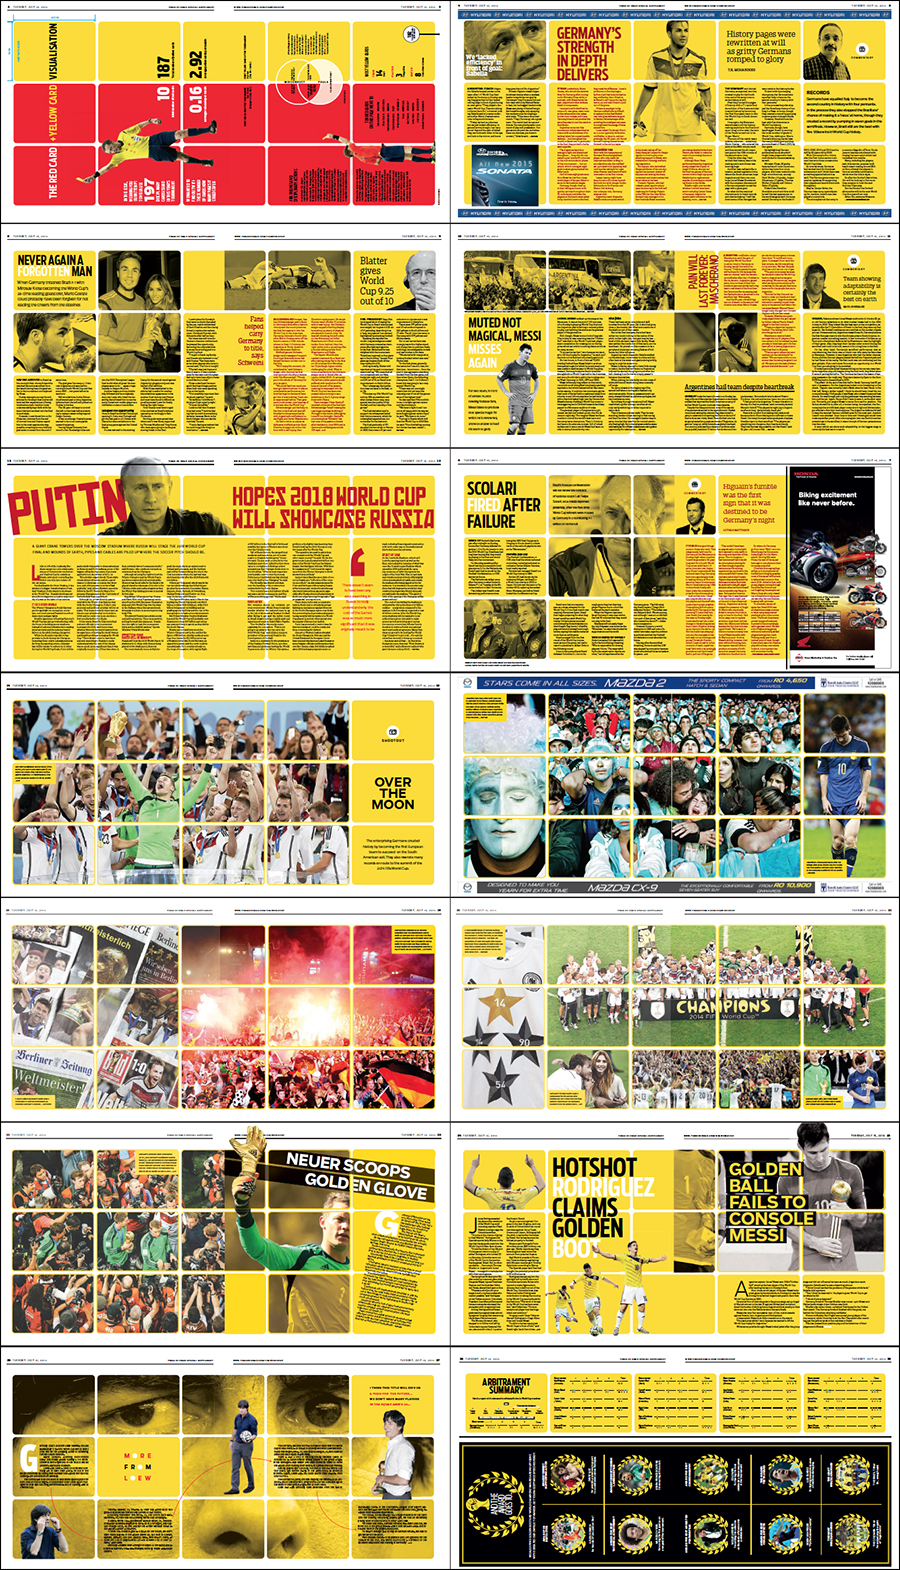
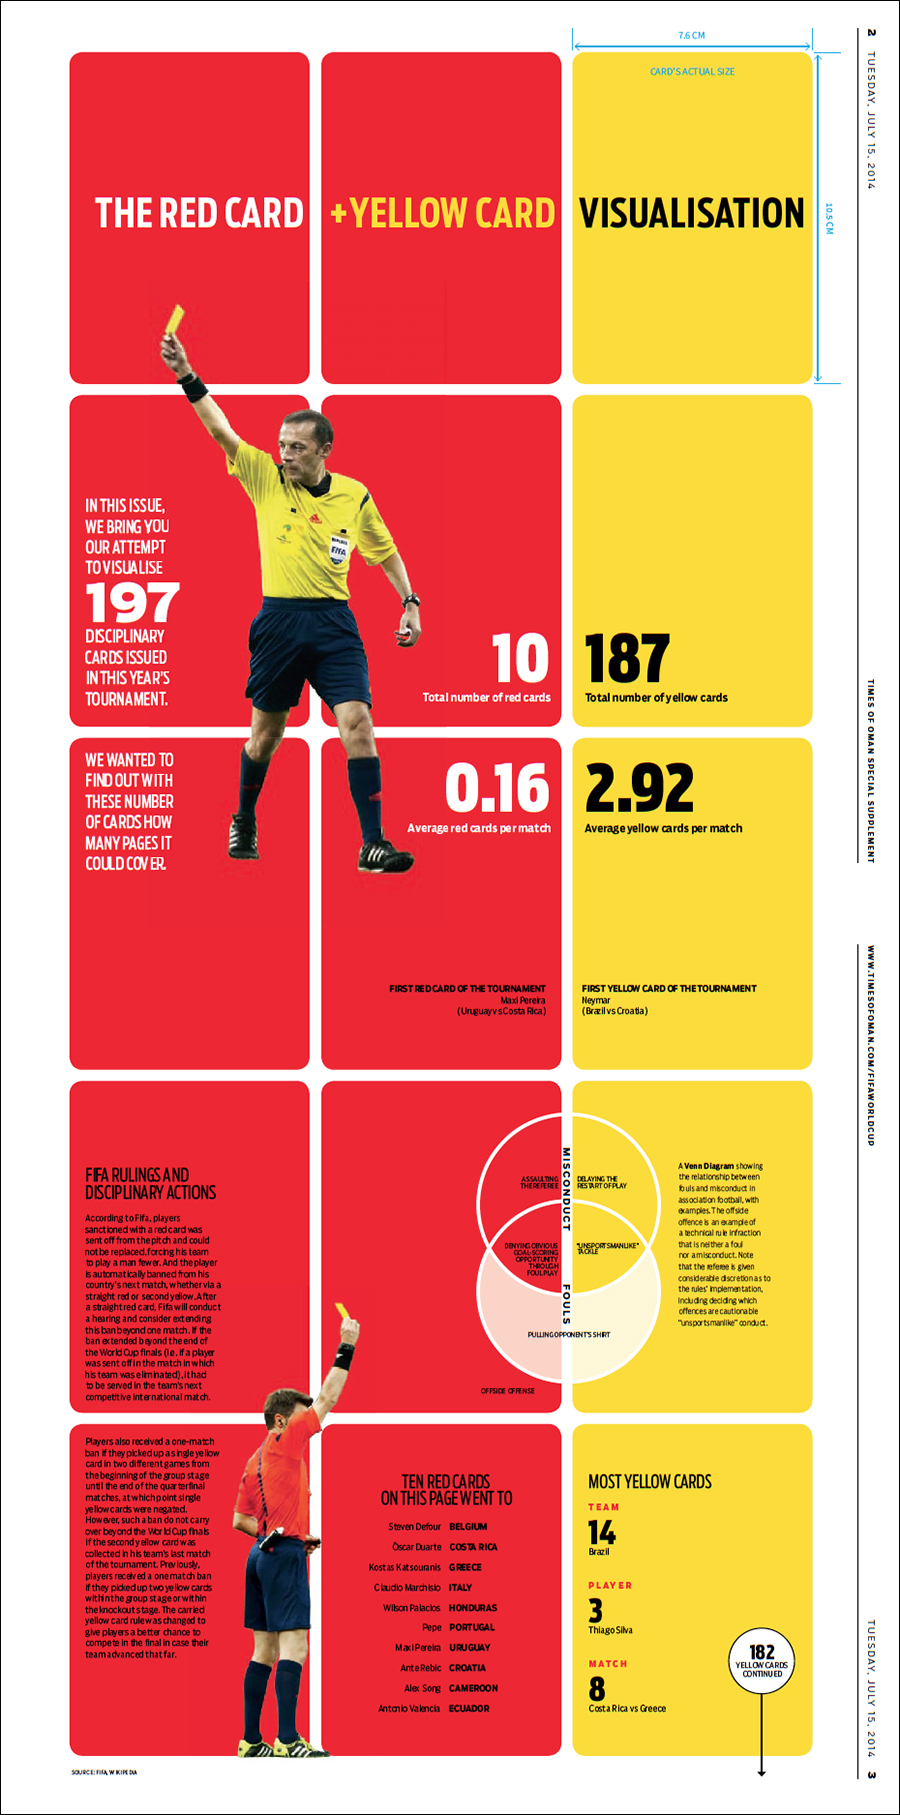
Soccer discipline “Another World Cup graphic. I began the design by considering if it’s possible to visualize a dataset that can occupy the entire issue of the magazine. These are all the red card and yellow cards issued during the tournament.”

The first spread (rotated).

… AND SOME OF HIS PAGE DESIGNS

Danish banking “This page started with the conceit of “type attack,” where the headline serves as the dominant element of a page (or the text becomes art in itself). I ended up deconstructing the body text as well, and came up with a treatment that mimics the concept of intertextuality. Notice that the lead paragraph contains keywords that link to pieces of related information.”

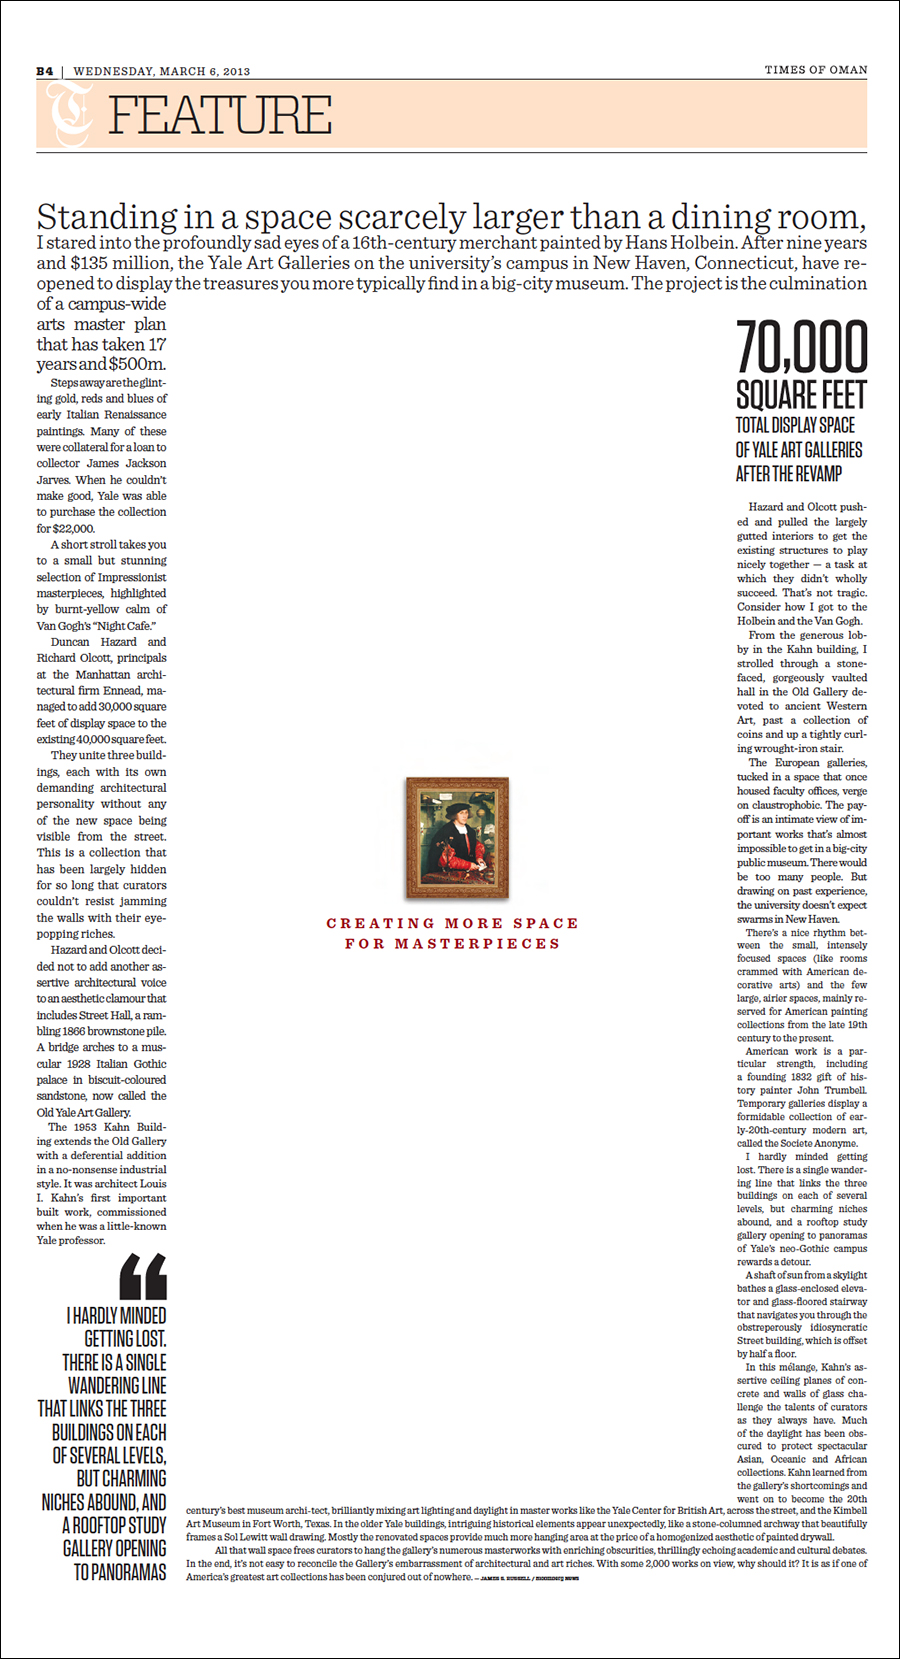
Gallery space “My solution to a challenge that I set myself: Is it possible to design a page where the white space is an illustration in itself, and is an element that will help visualize a story?”

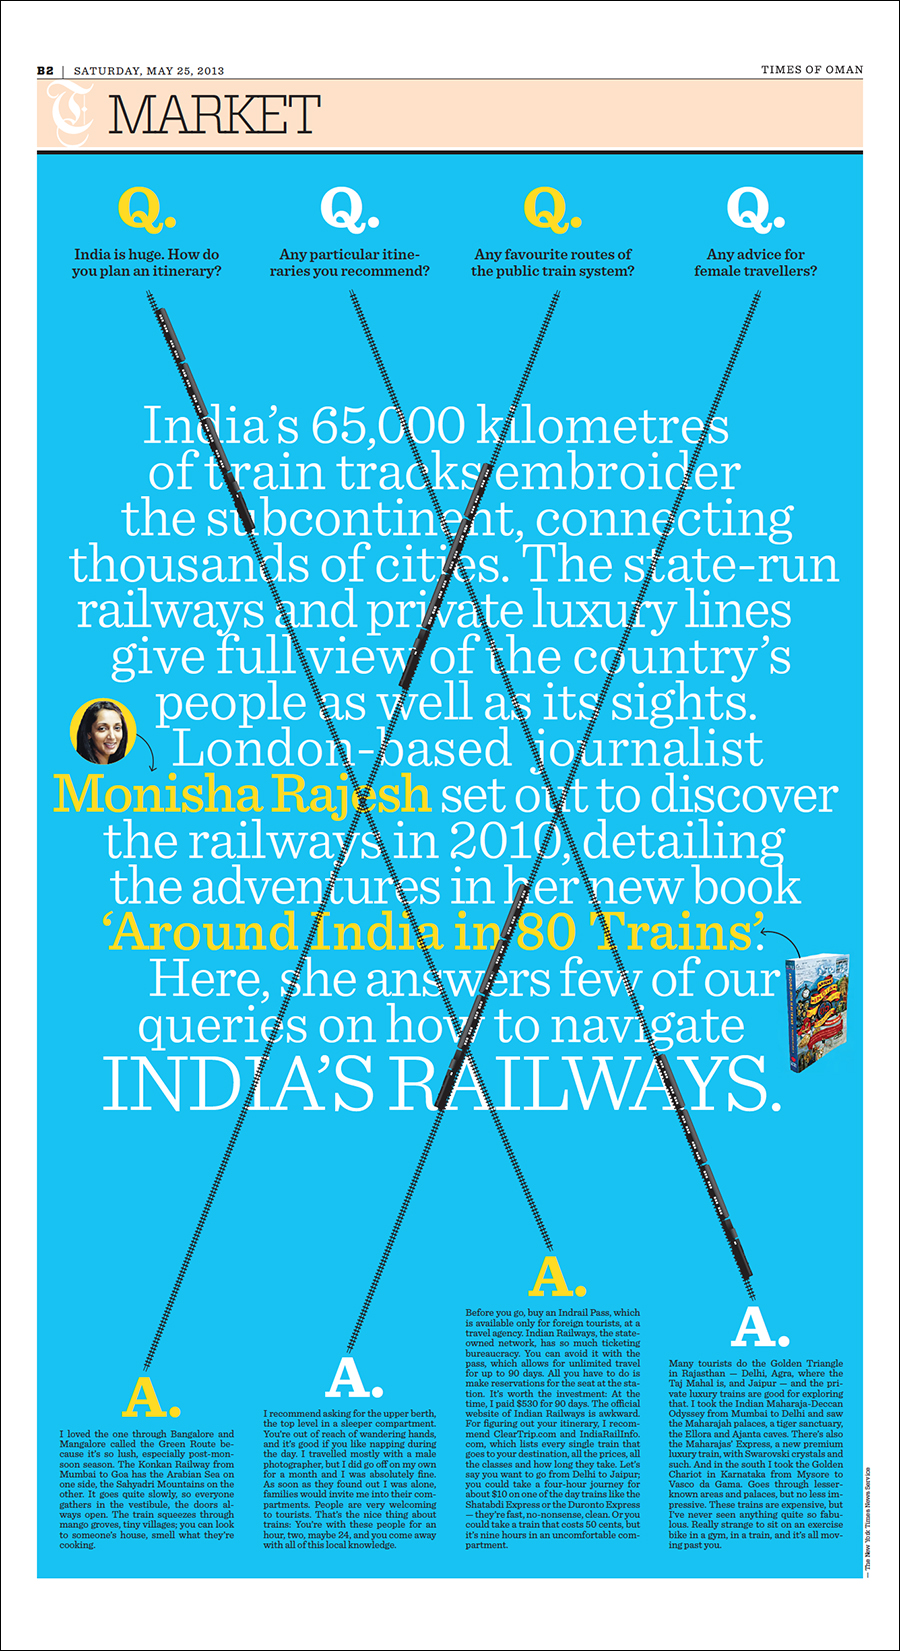
India by train “Perhaps here I was just too tired of the regular Q&A format. This playful treatment defies convention, and I even let the headline and the intro merge into each other.”

The poster for the gallery show.


Fernando Baptista in Ohio

A SCULPTURE AND INFOGRAPHICS WORKSHOP.

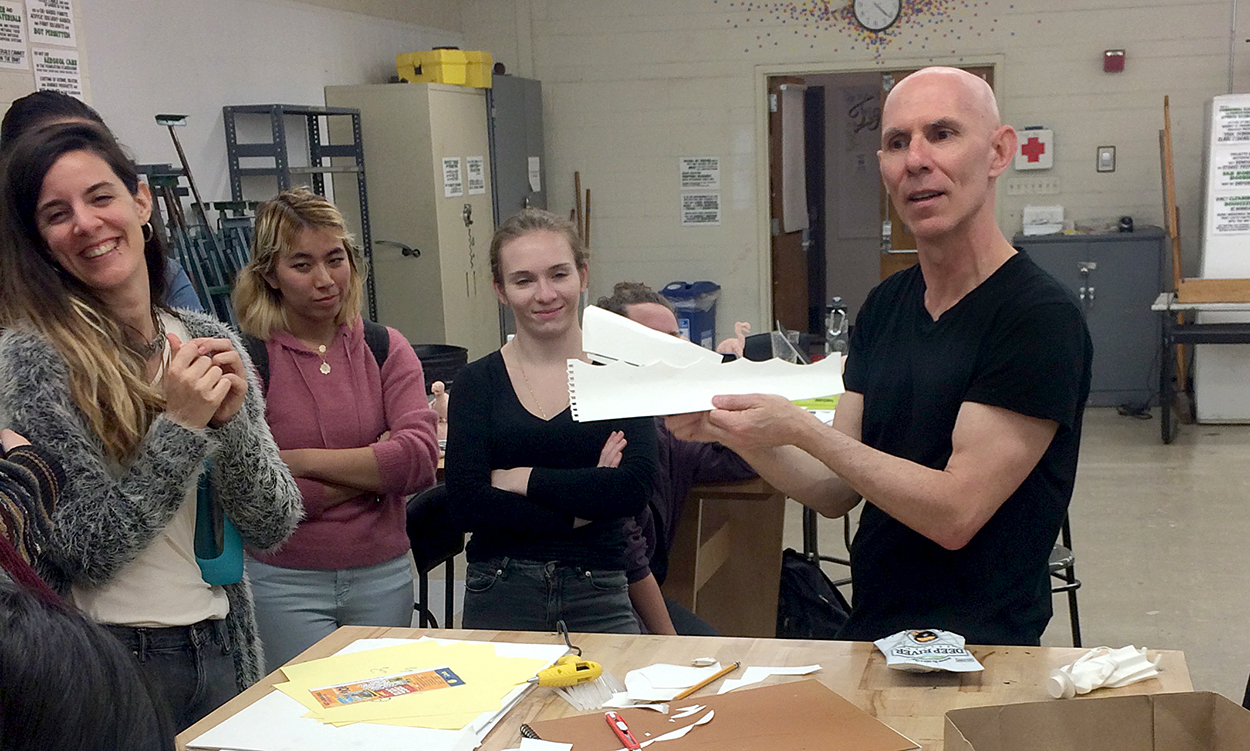
Last week, Fernando Baptista visited Ohio University. He gave a presentation to a packed auditorium, and the following day he began a two-day workshop for twenty students from the School of Art + Design and the School of Visual Communication. The group used the same methods that Fernando uses to make his superb illustrations for National Geographic magazine. Undergraduates and graduates worked together in a studio that is used for art and design classes. Countries (apart from the U.S.) that were represented: China, India, Iran, the Philippines and Spain.
Photograph above by Kisha Ravi (a VisCom photojournalism student).

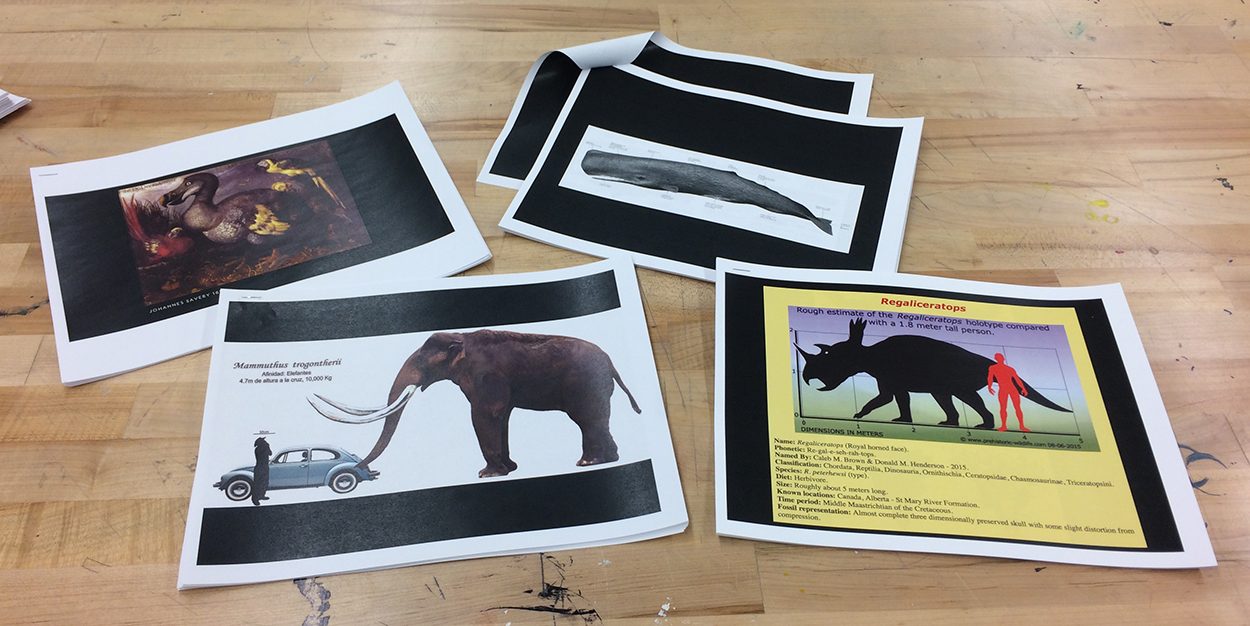
Day One The reference material. Students chose one of four subjects: mammoth, sperm whale, dodo or triceratops.
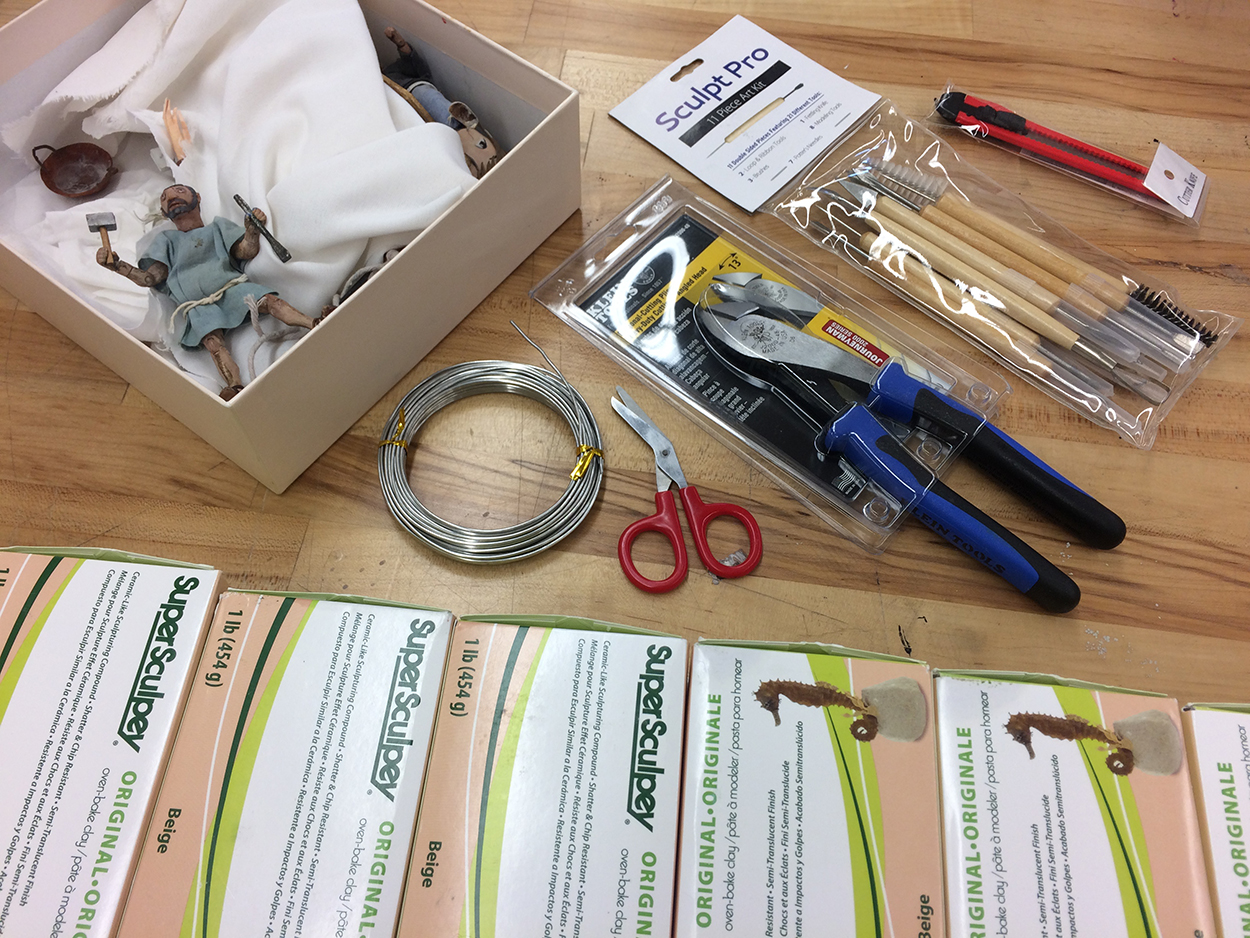
The equipment. Notice the figure from an animation about Trajan’s Column, who happens to be on the table. See the video here: goo.gl/jhqbkb
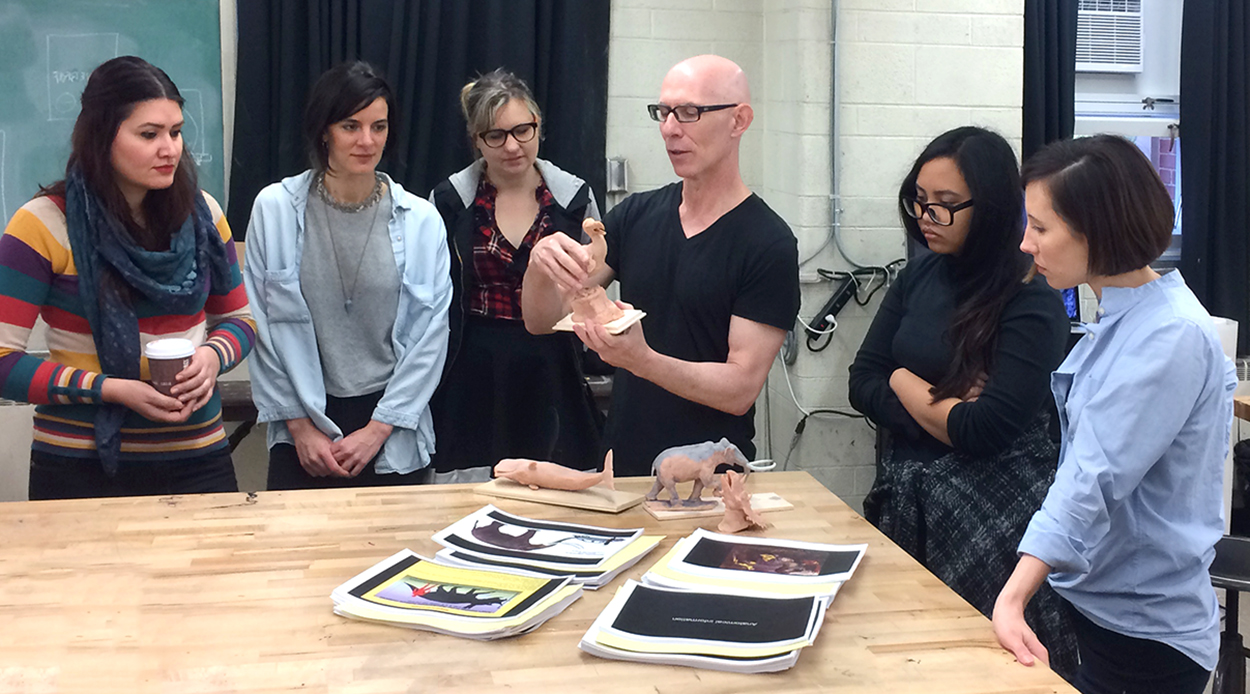
Fernando explains his process. Like all great professionals, he’s keen to share the lessons he’s learned during his career.
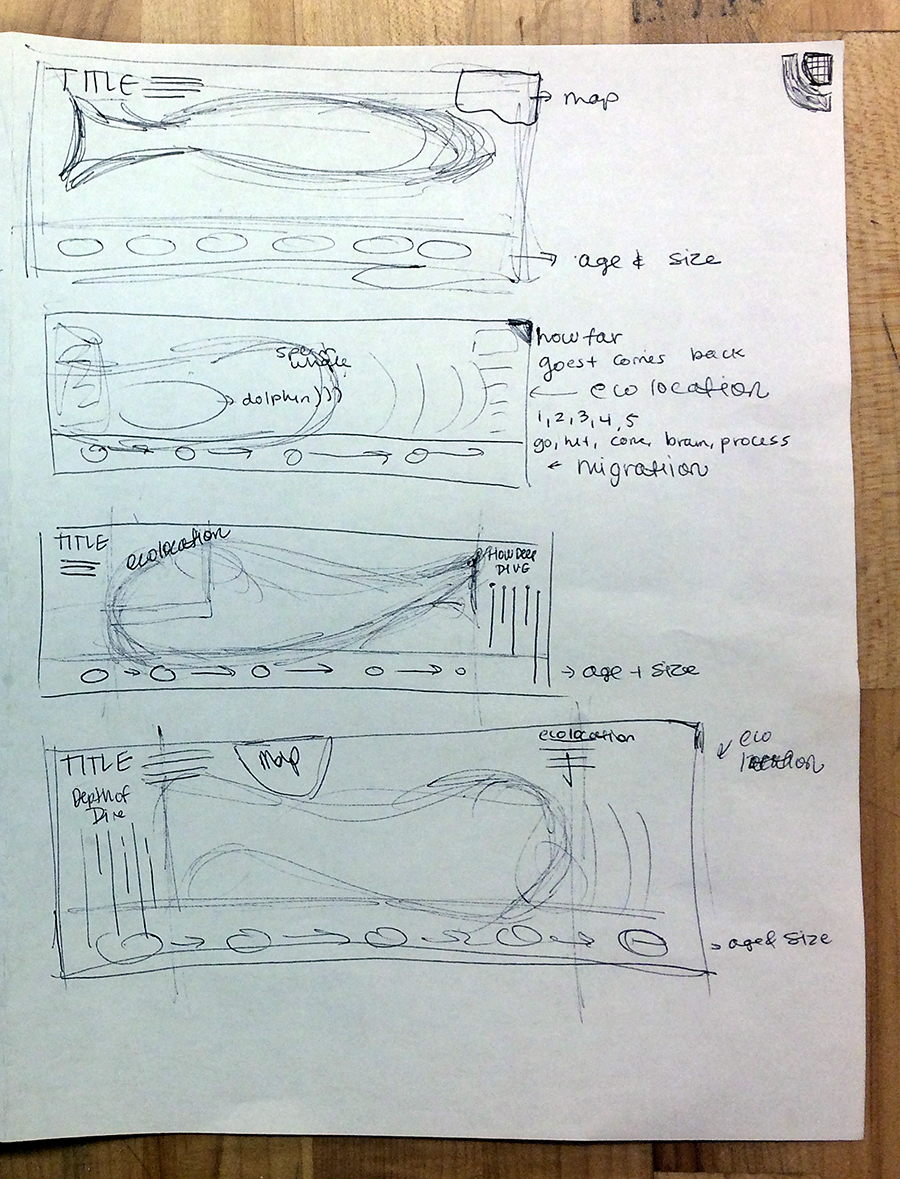
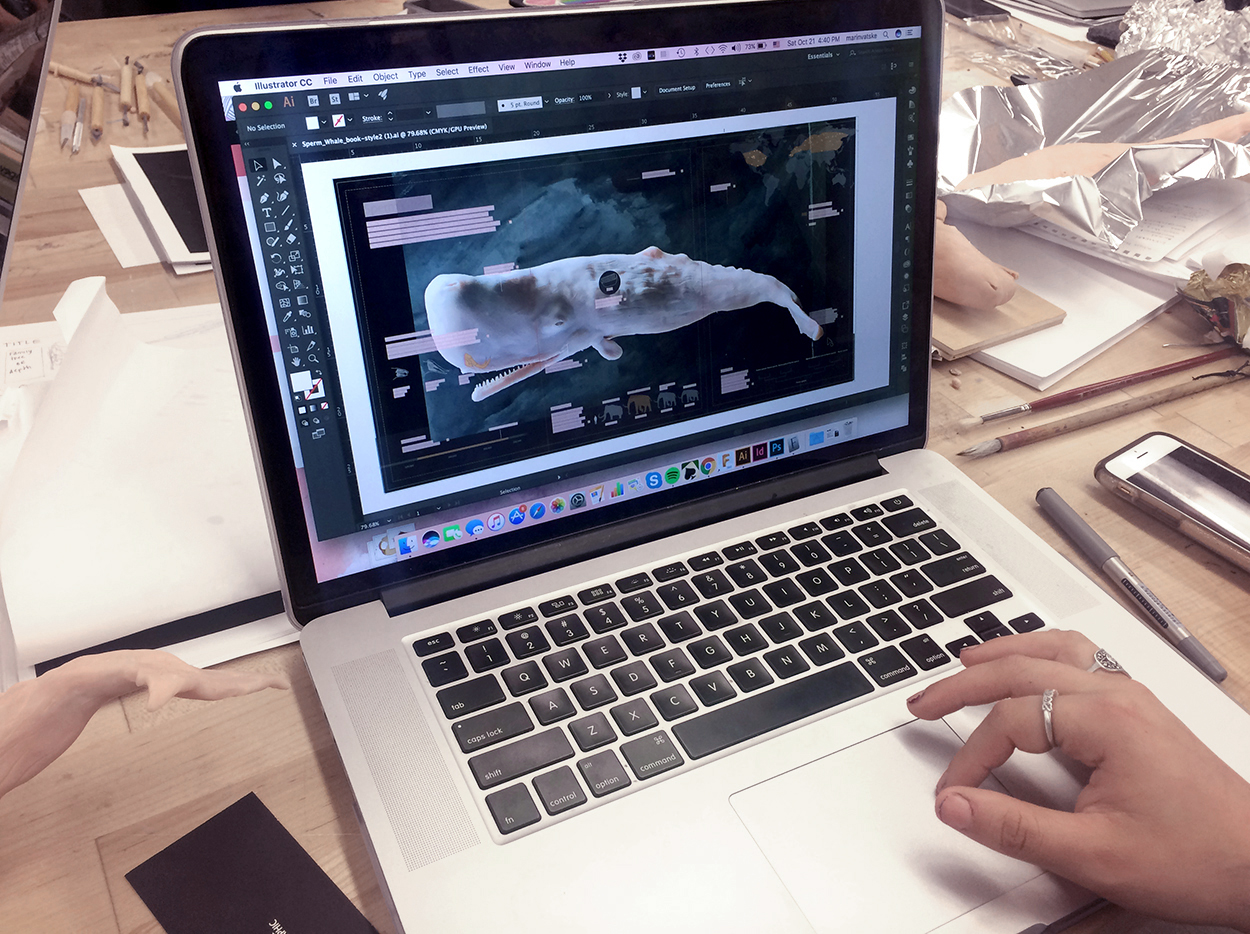
The first stage was to rough out ideas for an infographic. One student’s plans for a sperm whale graphic.
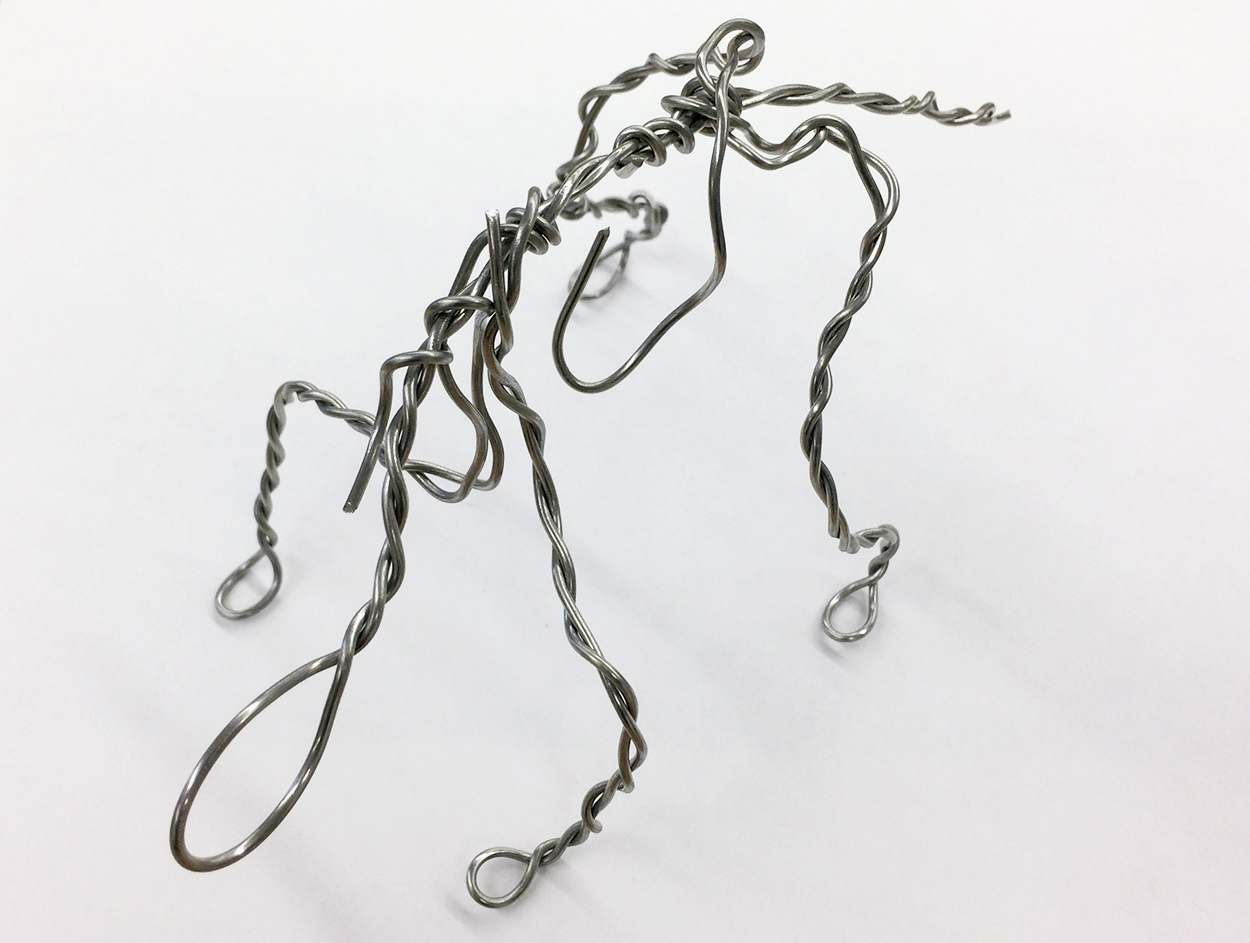
A wire armature was made to closely match the skeleton of the animal. In this case, a triceratops.
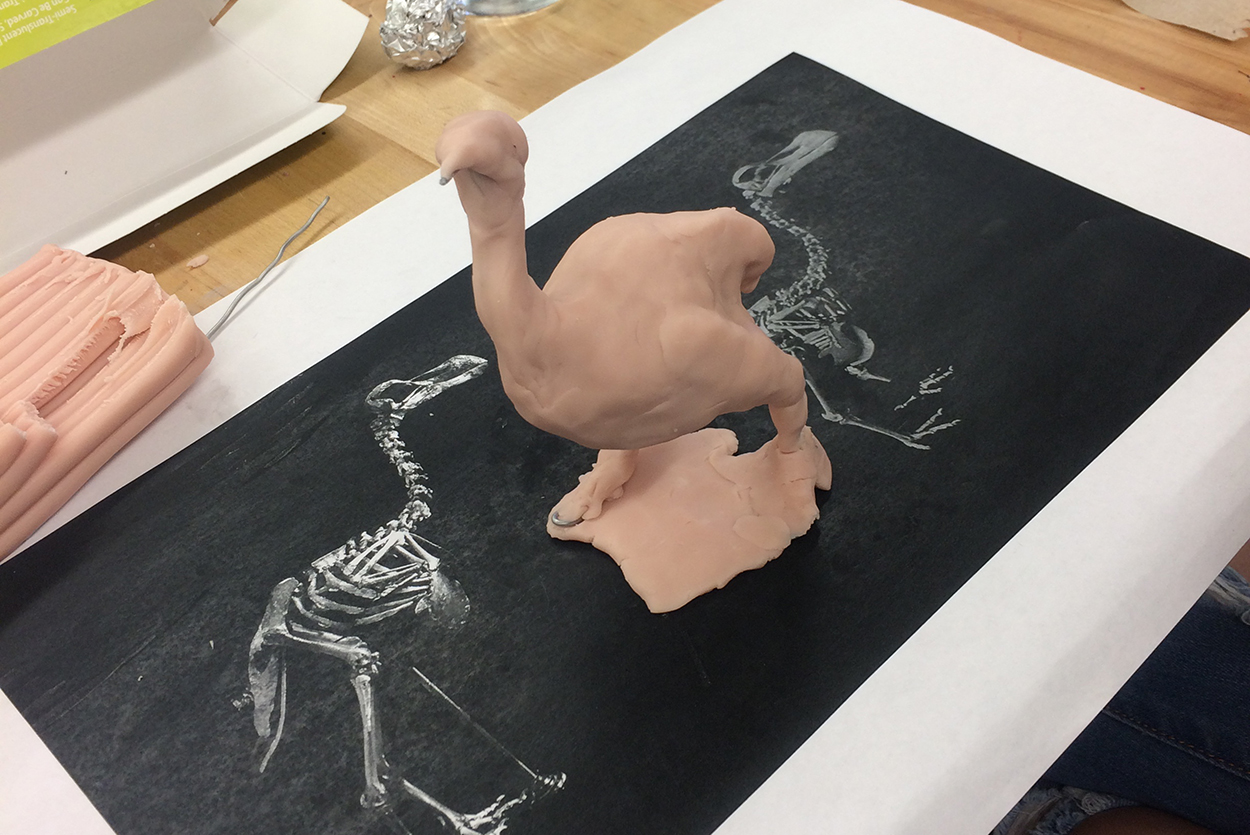
Aluminum foil was used to fill out the form (here, a dodo) before layers of Super Sculpey, a polymer modeling clay, were applied.
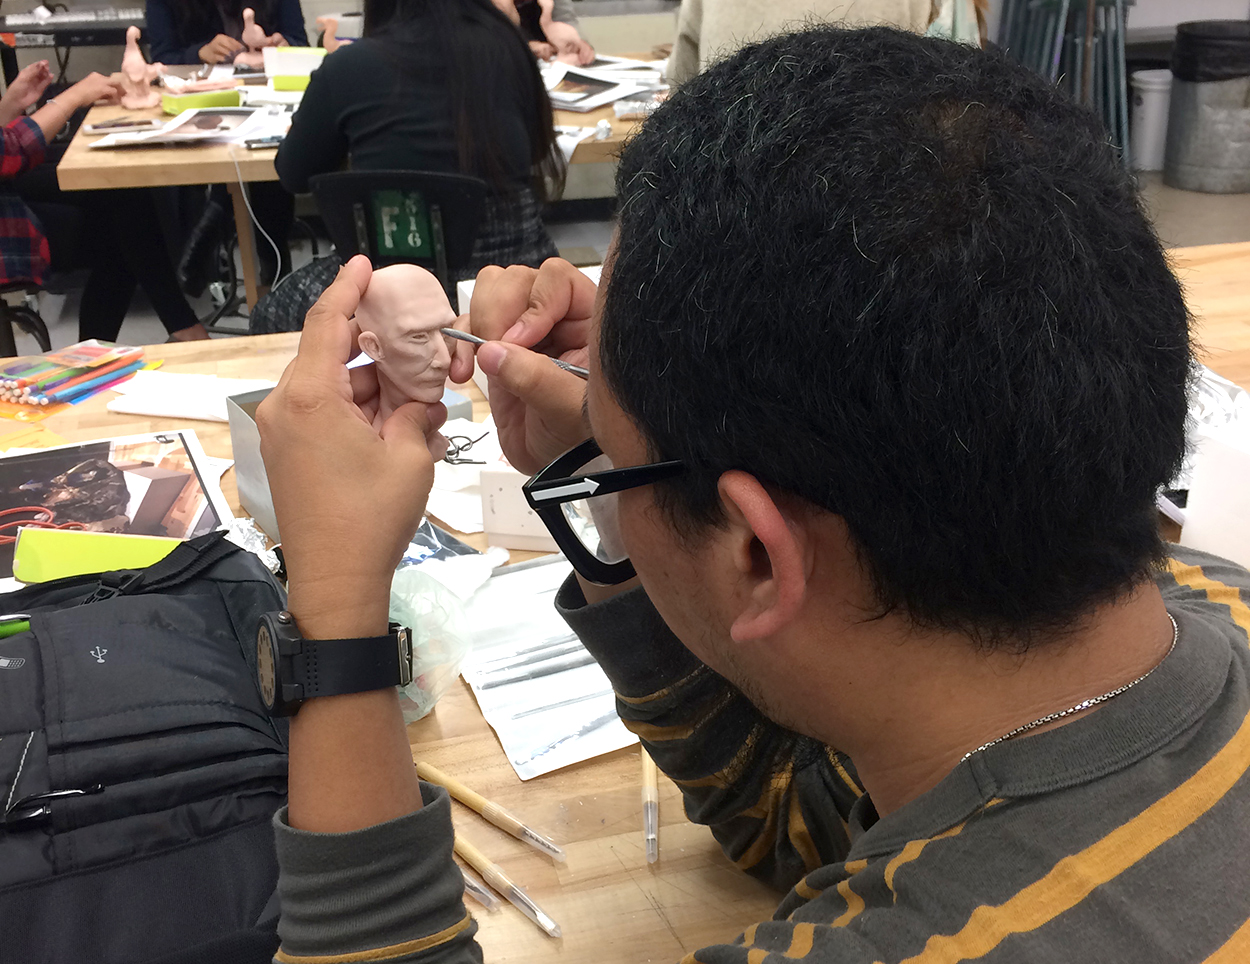
Adonis Durado, who was making a video of the workshop, modeling an impromptu portrait of Fernando.
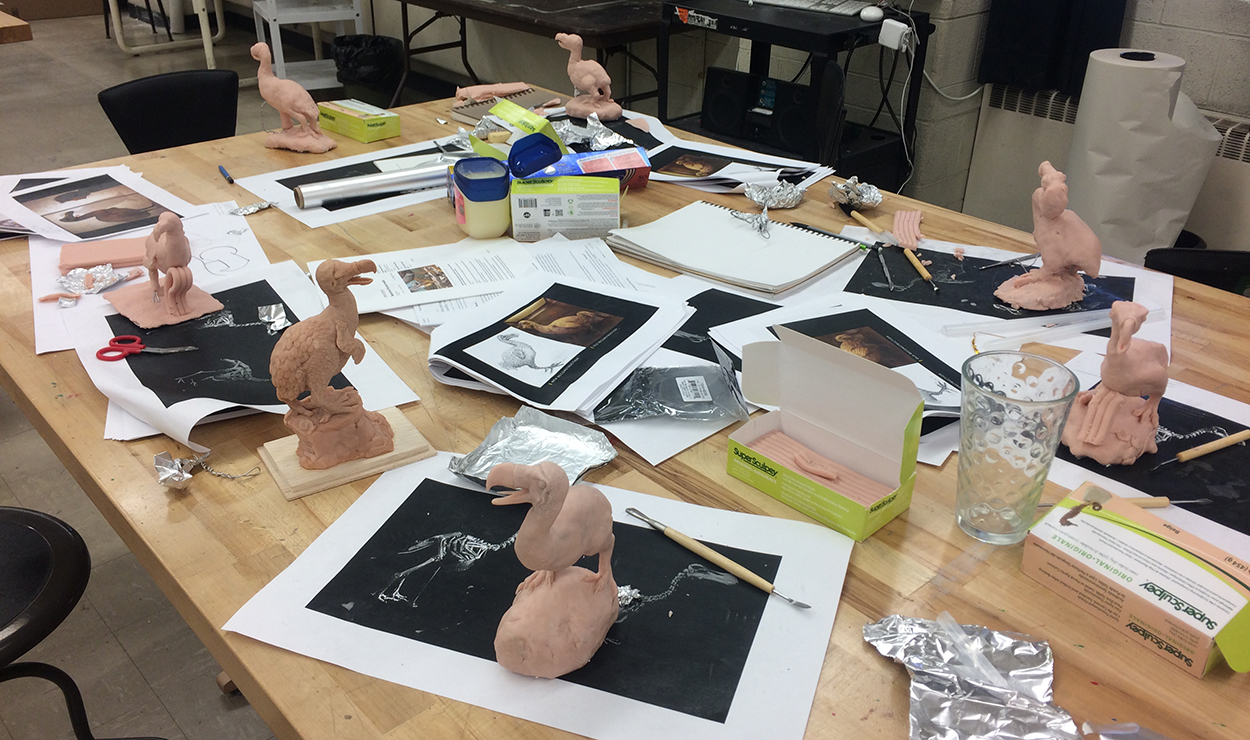
At the end of the first day, the creatures were really starting to take shape. I don’t often see a table of dodos on the campus.
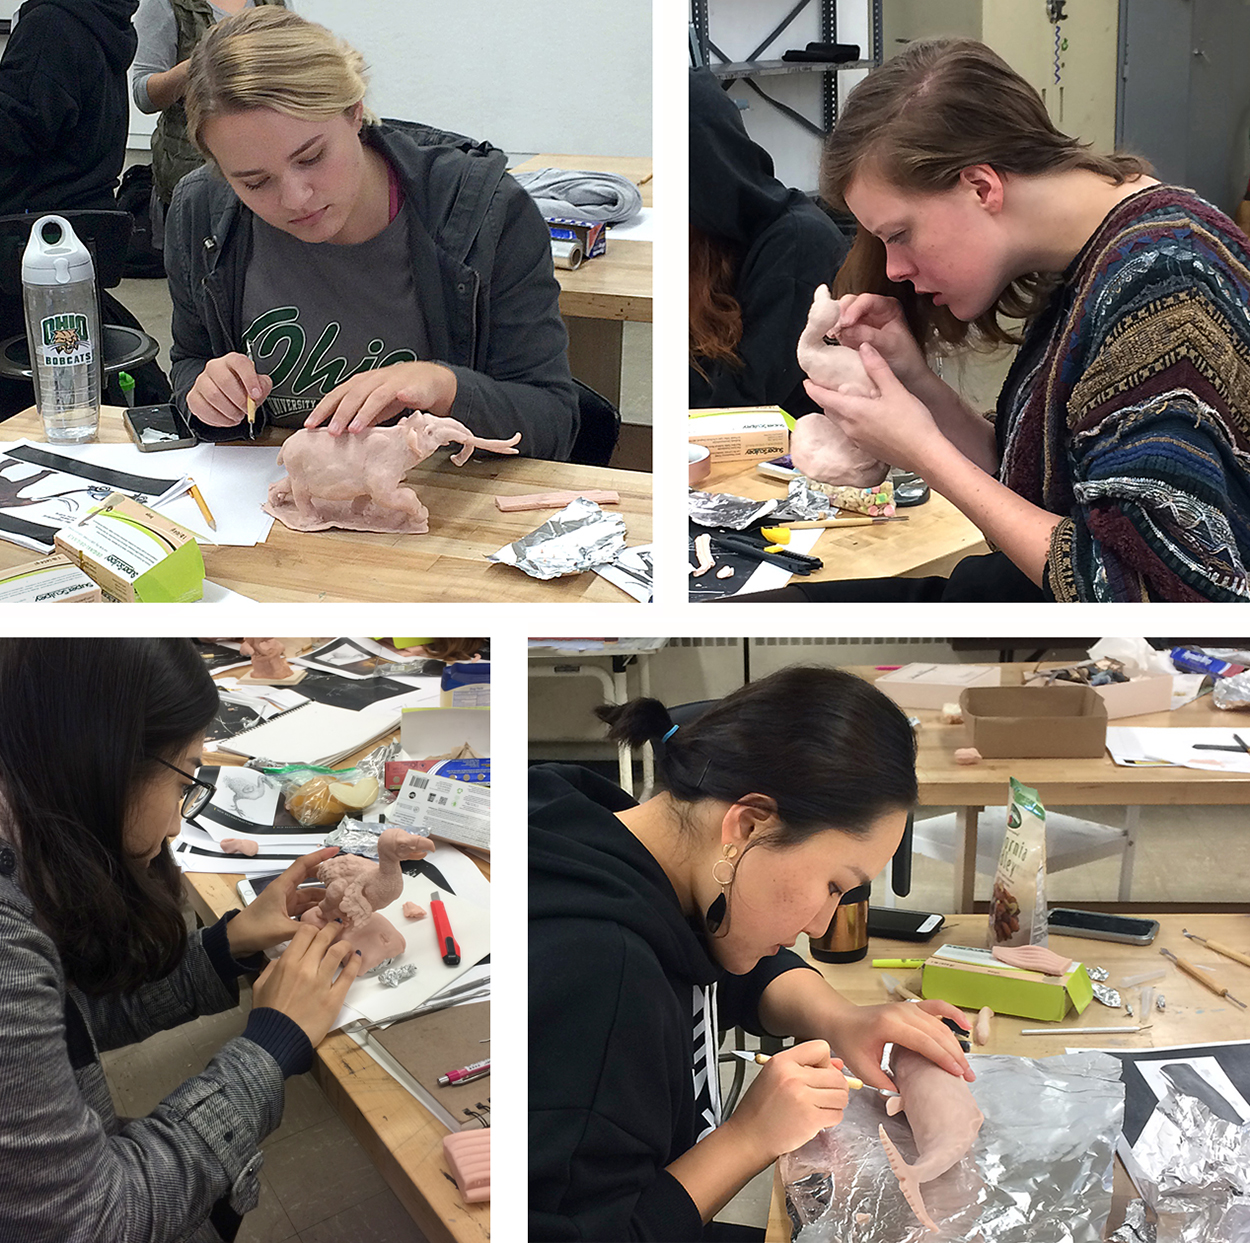
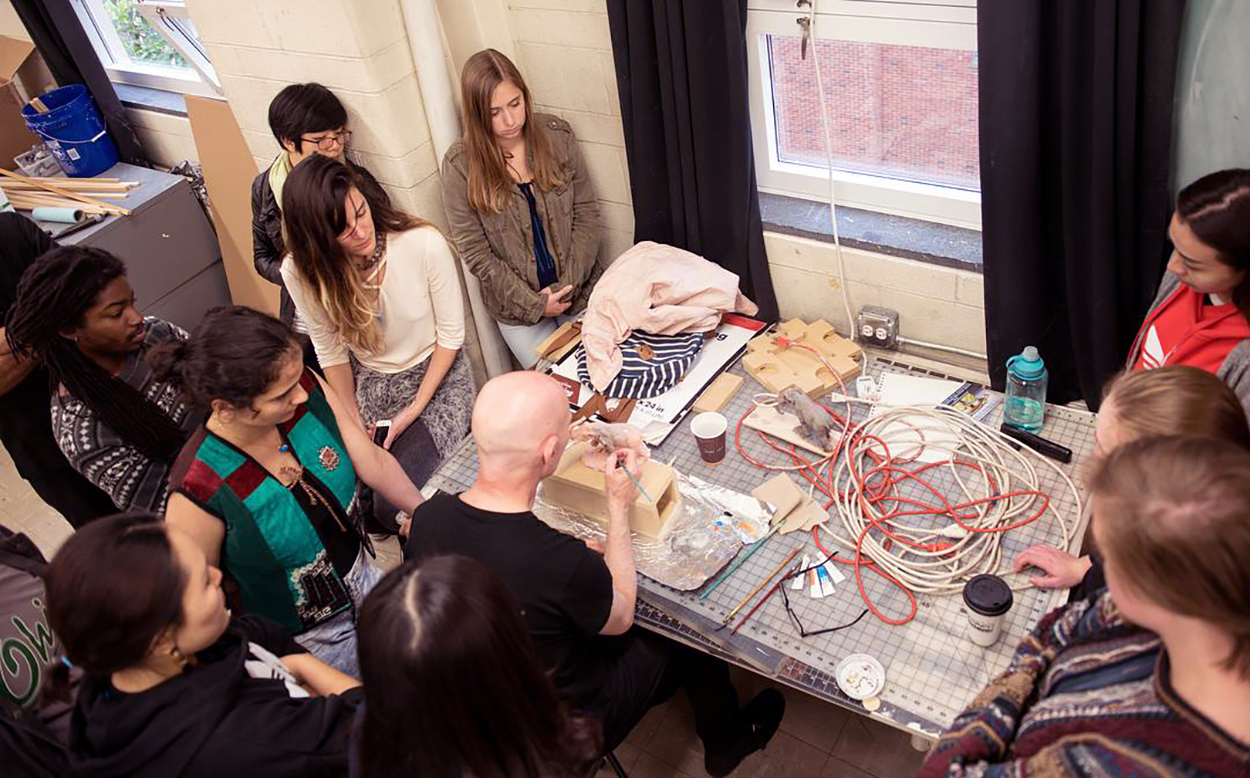
Day Two Refining the models. Adding the fine detail needed some serious concentration.
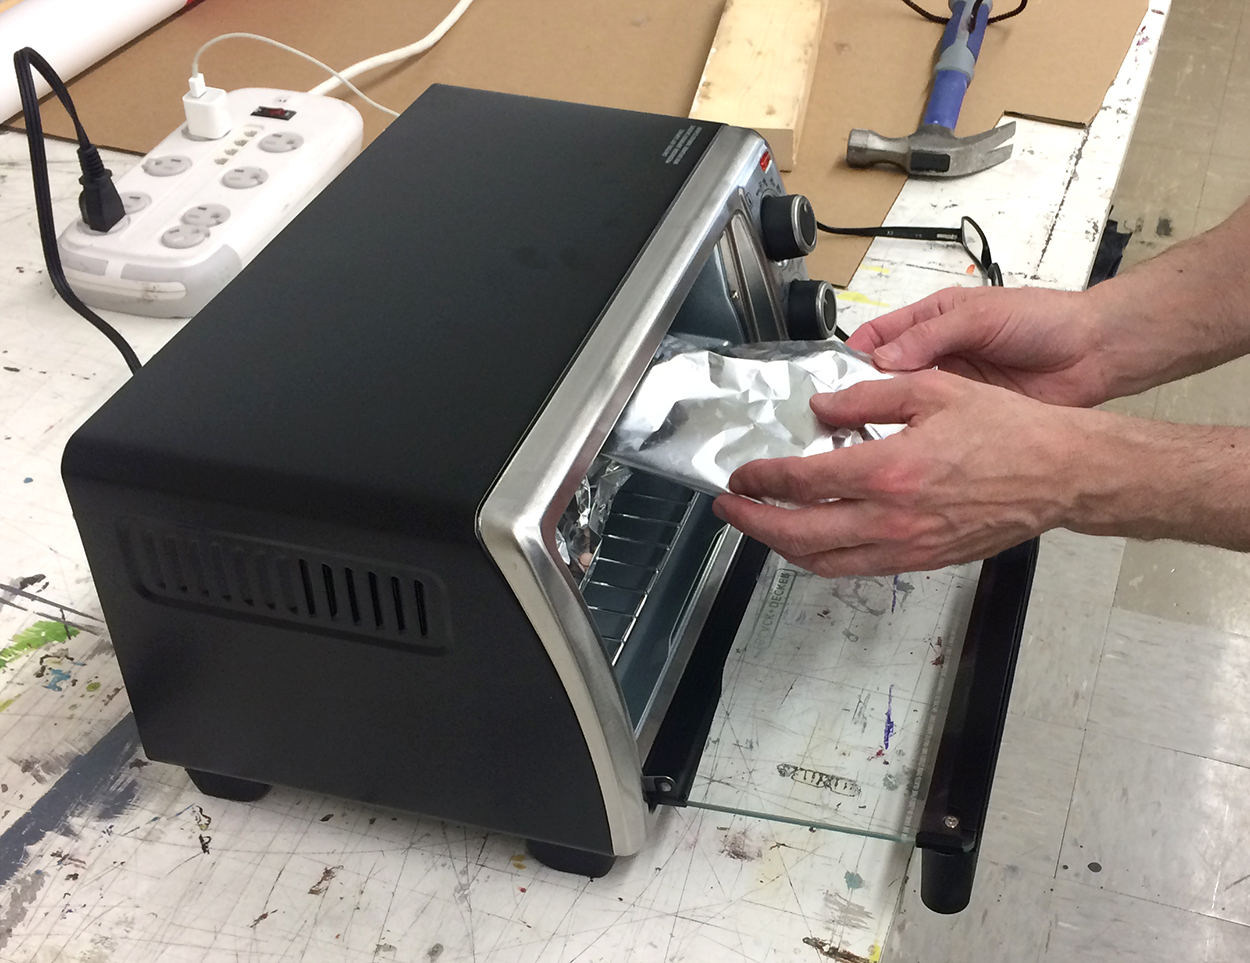
Small parts, like teeth and horns, were placed into a toaster oven to make them firmer, and easier to apply to the sculpture. The complete model would be hardened later this way.
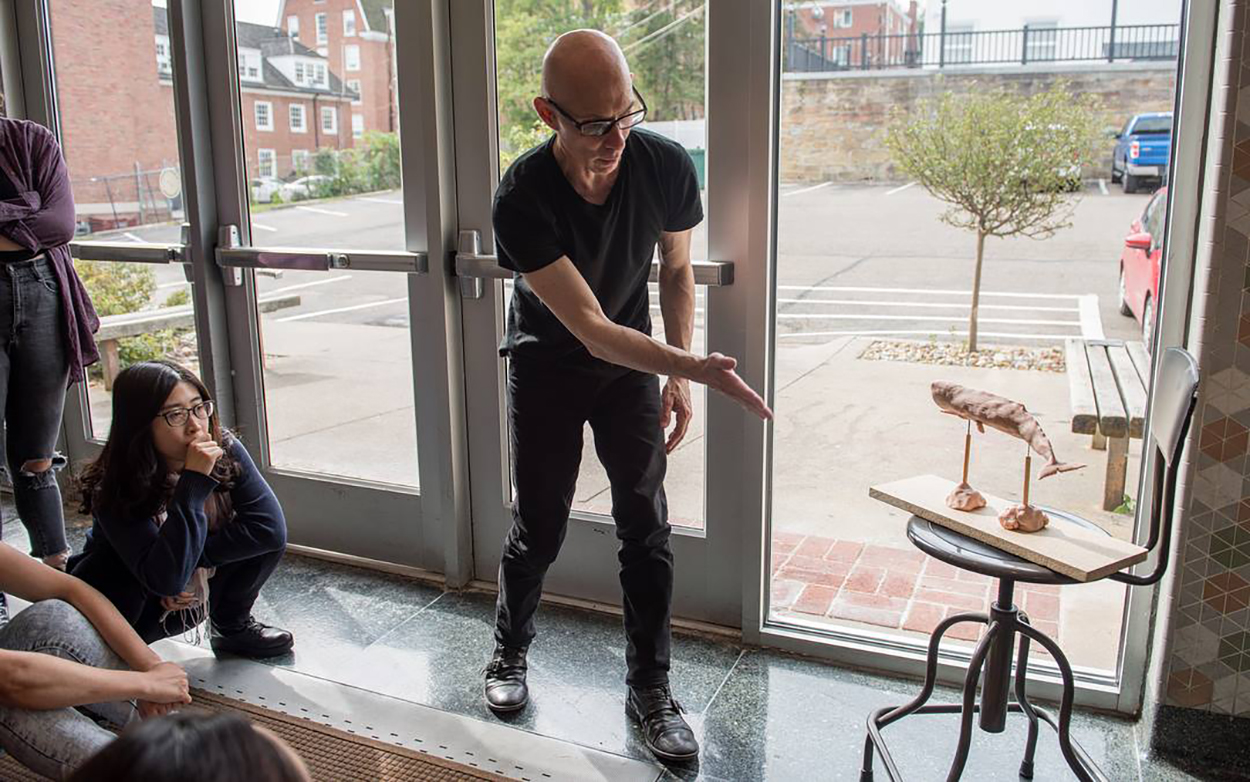
Fernando showing how to use natural light to bring form and effect to a sculpture.

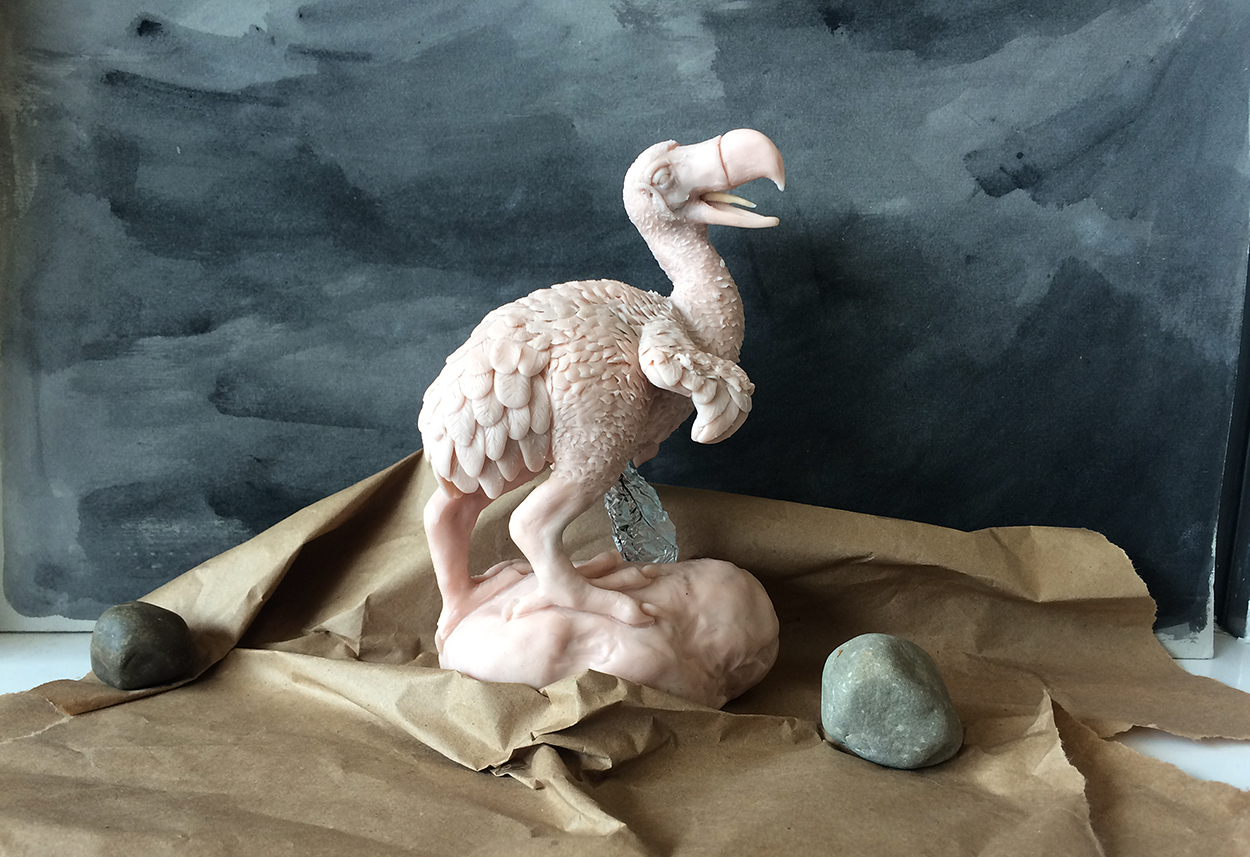
Photograph by Kisha Ravi.

A painted background, and some crumpled paper that will later become a rocky area in Photoshop.
Fernando tells us how a stop-motion animation of a whale can be created with simple paper shapes.
Students watch the master using his painting technique. There wasn’t enough time to paint the models, but color will be applied, either manually or in Photoshop, after the workshop. Several students told me that they intend to carry on with the projects, and develop them for their portfolios.
Photograph by Kisha Ravi.

Starting to build a computer version of an infographic.
The workshop was a huge success. In no small part because Fernando put enormous effort into working with each student to help them move forward. It was tiring for me just to watch him assisting all those students for hour after hour. Thank you, Fernando!

Photograph by Kisha Ravi.

My overall impression: This is one of the best creative experiences we’ve ever offered our students. Fernando is a craftsman with a passion for information and explanation. And one of the nicest people in our entire field.

The School of Visual Communication: https://www.ohio.edu/viscom/
The School of Art + Design: https://www.ohio.edu/finearts/art/

VisCom on Instagram: https://www.instagram.com/viscomohiou/
Kisha Ravi on Instagram: https://www.instagram.com/kisharavi/