Category: Infographics

Illusion

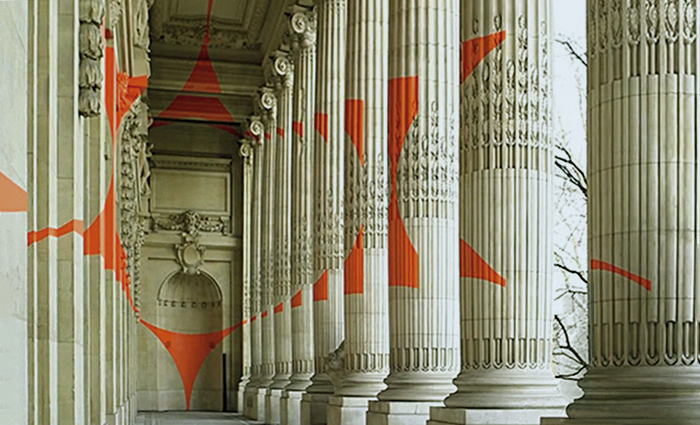
DECEIVING THE EYE.

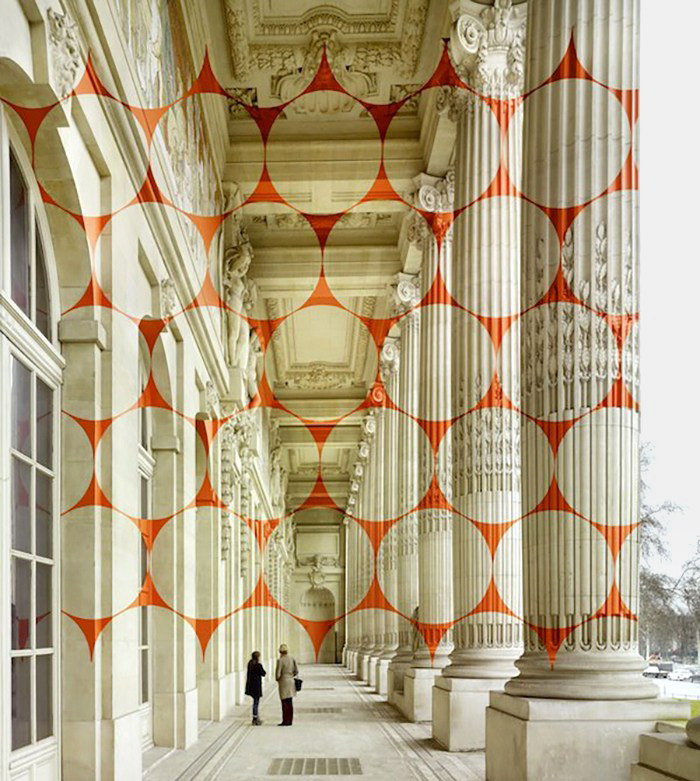
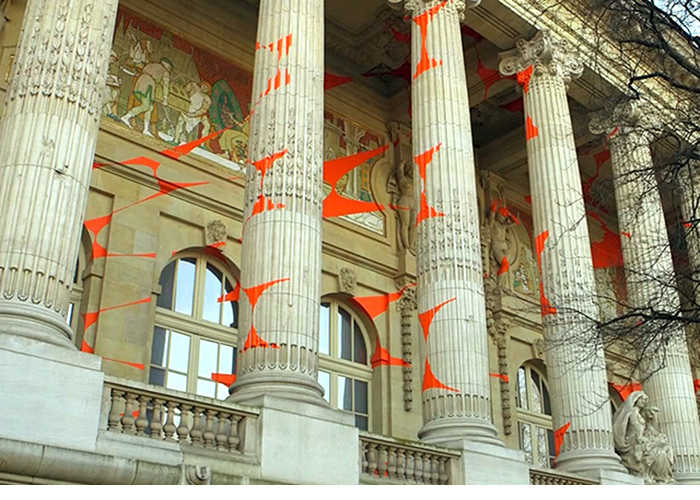
Space master Felice Varini creates geometric images, in public spaces, that defy our visual logic. His team uses a projector and stencils to painstakingly put each distorted component in the correct place. When viewed from a precise position, it all locks together for a spectacular effect. This example was installed on the Grand Palais in Paris. http://www.varini.org


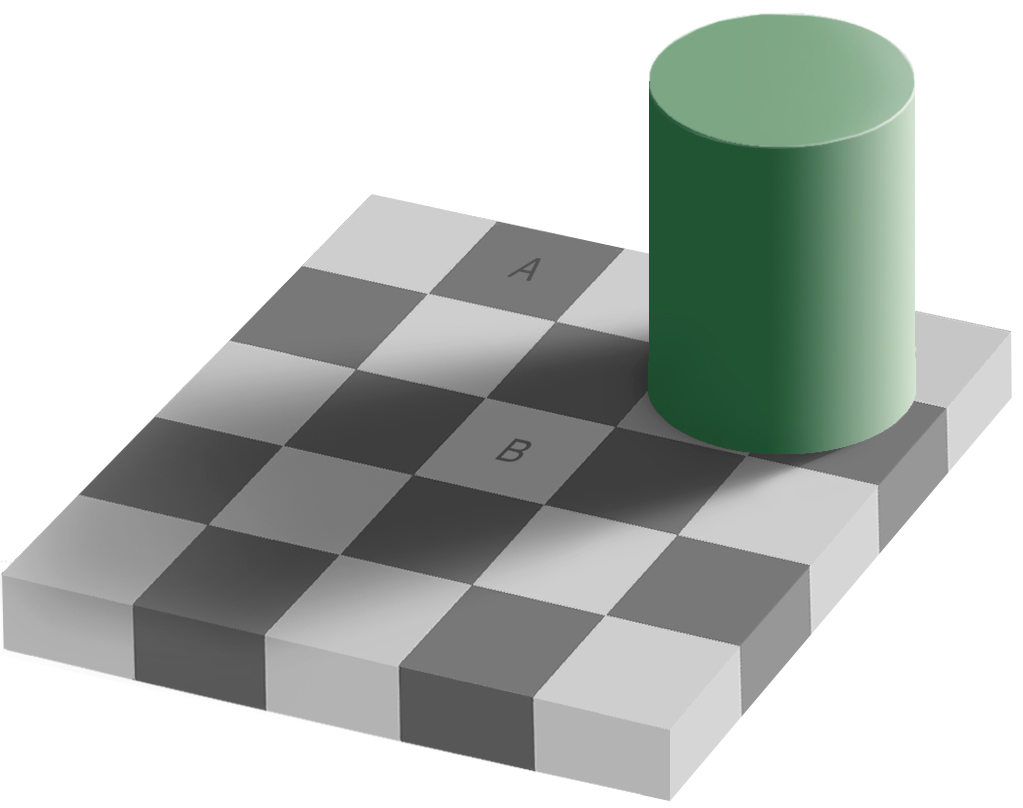
The same squares
A and B are identical. It’s all a matter of contrast.

Old favorite We all know this kind of image. Two faces or a white vase?


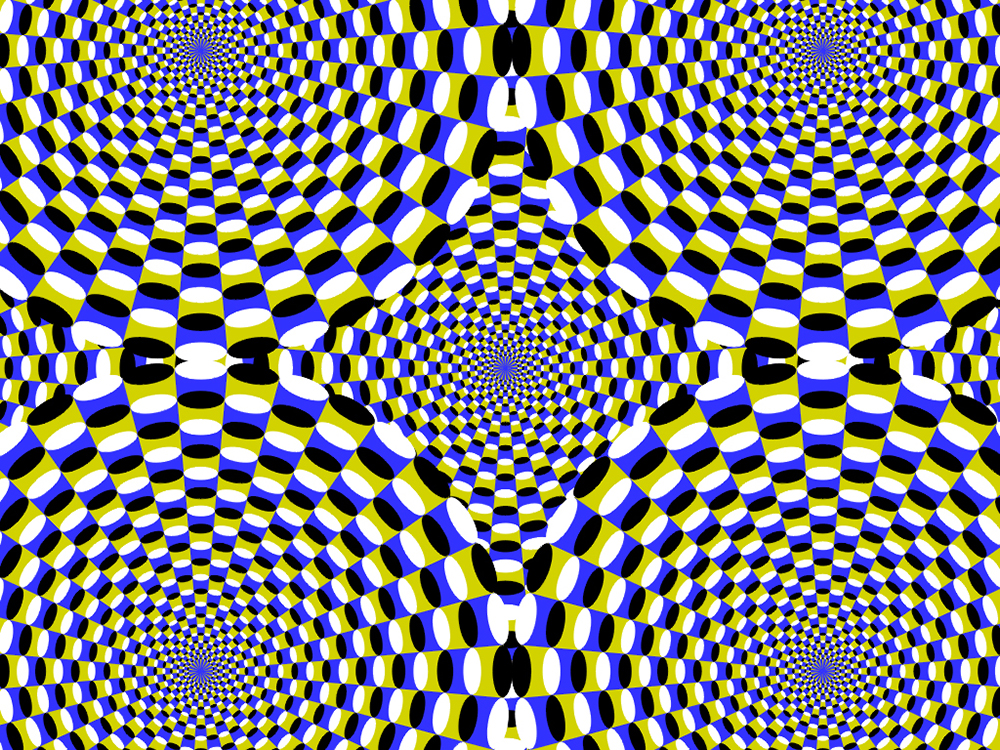
Motion
Strangely transfixing.


Not motion
 This is a static image. Where’s the Dramamine?


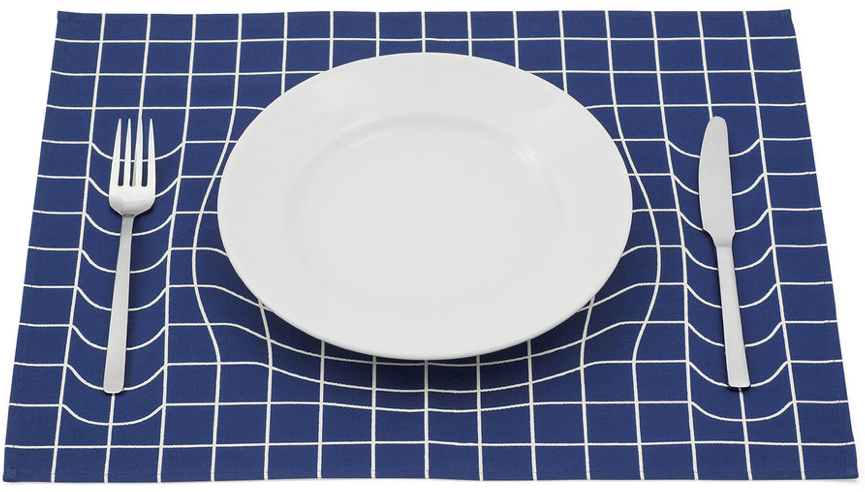
Dinner table
Everything appears to be sinking into the dining table with this completely flat placemat. goo.gl/VbQ3oY


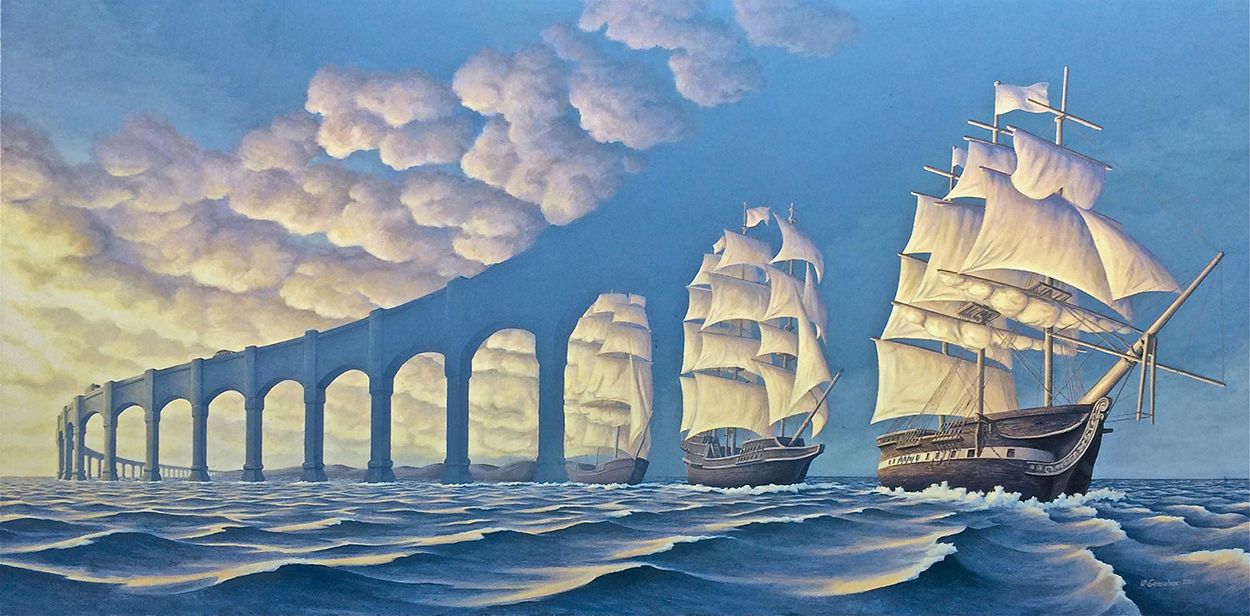
Illustrations that bend reality 
Below, by Robert Gonsalves.

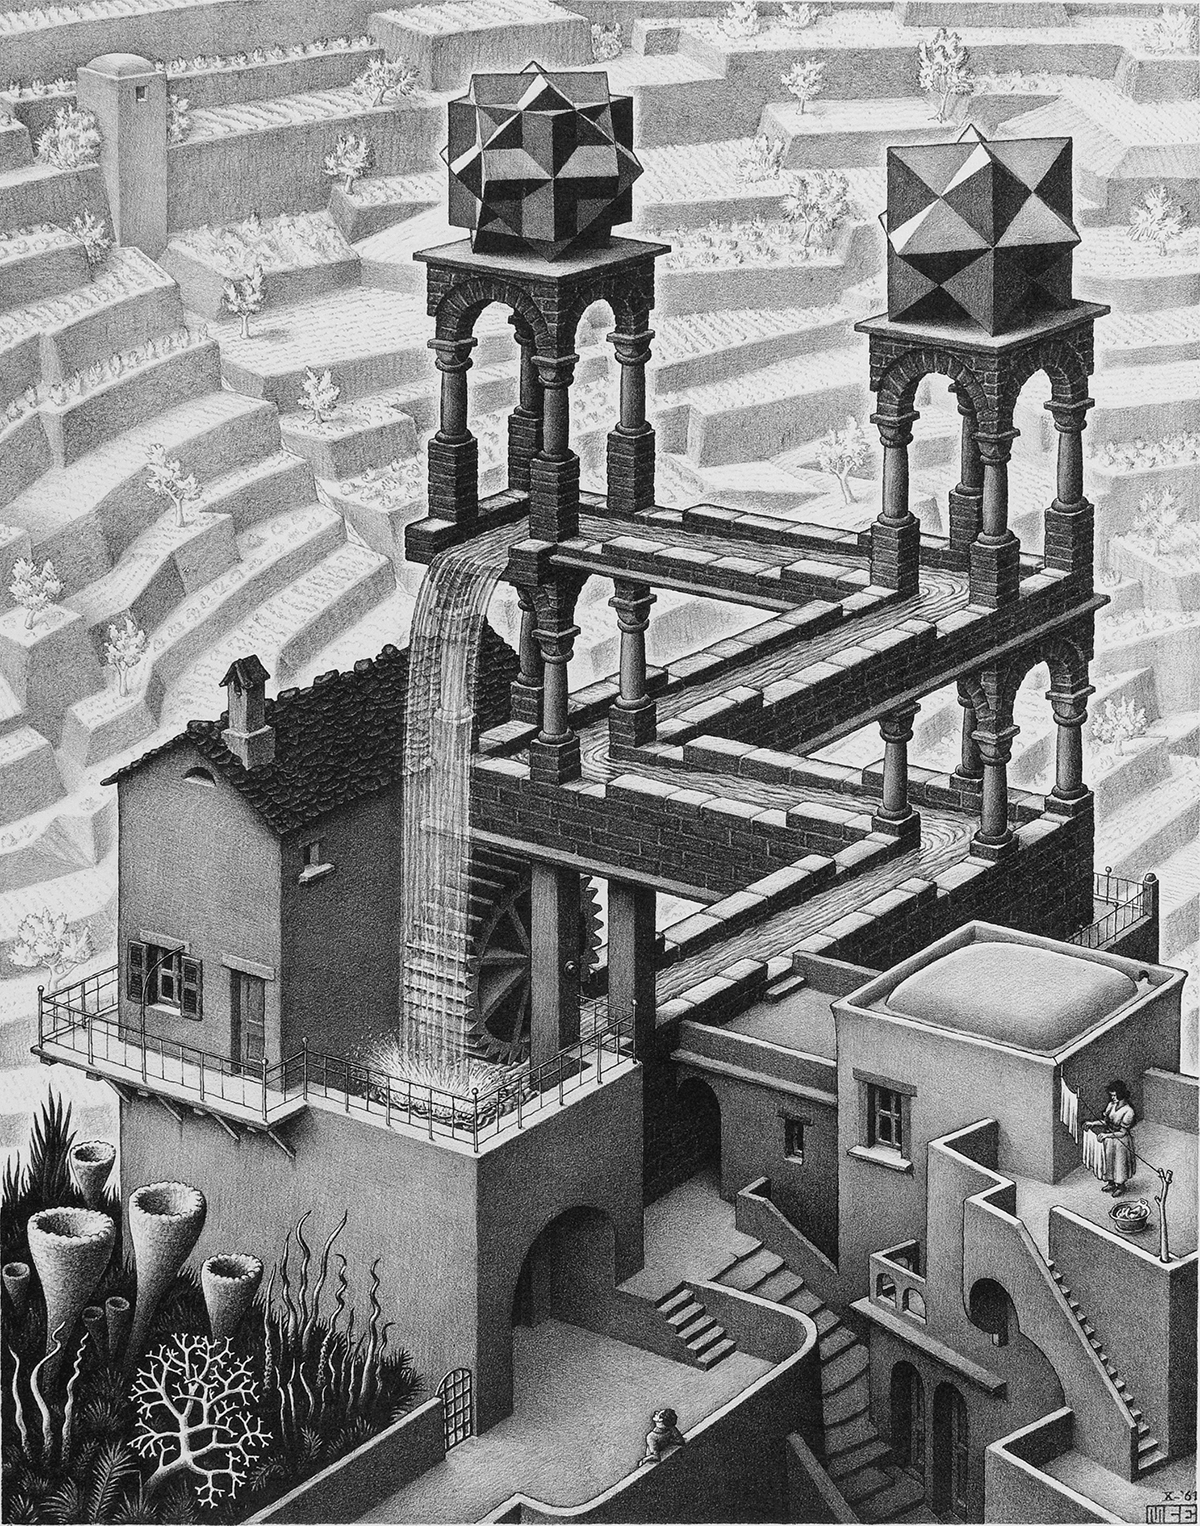
An example of the very popular work of M.C. Escher.

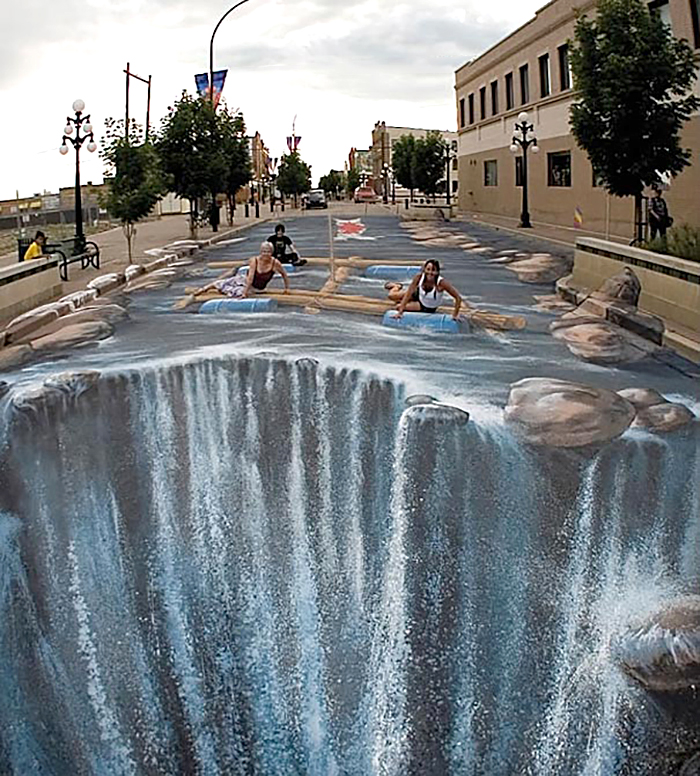
Chalk artists know how to manipulate perspective. By Edgar Mueller.

Equator

DIVIDING PLANET EARTH IN TWO.

This post is the result of a conversation with Majo Carrasco, who is going to be a T.A. in my data visualization class next semester. She’s from Quito, Ecuador (which means Equator).

The Mitad Del Mundo (Middle of the World) monument, near Quito, sits on the dividing line between the Northern and Southern Hemispheres.

Well, almost. The real position is about 250 yards (229 meters) away at the Intiñan Solar Museum. GPS has provided a more accurate location than the one that was fixed by a French expedition in 1736. The Prime Meridian in Greenwich is also not in the right spot. It’s really 111 yards (102 meters) away from it’s marked location. Below, at the more accurate site. Photograph by C.T.Johansson.


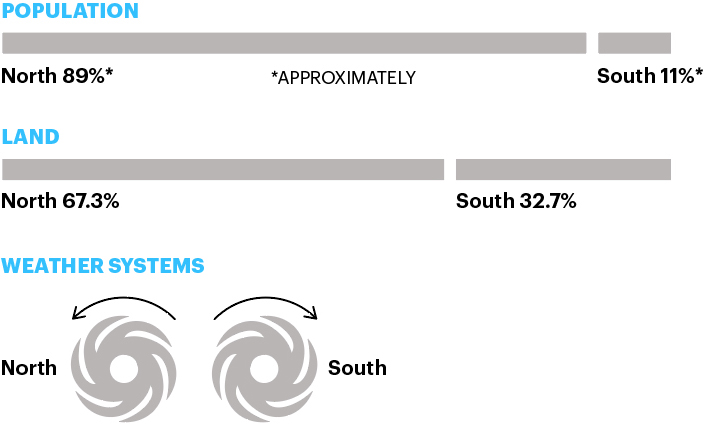
Some differences between the hemispheres:


I thought that the rotation principal also applies to water draining from a sink, but there seems to be considerable disagreement on this assertion: goo.gl/yRzjRr

Night sky The Southern Cross cannot be seen from most of the Northern Hemisphere, and Polaris, the North Star, cannot be seen from almost all of the Southern Hemisphere. But from the Equator, both are visible.
Below, the Milky Way from the Southern Hemisphere (La Silla Observatory in Chile).


Photograph by ESO/H.Dahle.

D.C. data viz

A WEEK OF DATA INSIGHT.

Six lessons from the experts A few weeks ago, I was in Washington with ten Scripps College of Communication students who are the pioneers of our “Semester in D.C.” program. We visited several top data visualization (and infographic) departments, who were very generous with their time. There were some common (and often encouraging) themes.

The points below are not great relevations to the people who read this blog, but perhaps it’s a good thing for us all to stop and reflect on the way forward for our field. They are skewed somewhat towards news outlets, as those were mainly the places we visited.


1. Mobile first Everyone is seeing their audience steadily migrating to mobile, so that has become a big factor in data design. Simpler, often static, displays with limited interactivity are common. Many of them are controlled by scrolling.


2. Limited interactivity On all platforms, if a tap or click is required it has to deliver something that feels worth it. Obviously, mobile (with it’s limited screen size) can be challenging for this kind of interaction anyway.


3. Design for the intended user 
Crucial when making decisions about the level of complexity, and the type of presentation. Often, displays of data are not well-enough refined for their target audience. For example, Vox aims for general consumption, especially through social media, and takes a more edited and popular approach, while the Pew Research Center provides a more comprehensive (“Fact Tank”) view for people who need more information.


4. Basic chart types are often the most effective The more challenging types of chart forms should be used with caution. Make sure that they are the best way to display the information. Often they look exciting, but are not good in terms of clearly visualizing a particular dataset.


5. Transparency Let your readers download the data that you’ve used. They can then see for themselves if the visualization clearly reflects the dataset. Even chart it themselves with their own preferred software.


6. Sketch out ideas Every department used rough visuals, drawn with pencil and paper (or it’s digital equivalent) to initially explore data presentation ideas. Great news for veteran infographic people like me who are always advocating this (to the point of being really annoying).


LINKS TO THE ORGANIZATIONS
(In the order that we visited them). The trends mentioned above are, of course, reflected in these examples.

The Urban Institute https://www.urban.org/data-viz

The New York Times (We visited the Washington Bureau.)
The cost of Hurricane Harvey: goo.gl/ZeJLdR
The UpShot: https://www.nytimes.com/section/upshot
A gallery of last year’s visual stories and graphics: https://www.nytimes.com/interactive/2016/12/28/us/year-in-interactive-graphics.html

5W Infographics (Juan Velasco led a one-day workshop at the National Press Club.) http://www.5wgraphics.com/en/gallery.php

The Washington Post http://postgraphics.tumblr.com

Vox Calories in booze: https://www.vox.com/2016/7/25/12251286/calories-alcoholic-drinks-chart
Map projections: https://www.vox.com/world/2016/12/2/13817712/map-projection-mercator-globe

NPR Gun violence: http://www.npr.org/sections/goatsandsoda/2017/10/06/555861898/gun-violence-how-the-u-s-compares-to-other-countries

The Pew Research Center http://www.pewresearch.org
How voters switched candidates: http://www.people-press.org/interactives/gop-candidate-switching/
http://www.people-press.org/interactives/dem-candidate-switching/

National Geographic http://www.nationalgeographic.com/science/2017/09/cassini-saturn-nasa-3d-grand-tour/

Maze and labyrinth

WAYFINDING PUZZLES.

Classic hedge maze The Longleat Maze in Wiltshire (England) has viewing bridges that give people an overview before they return to the pathways between tall hedges. Photograph by Niki Odolphie.

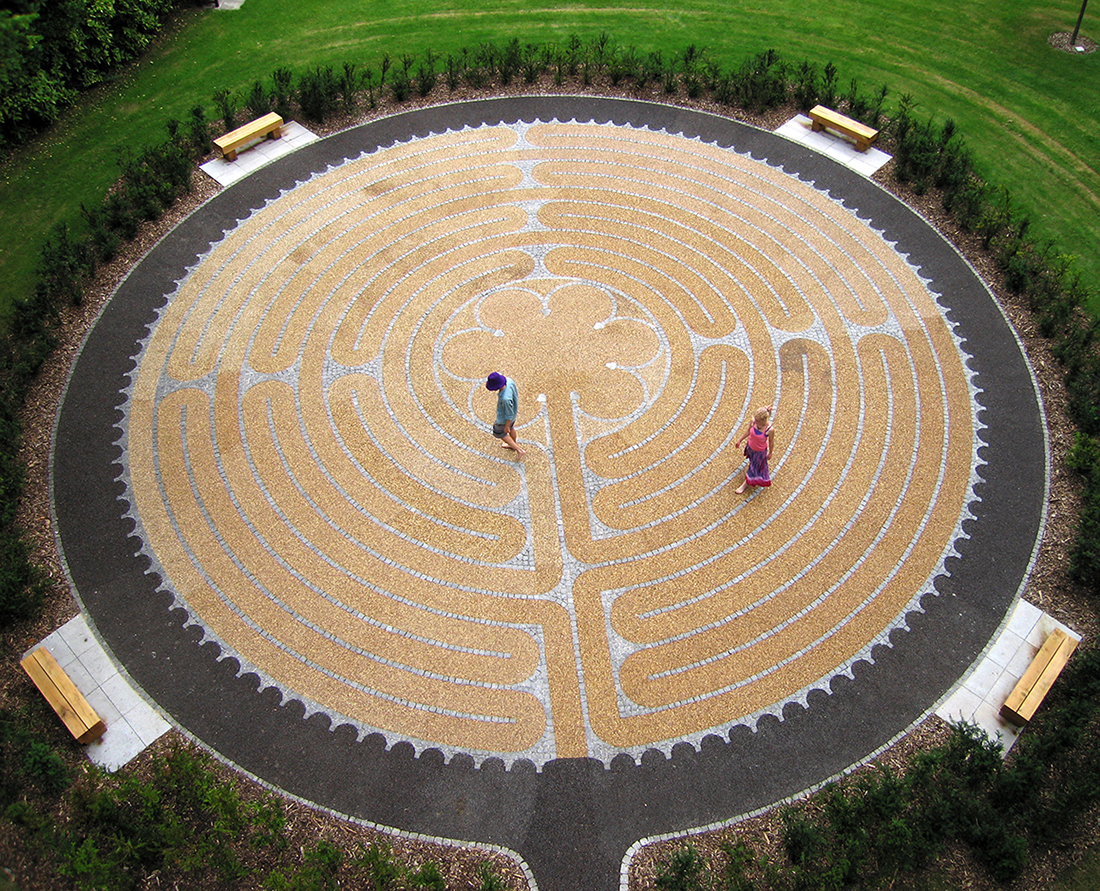
Definitions A maze has multiple entrances and exits, choices of direction, and dead-ends. A labyrinth has only one way in and one way out.

Garden labyrinth Below, the Edinburgh Labyrinth (Scotland) in George Square Gardens. Photograph by Di Williams.

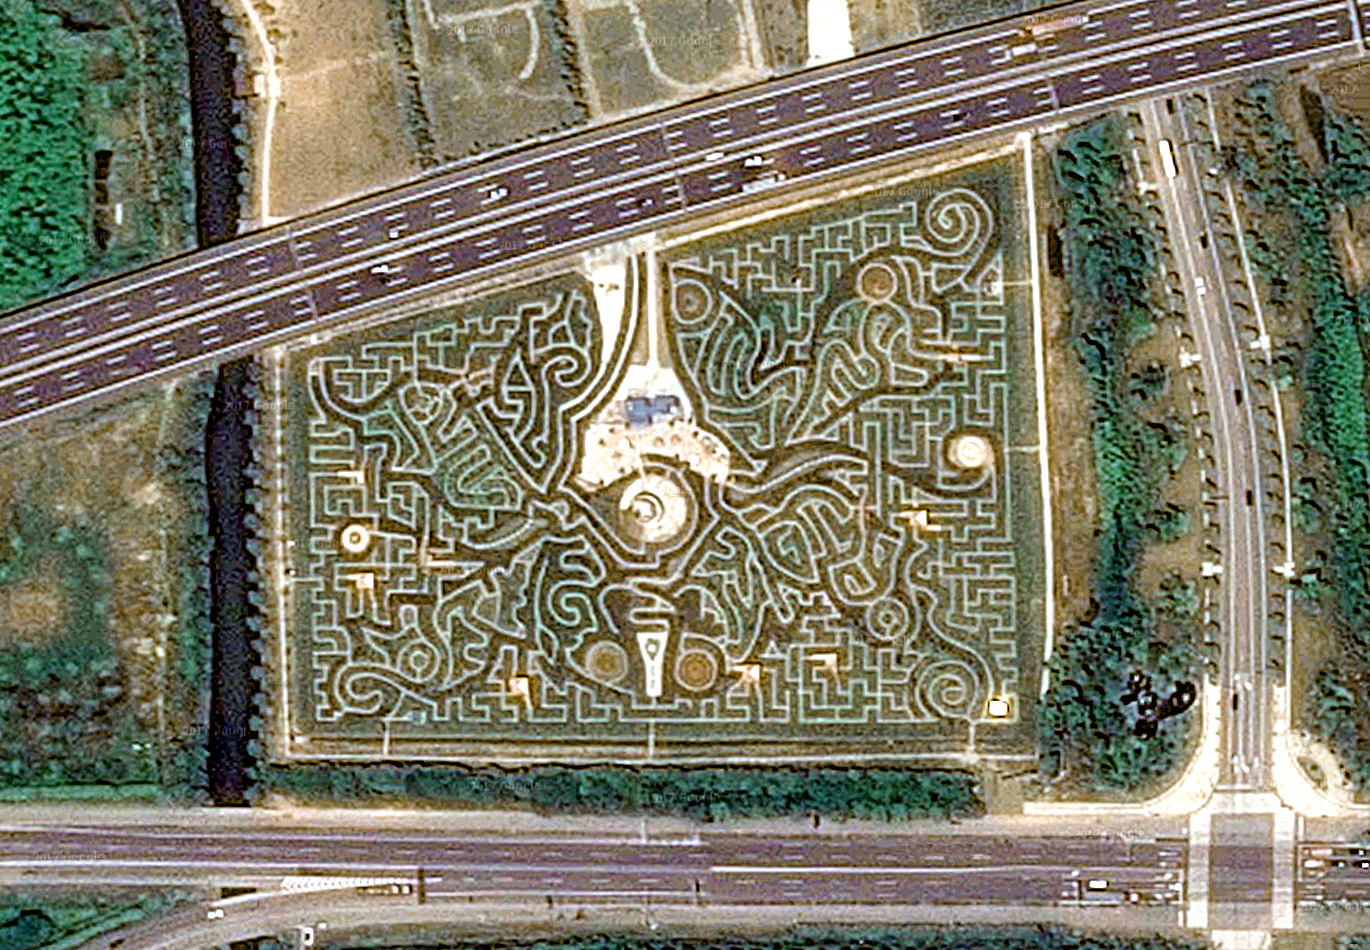
World’s largest The Guinness Book of Records lists The Maze of Butterfly Lovers in Ningbo, China, as the largest permanent hedge maze, with a total path length of 8.38 km (5.2 miles). It opened in April this year. Designed by Adrian Fisher, it contains the shapes of two butterflies. Adrian has designed hundreds of mazes and puzzles (in various formats) all over the world. Image from Google Maps.


Labyrinth project
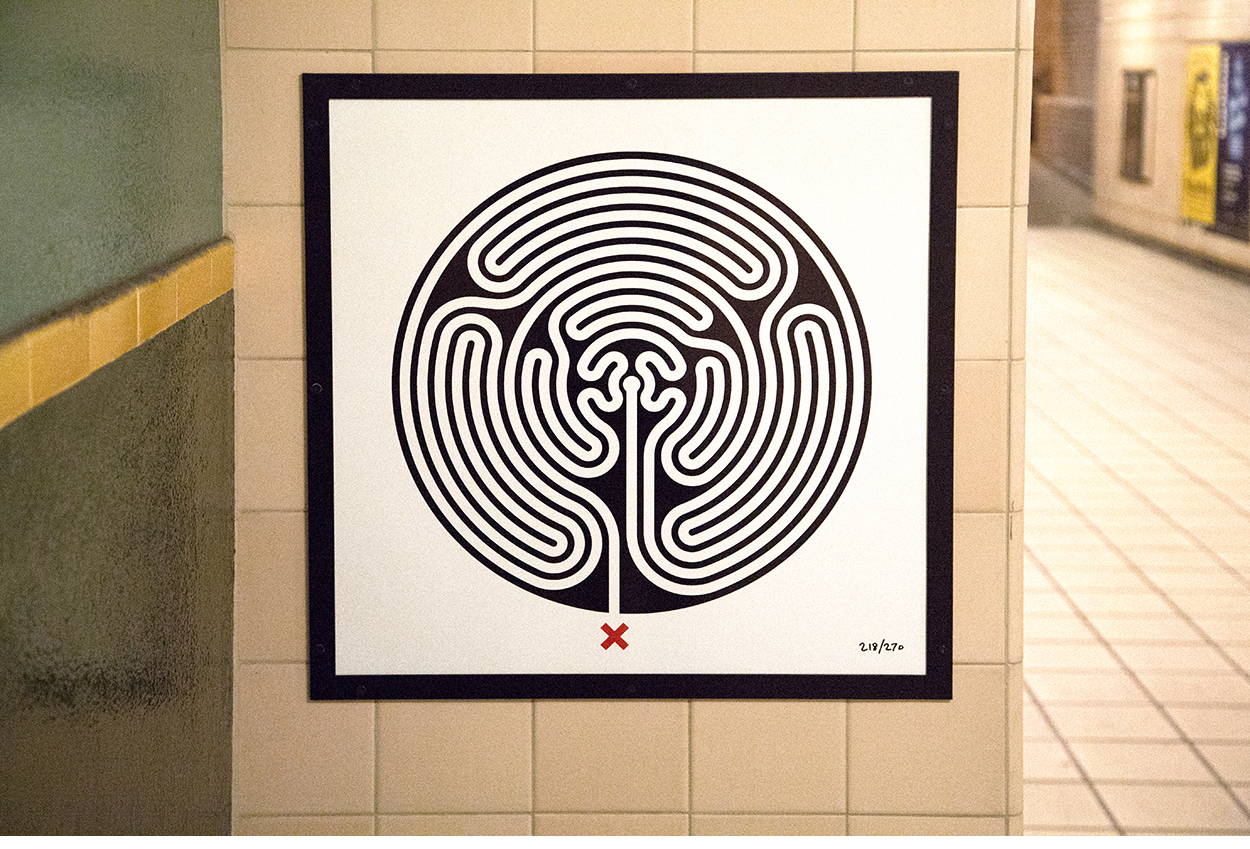
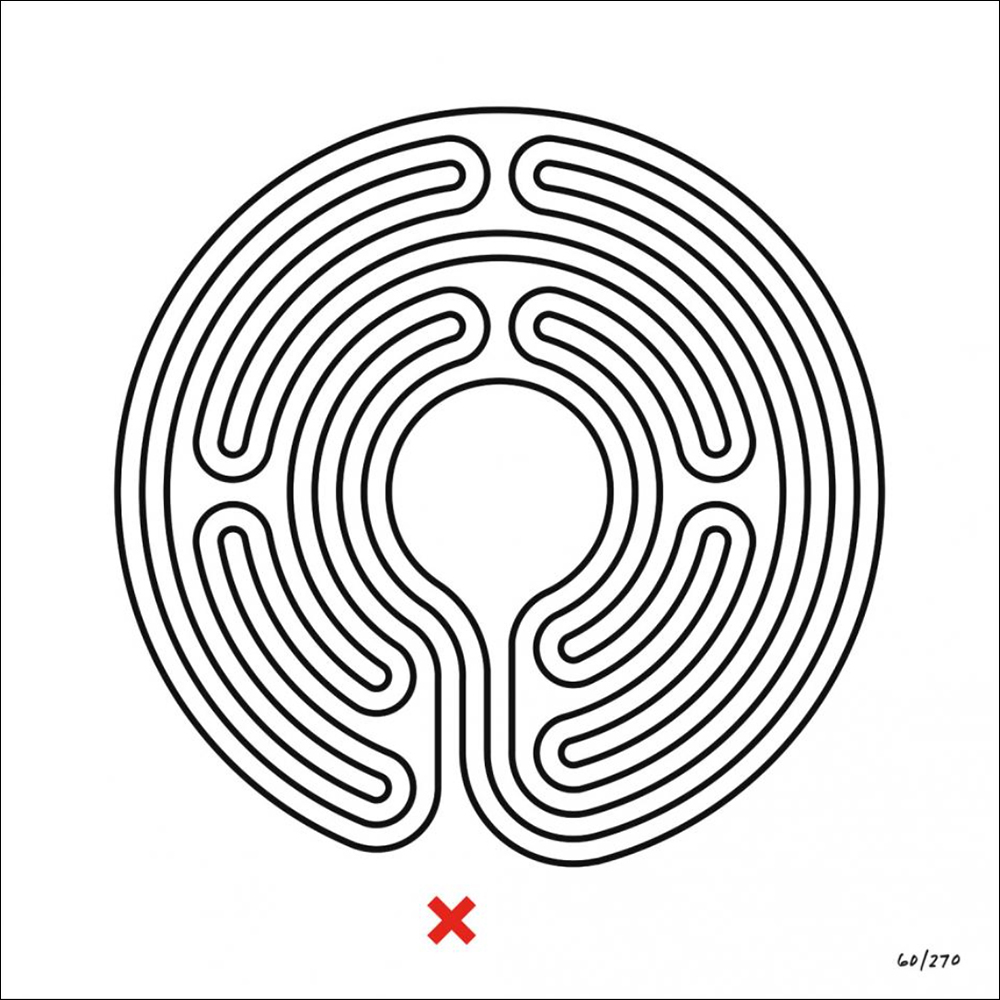
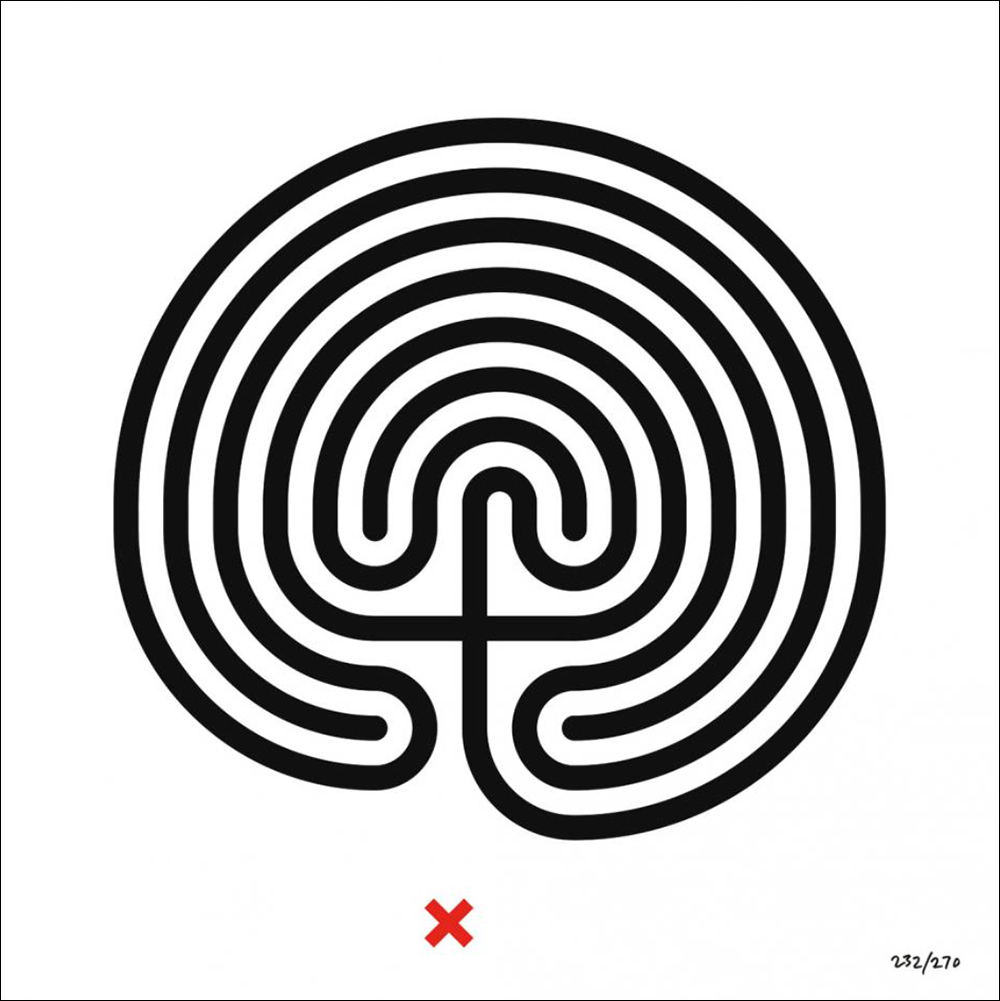
As a celebration of the 150th anniversary of the London Underground in 2013, Mark Wallinger created a unique enamel labyrinth for every one of the 270 stations. They’re a connection to the system’s history of classic graphic design, and reflect the idea of entering the labyrinth of walkways and tunnels that make up a journey.


Photograph by Jack Gordon.

All of them are photographed here: http://labyrinthtubephoto.tumblr.com

Hazardous

VISUAL WARNINGS.

The biohazard symbol was designed in 1966, by Charles Baldwin, an engineer at the Dow Chemical Company.

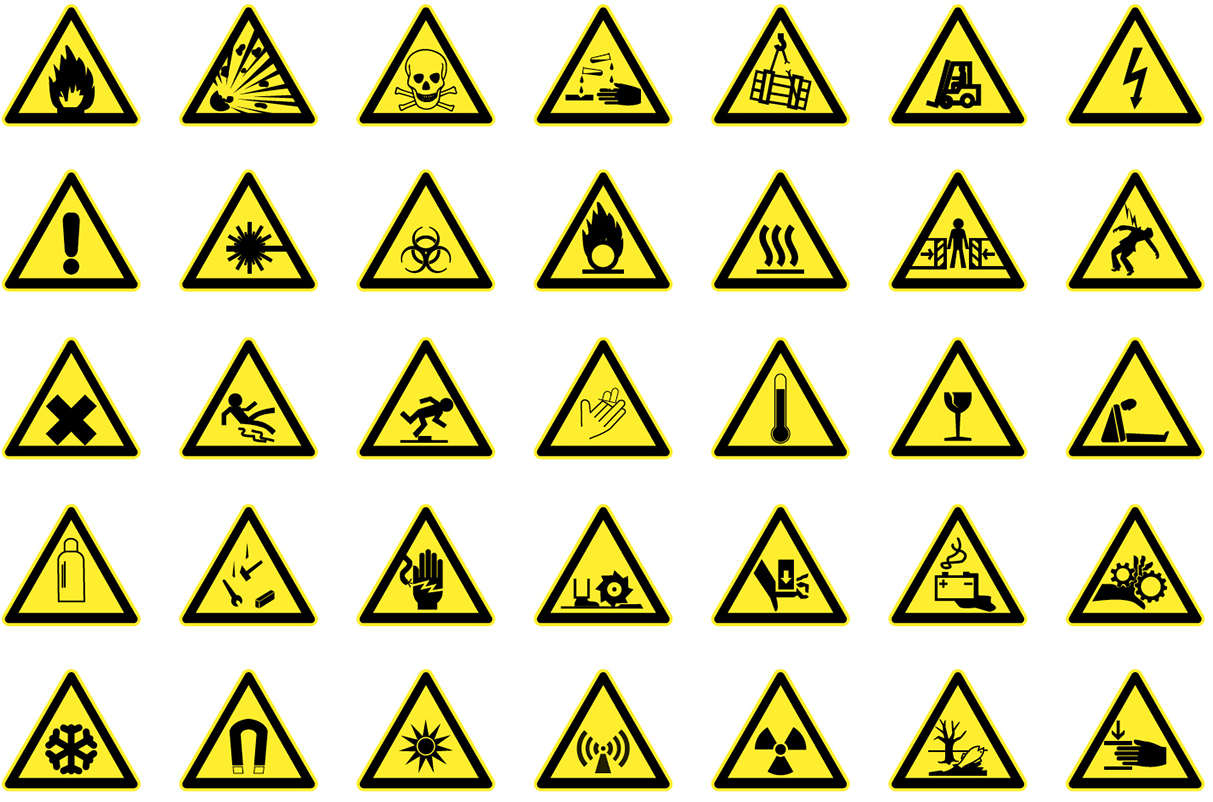
Below, a set of hazard warning pictograms.

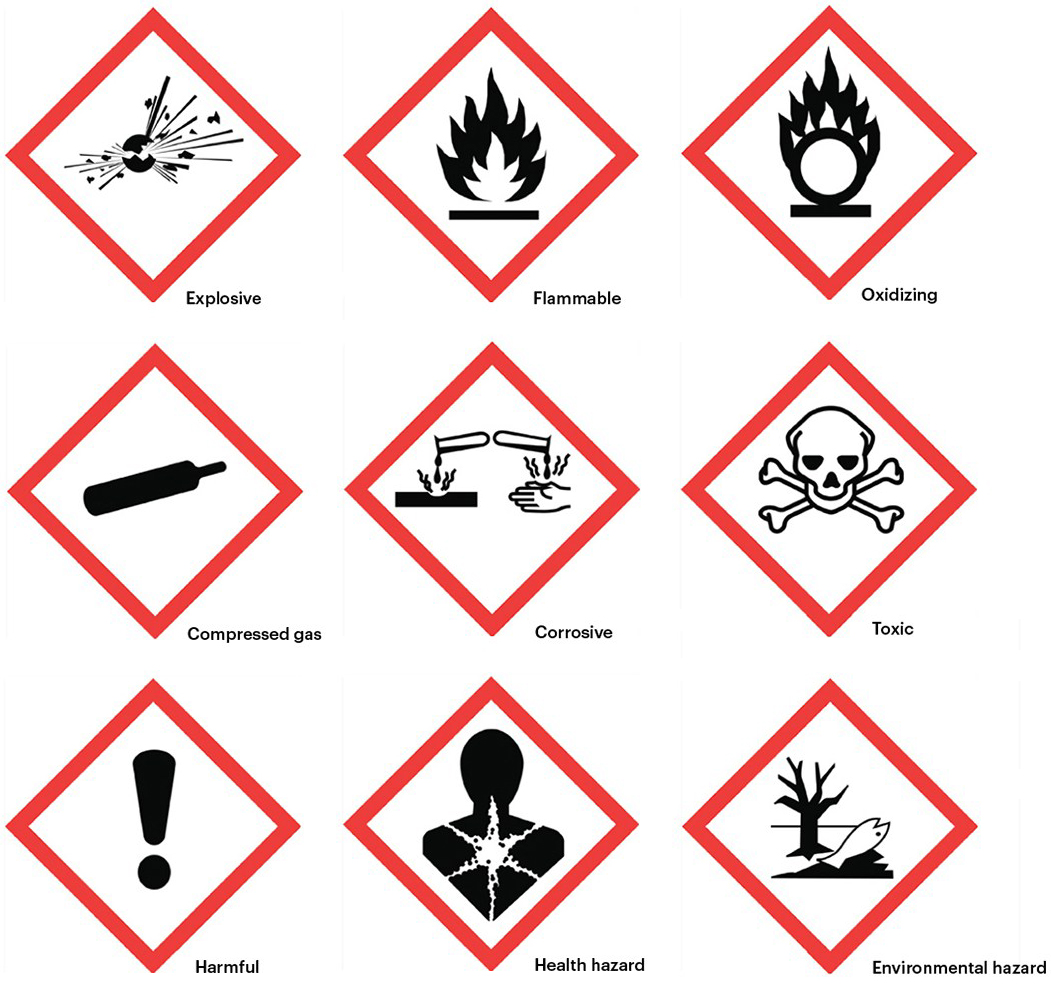
GHS The Globally Harmonized System is a universal set of symbols from the United Nations.


Nuclear waste
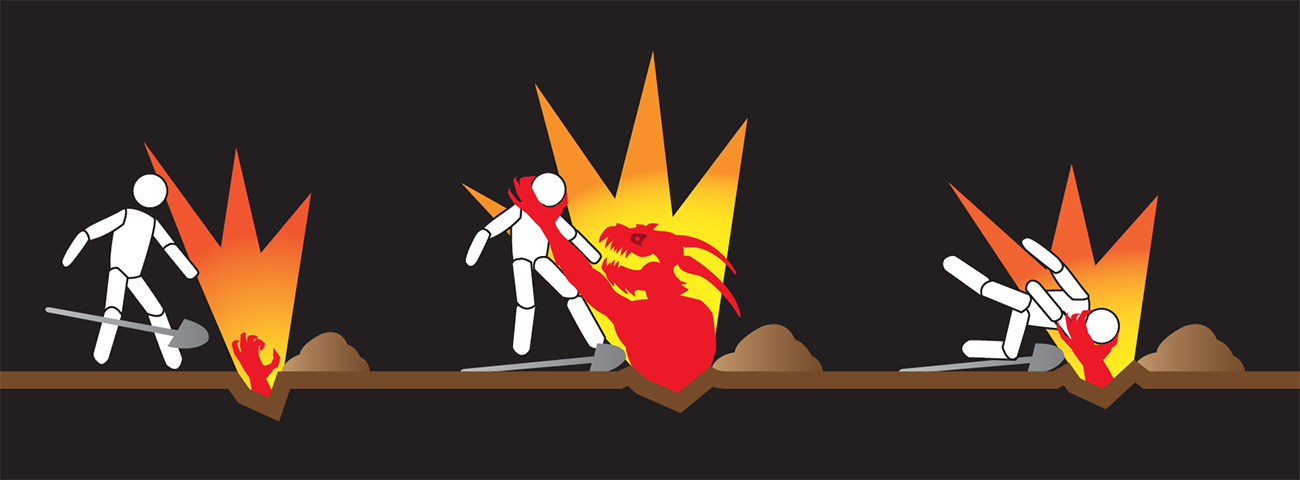
How do we warn people of buried toxic waste without words? And stop them from digging it up. We don’t know if mankind, thousands of years in the future, will understand any radiation hazard symbols, or a written warning (in any current language). This clever visual solution, by Nick Shelton, was for a School of Visual Arts infographics project.

A detail.


Mosquito sign
 Maleria is a huge problem in some countries.


Flight ban
The items that you should not take to the airport. (From an American Airlines check-in page.)


Radiation
Designed at the University of California in 1946. It symbolizes activity radiating out from an atom.


Effective
We know to proceed with caution if we see this.

Place names

THE LONGEST, THE SHORTEST.

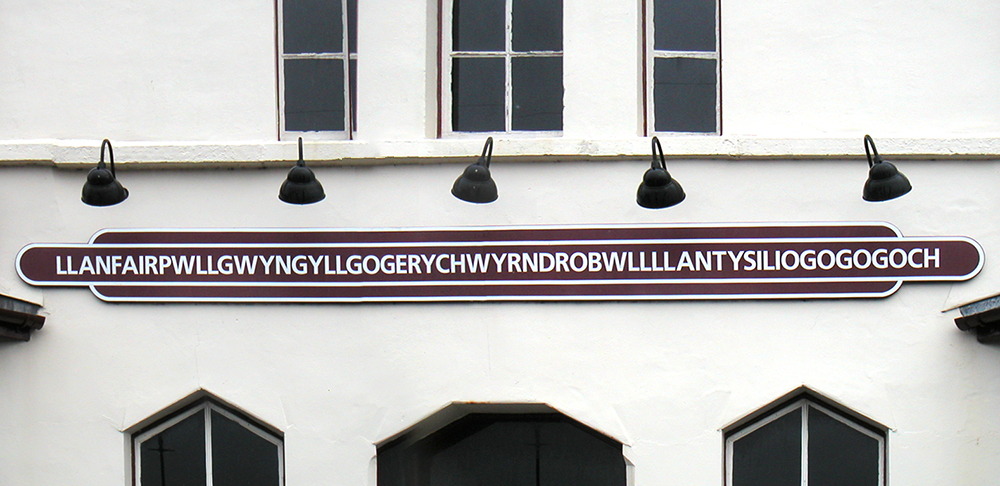
58 letters I always thought that this Welsh railway station sign was the world’s longest. It means: “Saint Mary’s Church in a hollow of white hazel near the swirling whirlpool of the church of Saint Tysilio with a red cave.”

85 letters Then I came across this New Zealand sign. Translated from the Māori language: “The summit where Tamatea, the man with the big knees, the climber of mountains, the land-swallower who travelled about, played his nose flute to his loved one.”

One letter This Norwegian village has a difficult name to beat in terms of brevity. It means stream, or small river. There are several other As in Norway, Sweden and elsewhere, and many other one-letter contenders around the world, like Ô in France, and U in Vietnam.

Venn diagram

OVERLAPPING RELATIONSHIPS.

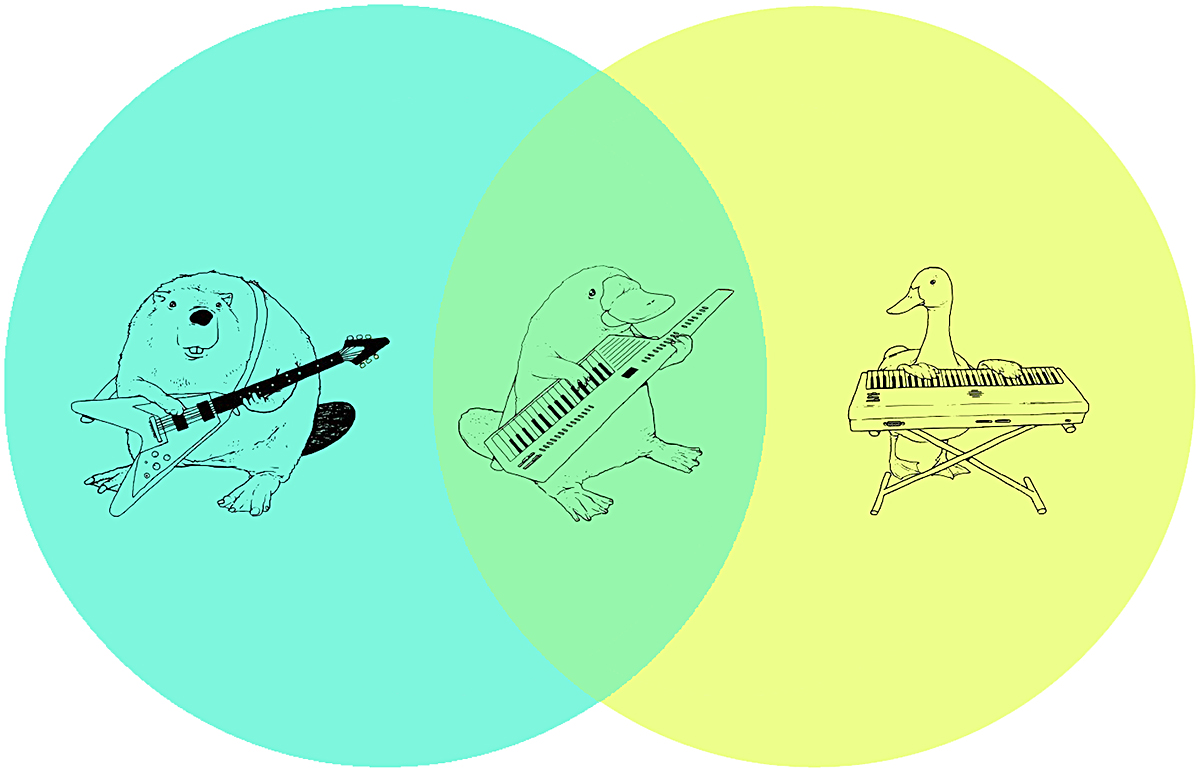
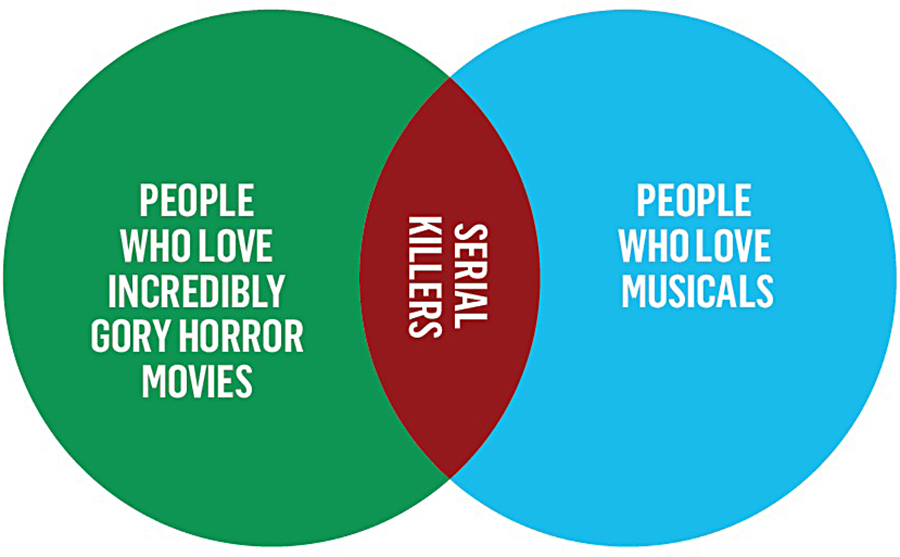
This brilliant example is by GuyBlank. There’s a t-shirt version here: goo.gl/VGA8nV

Venn diagrams are used to show commonalities and differences, primarily in mathematics, statistics and logic. Named after John Venn, a logician and philosopher, who highlighted them in an 1881 paper. They were developed from Euler diagrams of the 18th Century. By the way, Venn also built a machine that bowled cricket balls.

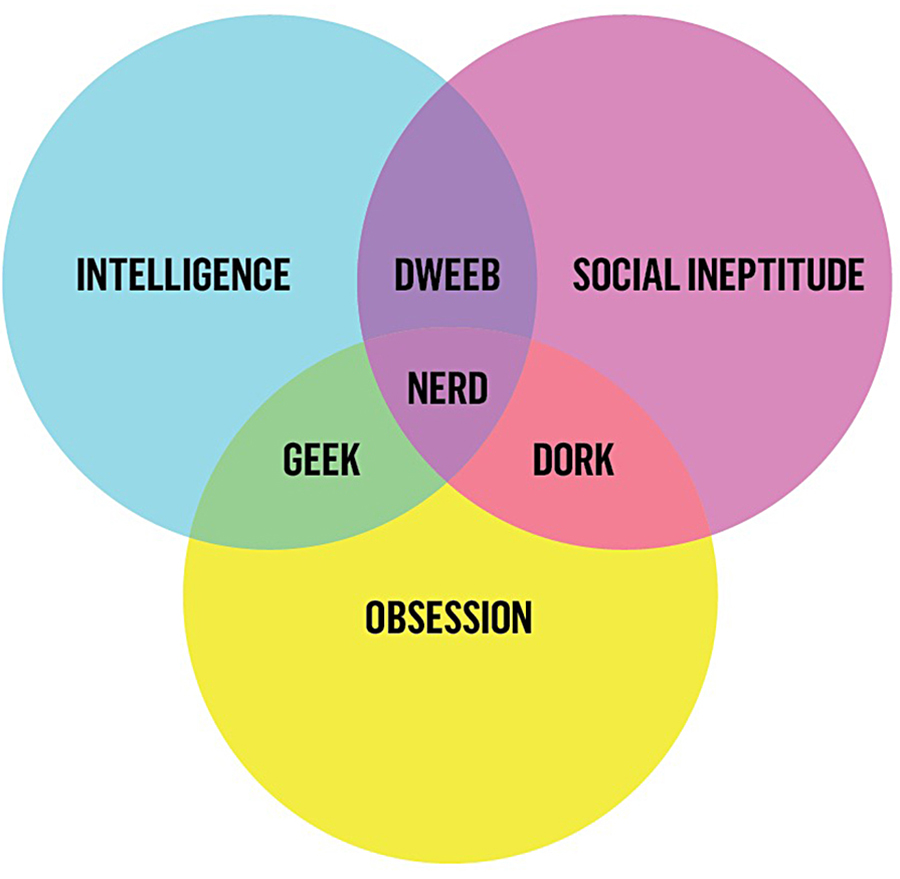
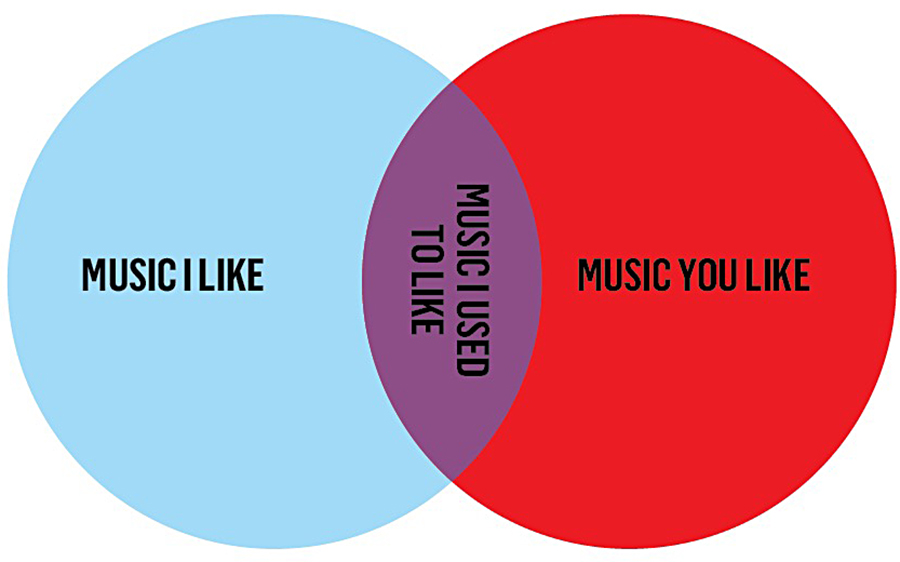
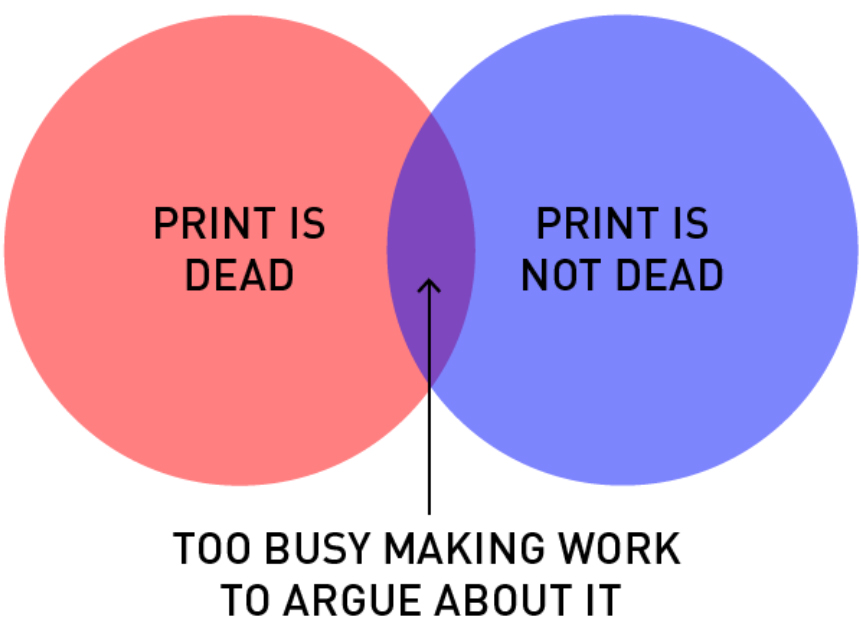
In the popular sector, they’re mainly used for jokes.

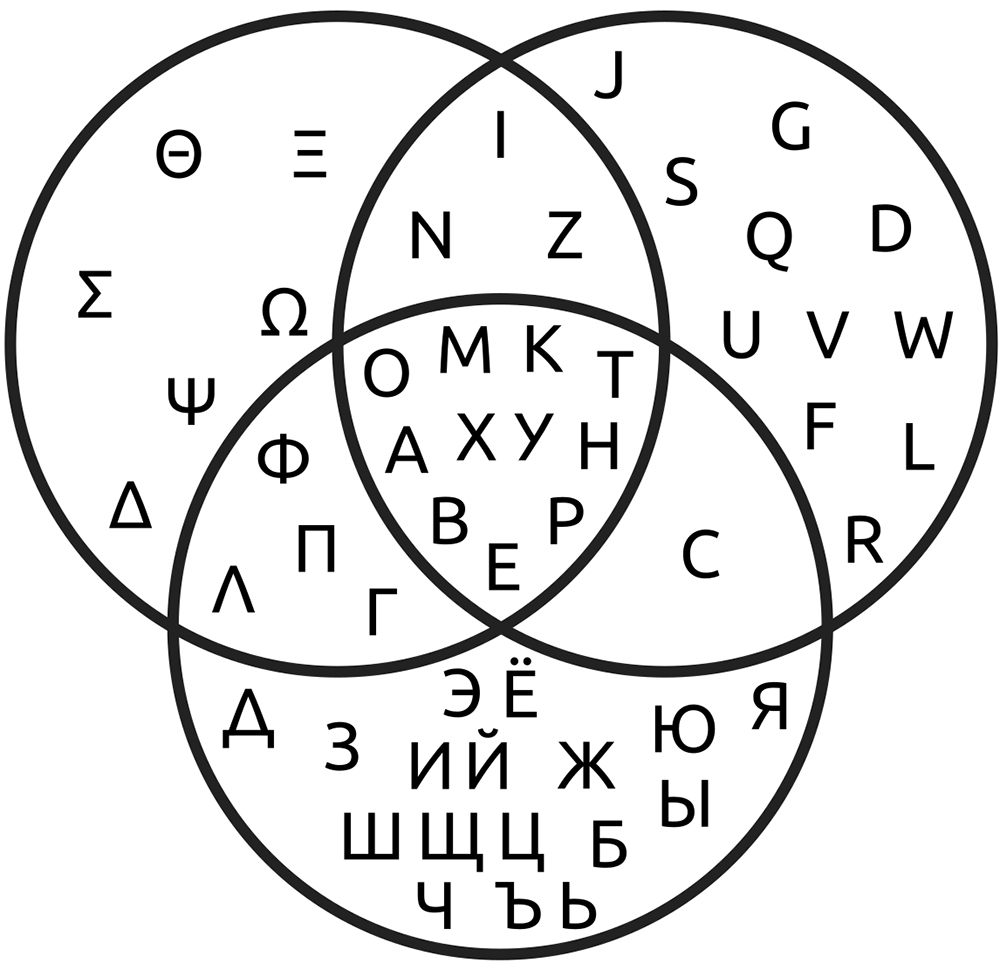
Below, a serious Venn diagram that shows the common uppercase letters of the Greek, Latin and Russian alphabets. (From Wikipedia)

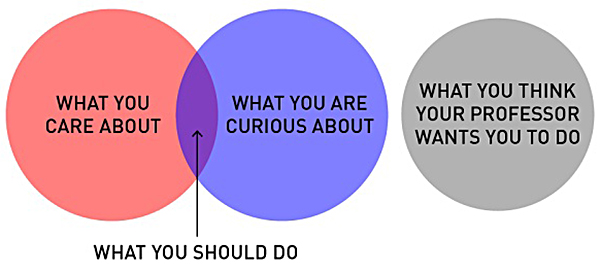
And now back to the jokes…


Mitch Goldstein’s site, “A Helpful Diagram,” highlights the concerns of designers and design students: http://www.ahelpfuldiagram.com

North

WAYFINDING DISPLAYS.

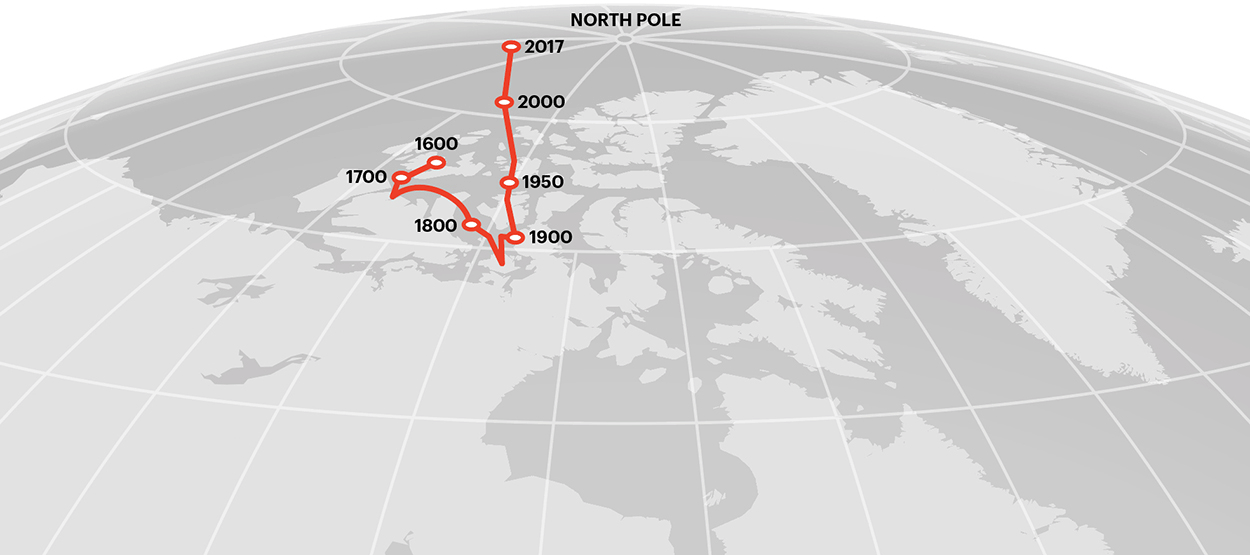
Magnetic north It’s on the move (and so, of course, is magnetic south). Below, a gyrocompass shows navigators the direction of true north.


Photograph © Eugene Sergeev/123rf

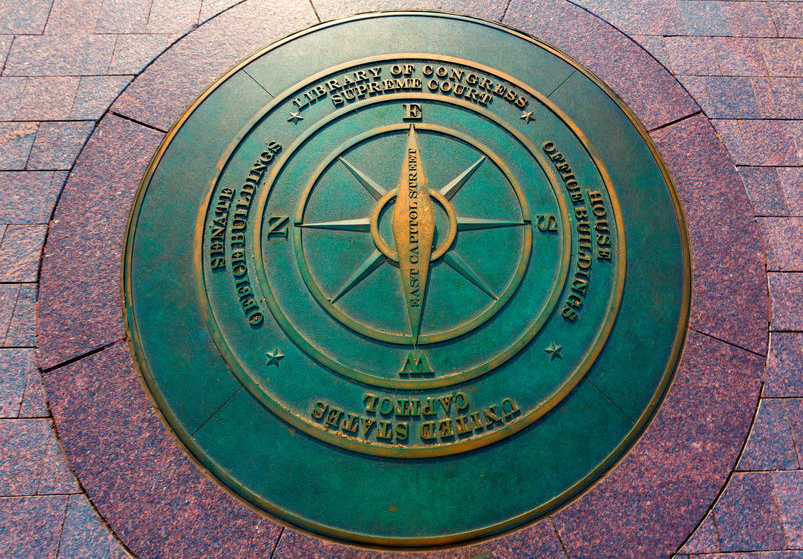
Compass roses Every printed map has one of these.

They’re also often seen set into sidewalks.


Photograph © Antonio Balaguer Soler/123rf

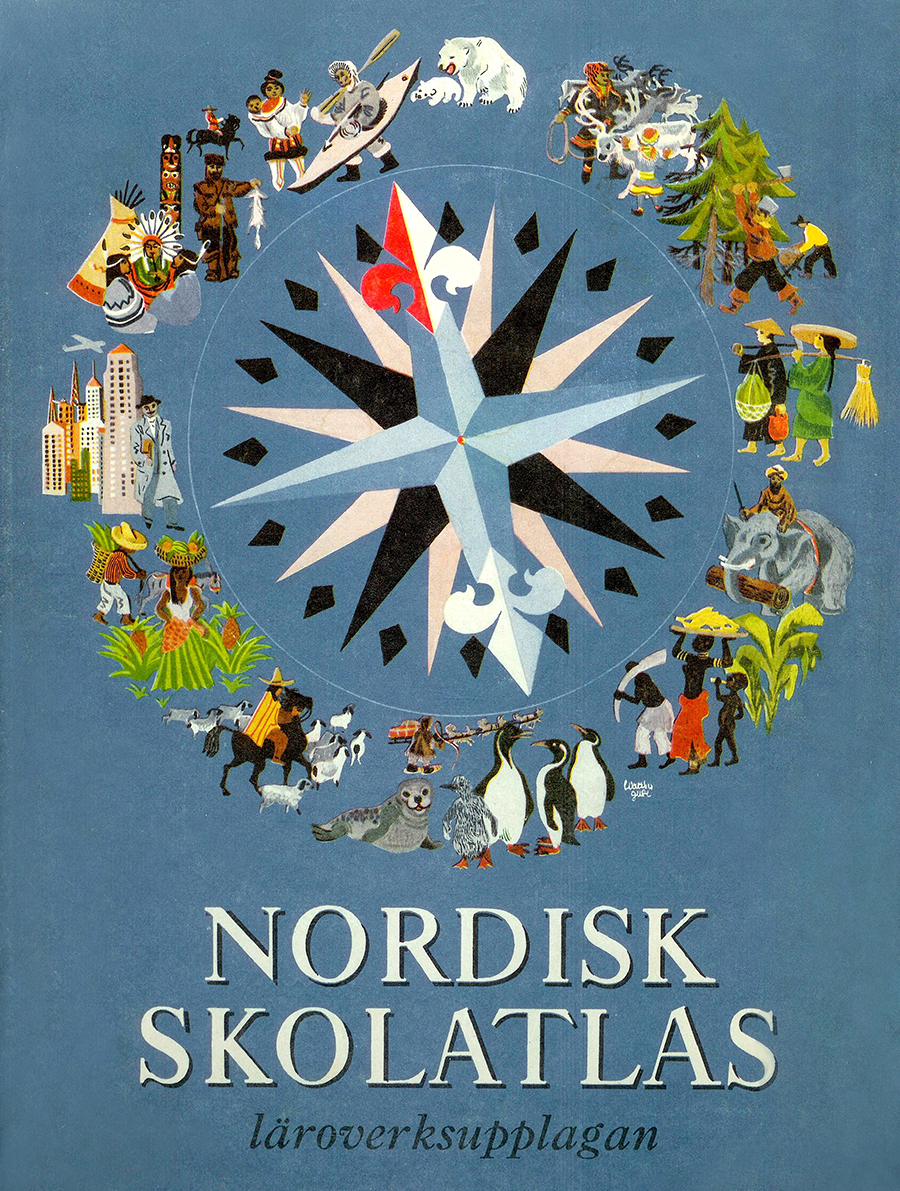
A Swedish atlas from the 1960s puts people and animals at their compass positions.


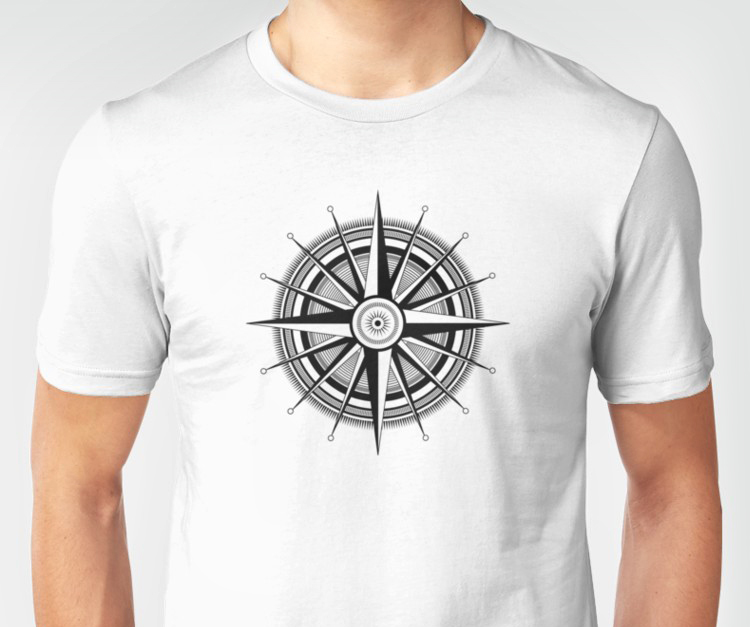
Directional t-shirt
 Redbubble has some attractive compass t-shirts. Dress like a cartographer: goo.gl/VmMkGb


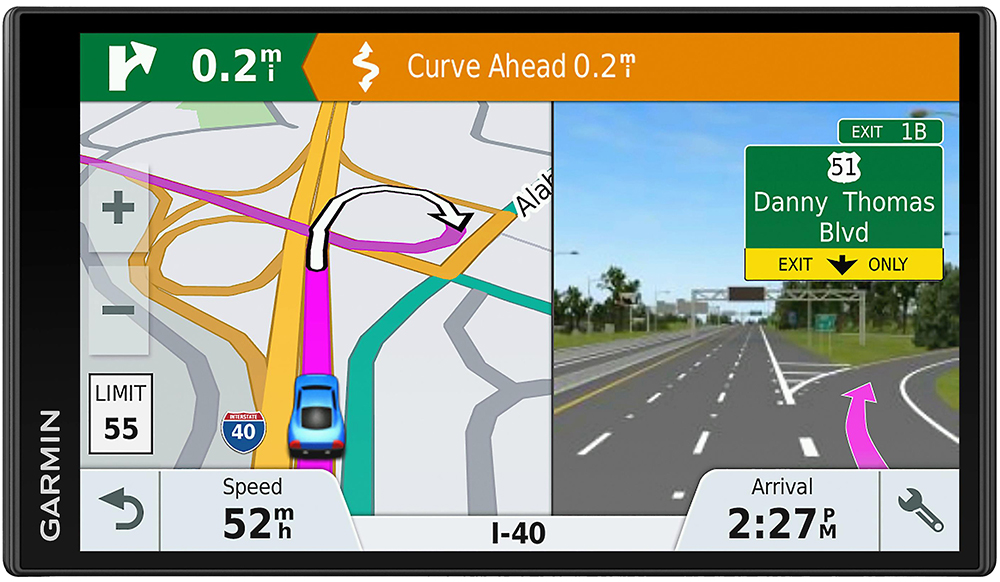
GPS
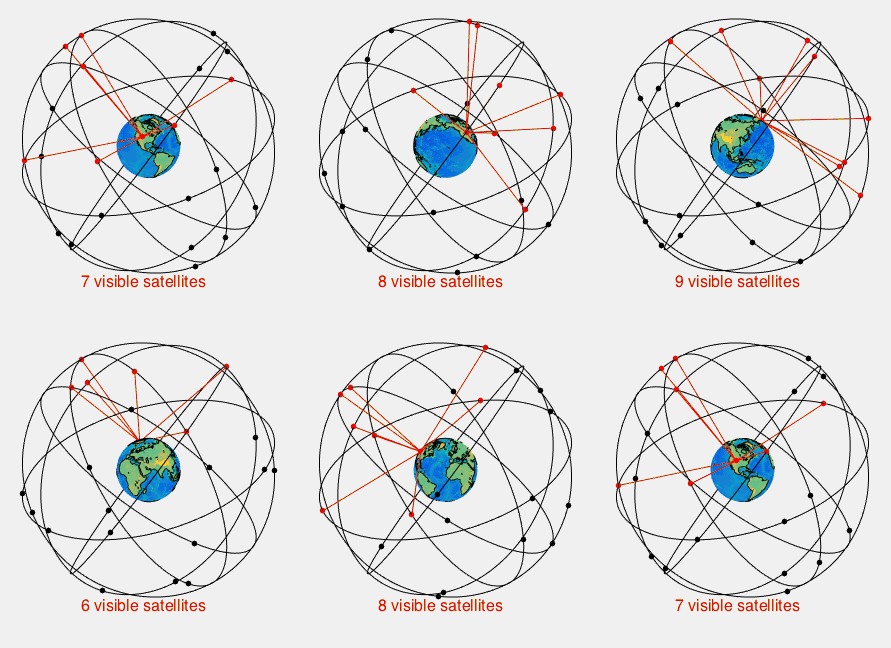
What did we do before we had it? The basis of the Global Positioning System is 24 satellites at an altitude of 12,000 miles (19,300 km), and often supplemented by the Russian GLONASS system for increased accuracy.


Diagram by Paulsava.


In-flight 
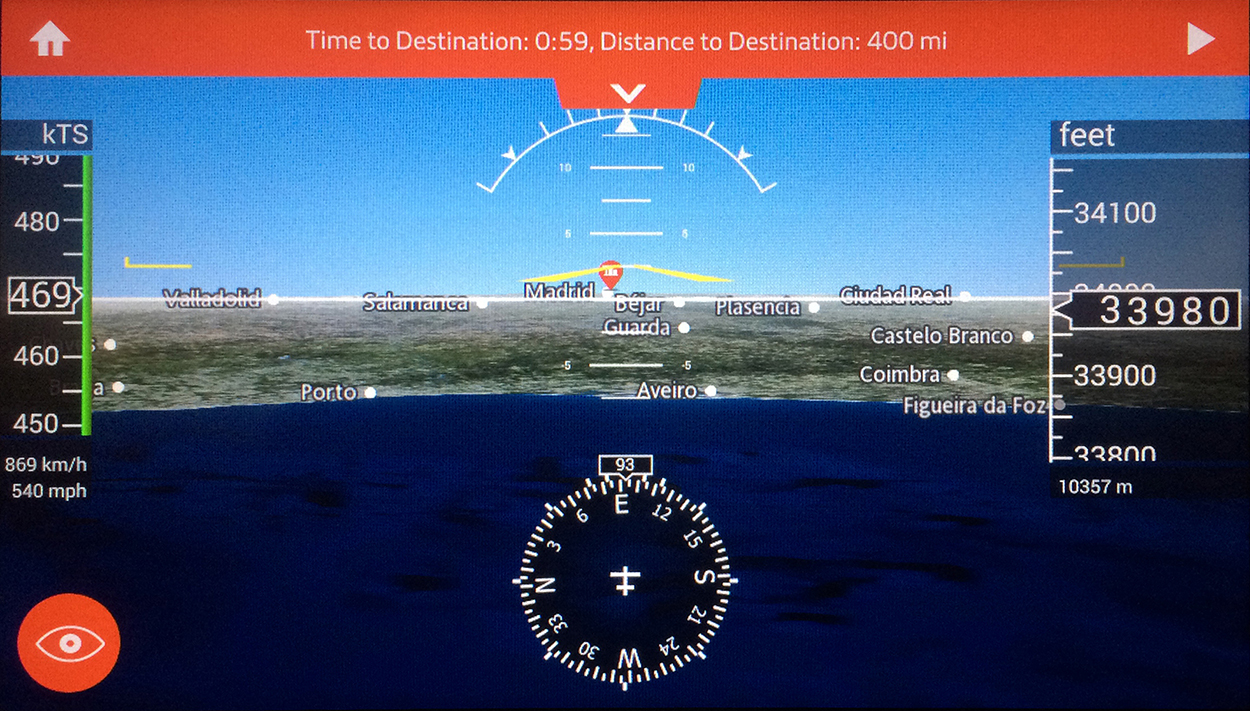
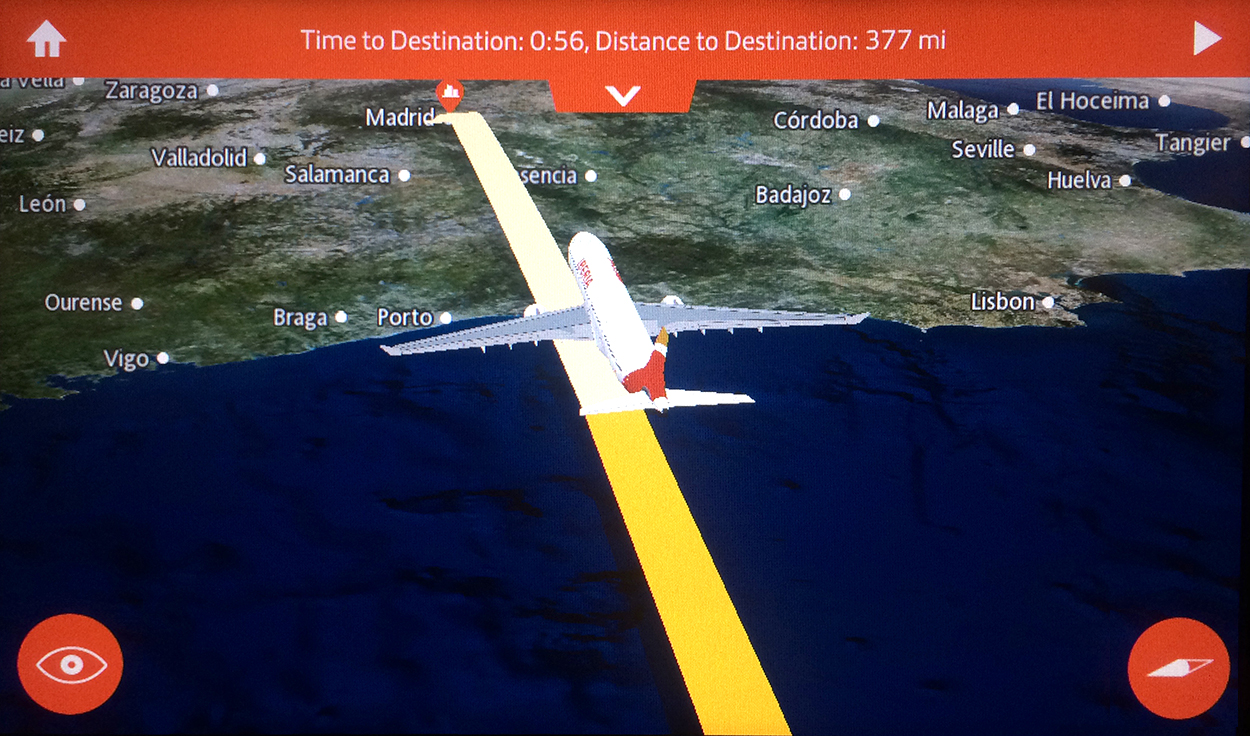
entertainment Airlines feed us all kinds of geographical information. This is from an Iberia Airbus A340, flying the JFK to Madrid route.

Optometric

EYES AND INFOGRAPHICS.

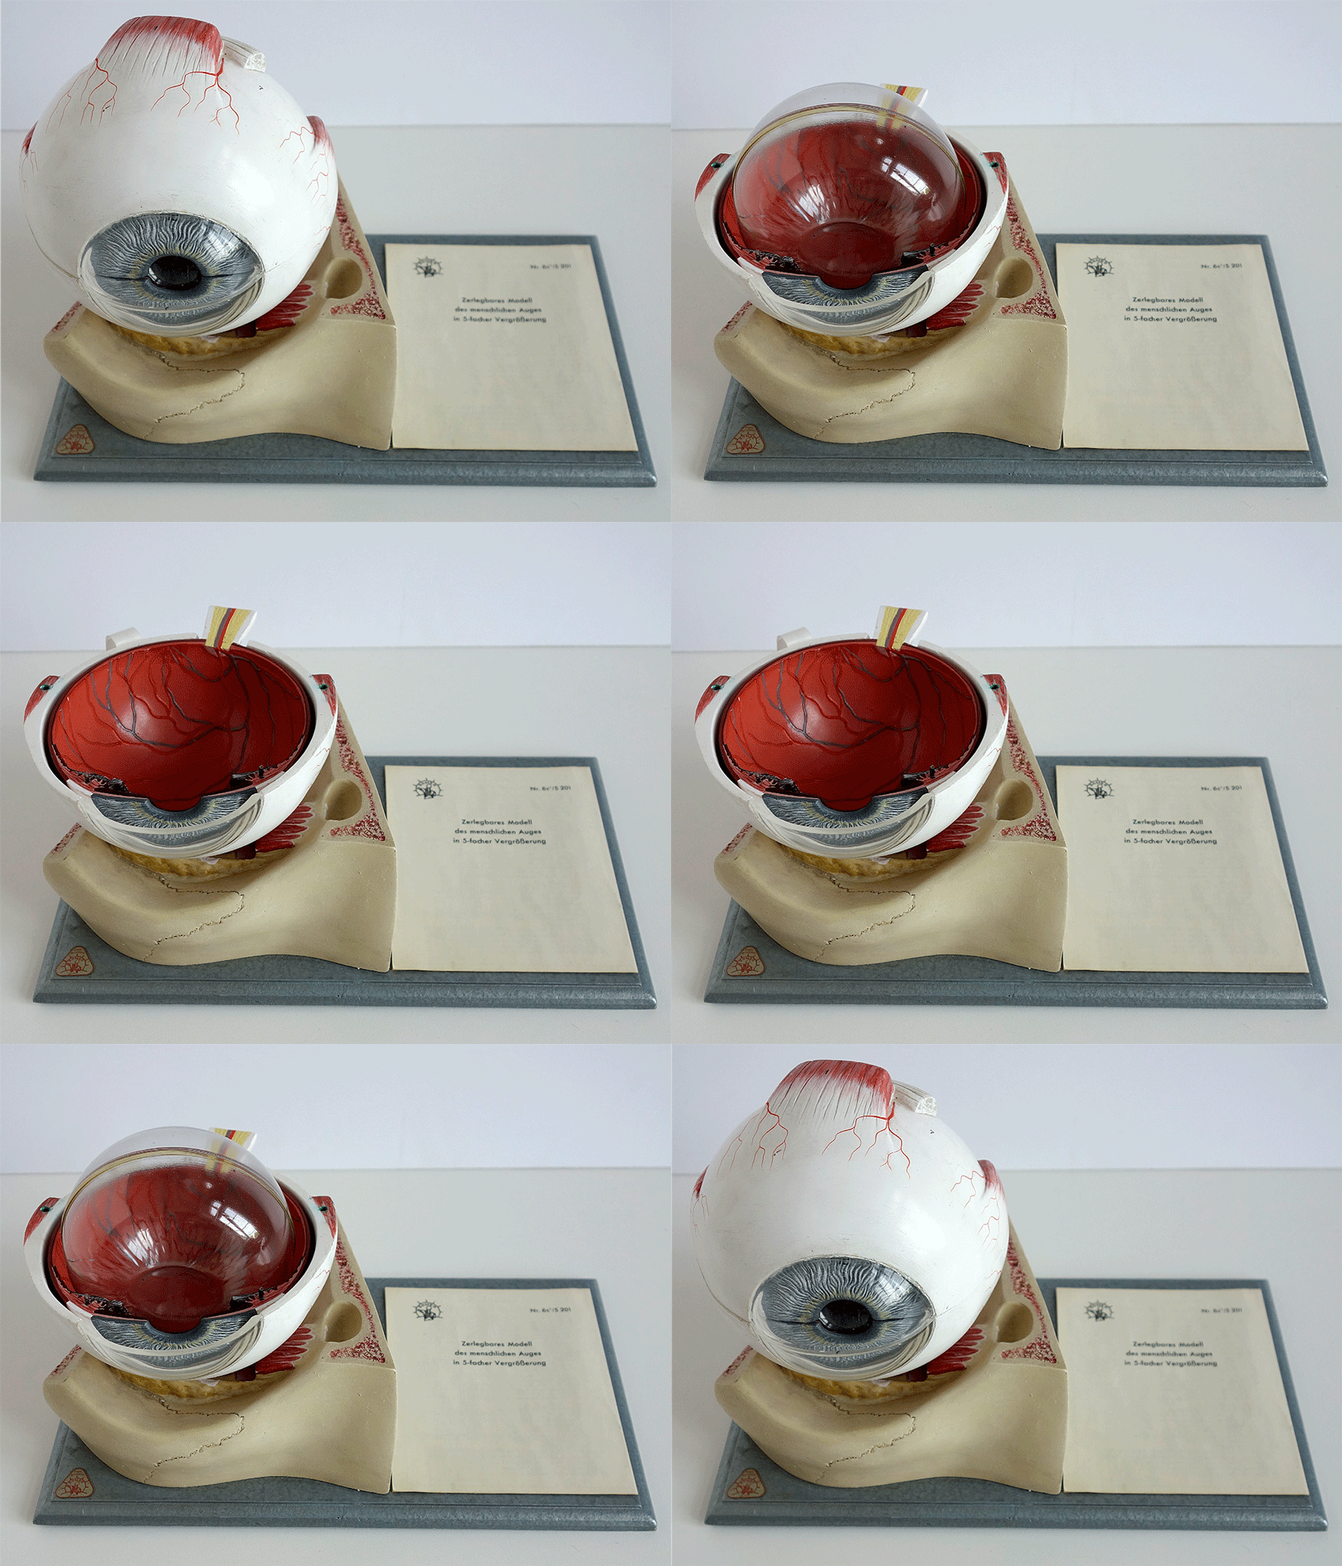
Teaching aid A 1965 model from Michael Stoll’s collection. Made by Somso Models of Sonneberg, Germany. http://www.somso.de/en/somso/

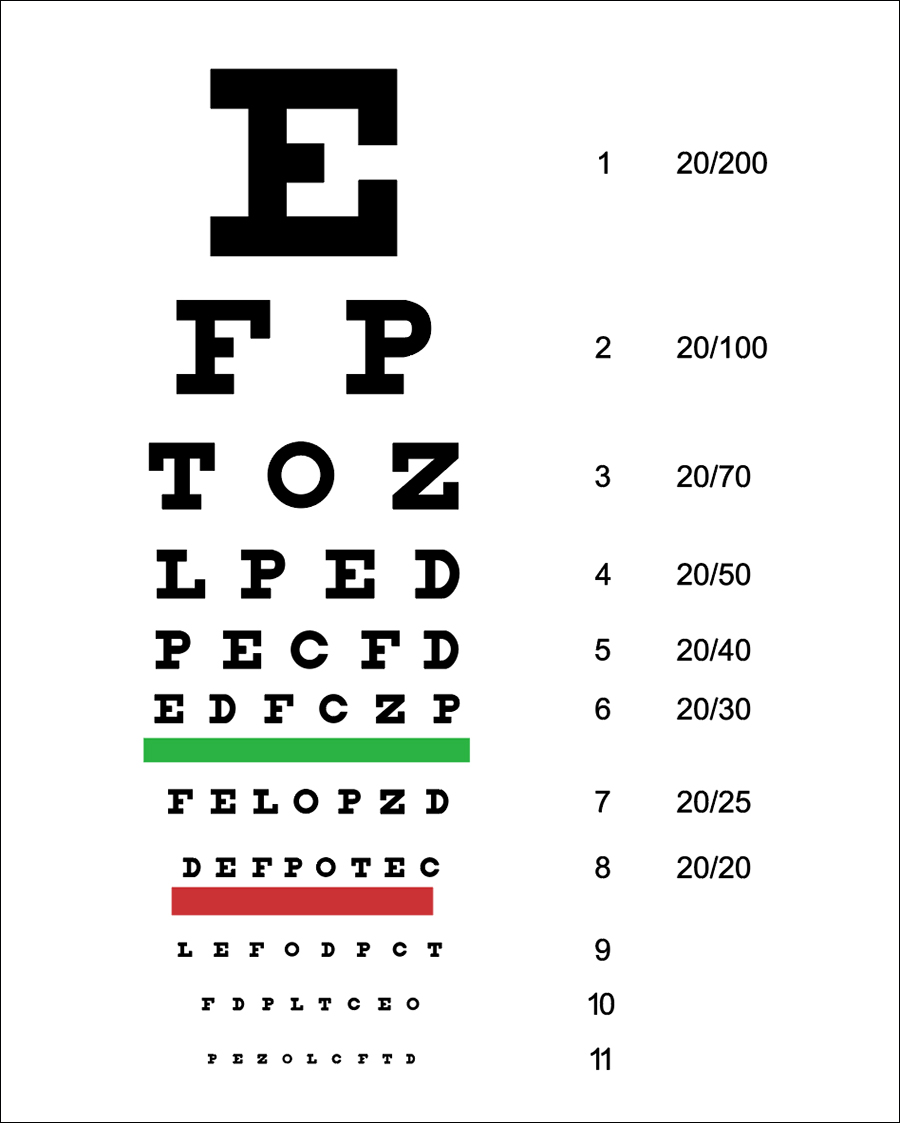
Eye test The Snellen chart (which originated in 1862) is the most common.

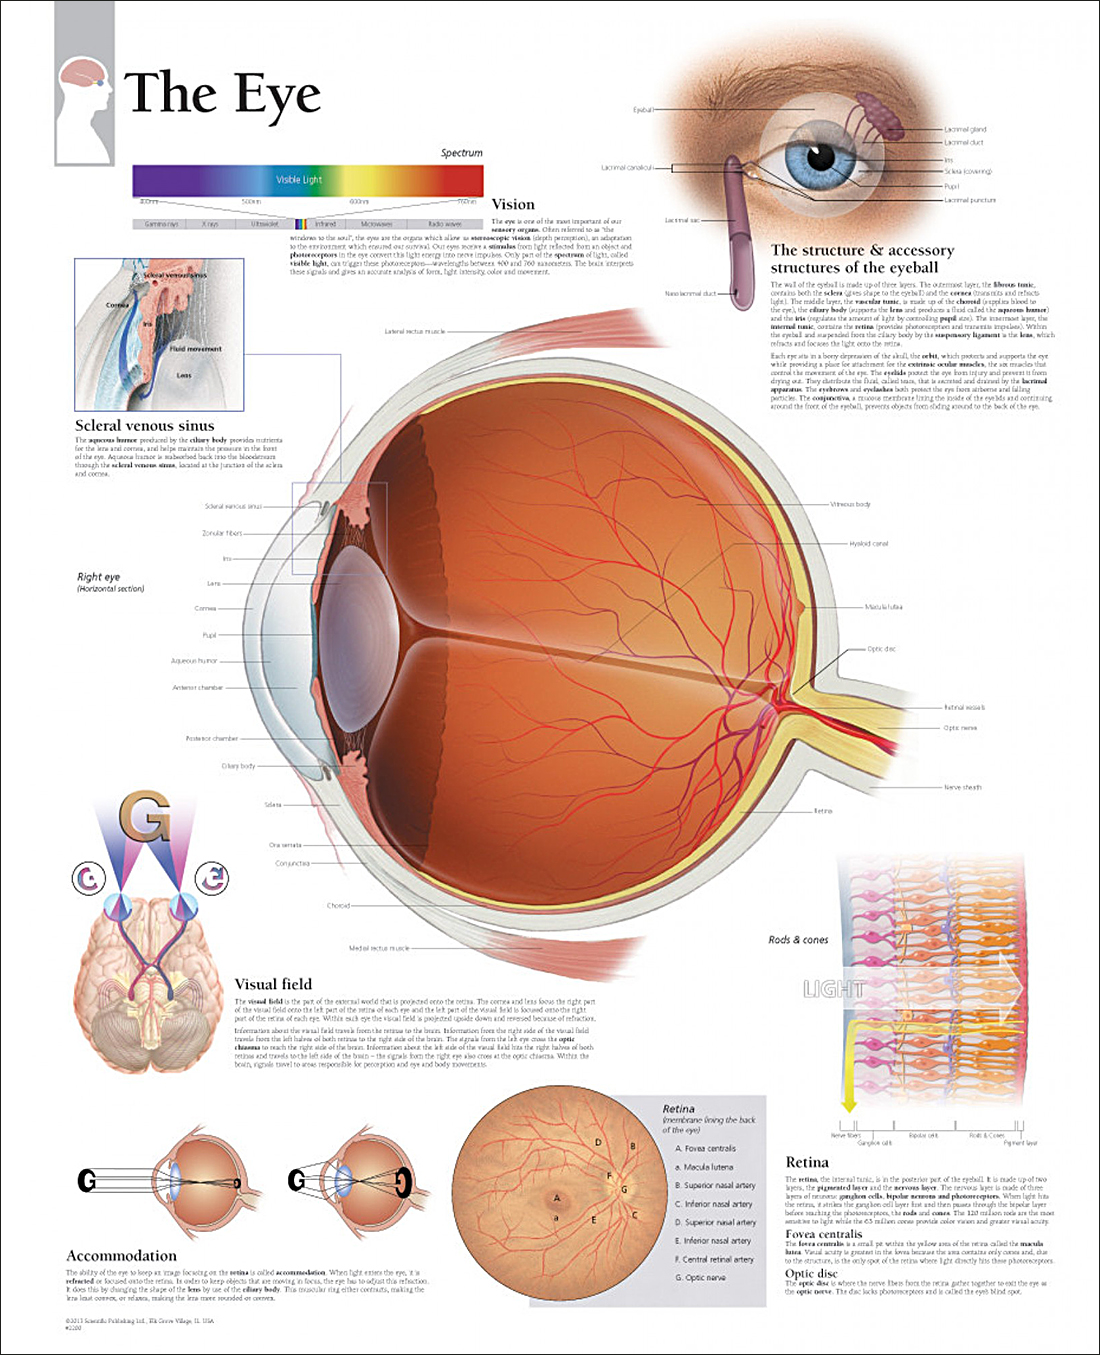
Poster Of course, there are plenty of detailed eye diagrams around. If you want one for the wall: goo.gl/6SjuZz

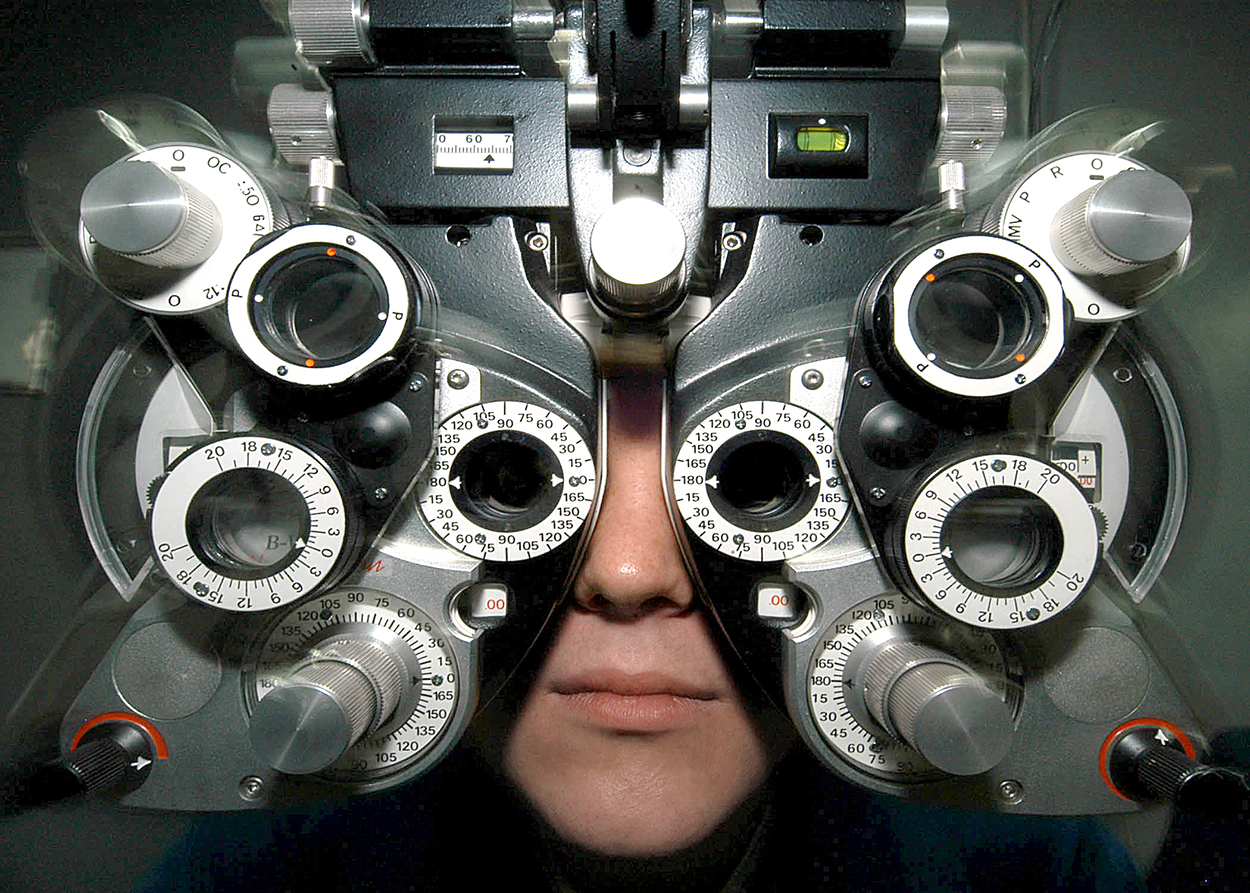
Phoropter Great-looking instrument for precise optical measurements. I don’t care what it does, I just like the dials.


Photograph by Christian Weibull.

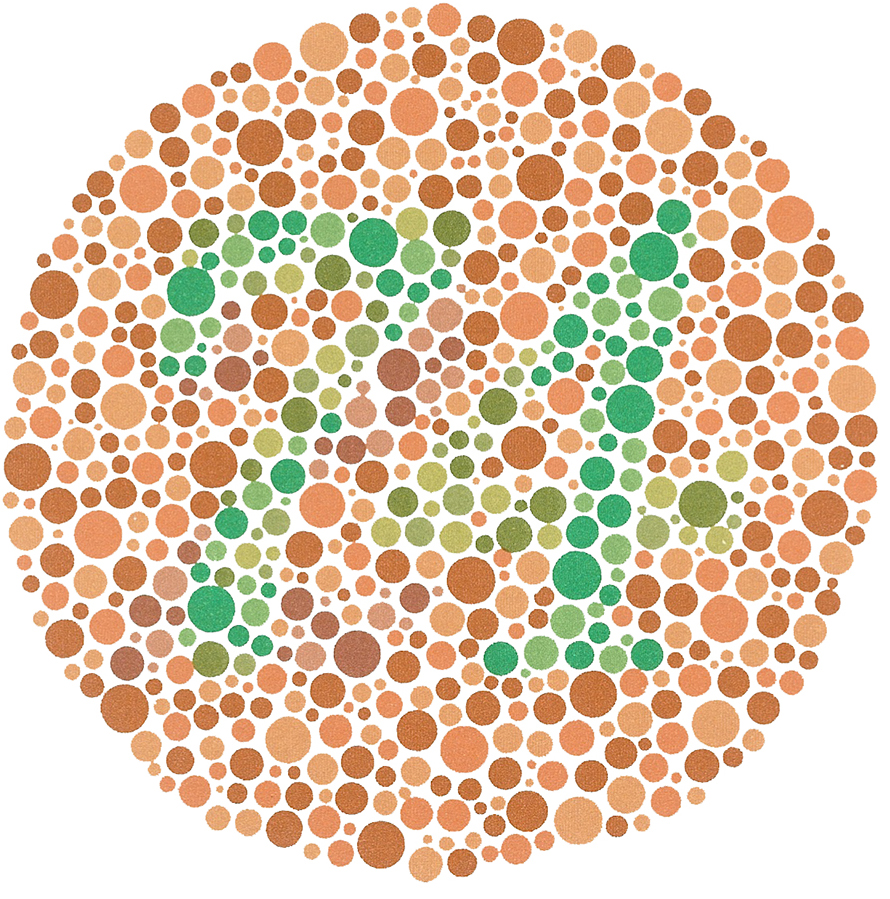
Color vision The Ishihara test can detect red-green vision deficiencies. This is one of the 38 test plates.

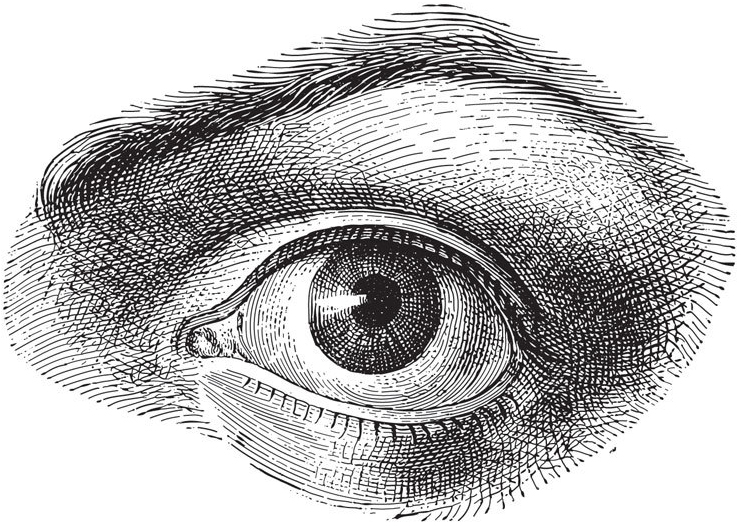
Vintage Illustrations from historical medical books.

Above, from Die Frau als Hausärztin, 1911. Below, from Meyers Konversations-Lexicon, 1897. (Hein Nouwens/shutterstock.com)

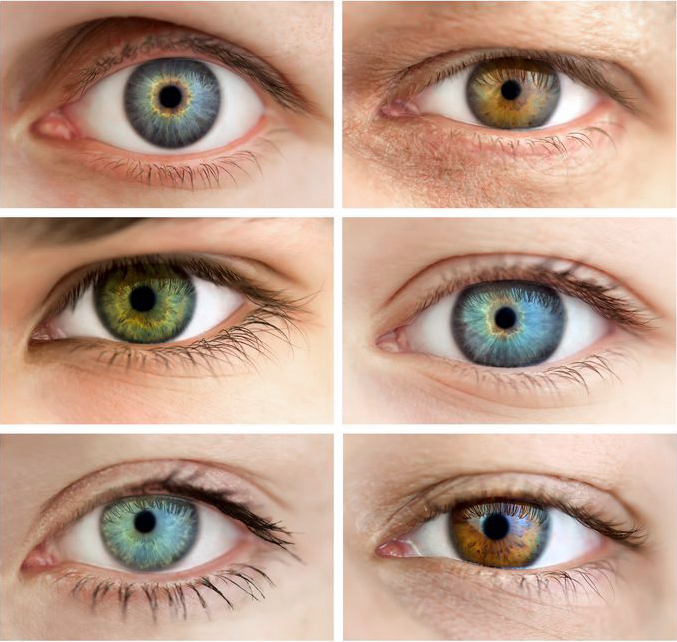
Eye color There are endless variations. Brown is the most common color, according to the American Academy of Ophthalmology.


Photograph © Taiga/123rf

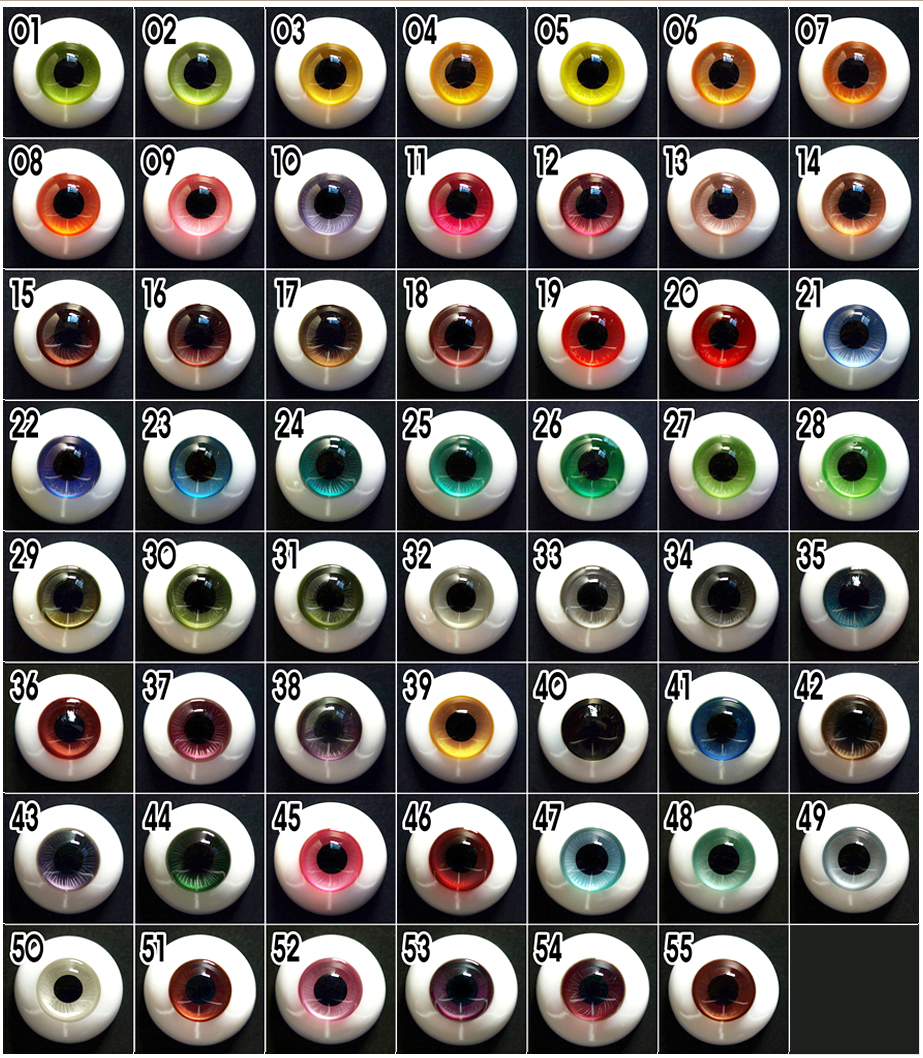
A chart of doll eyes.

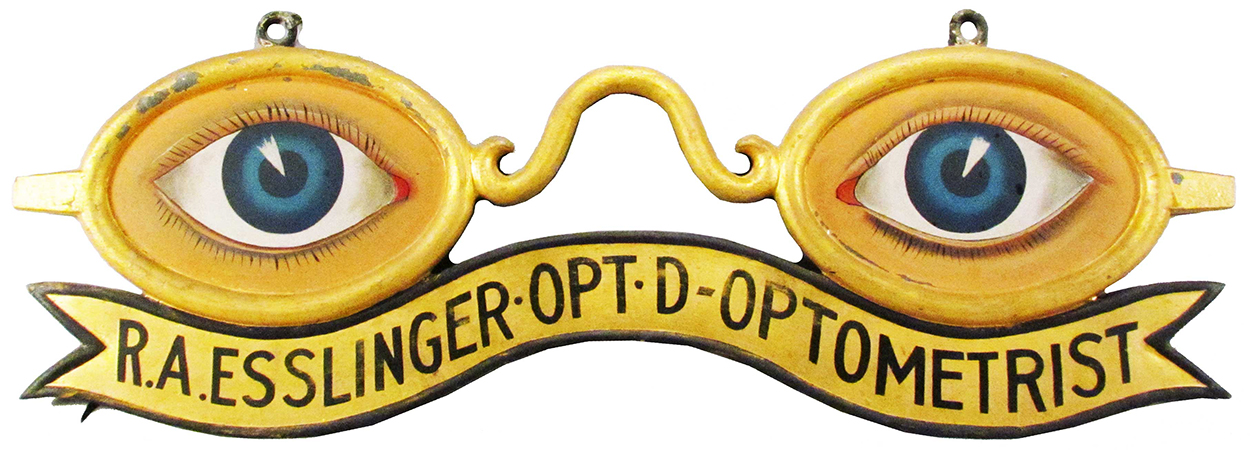
Signage This kind of design was very common years ago.

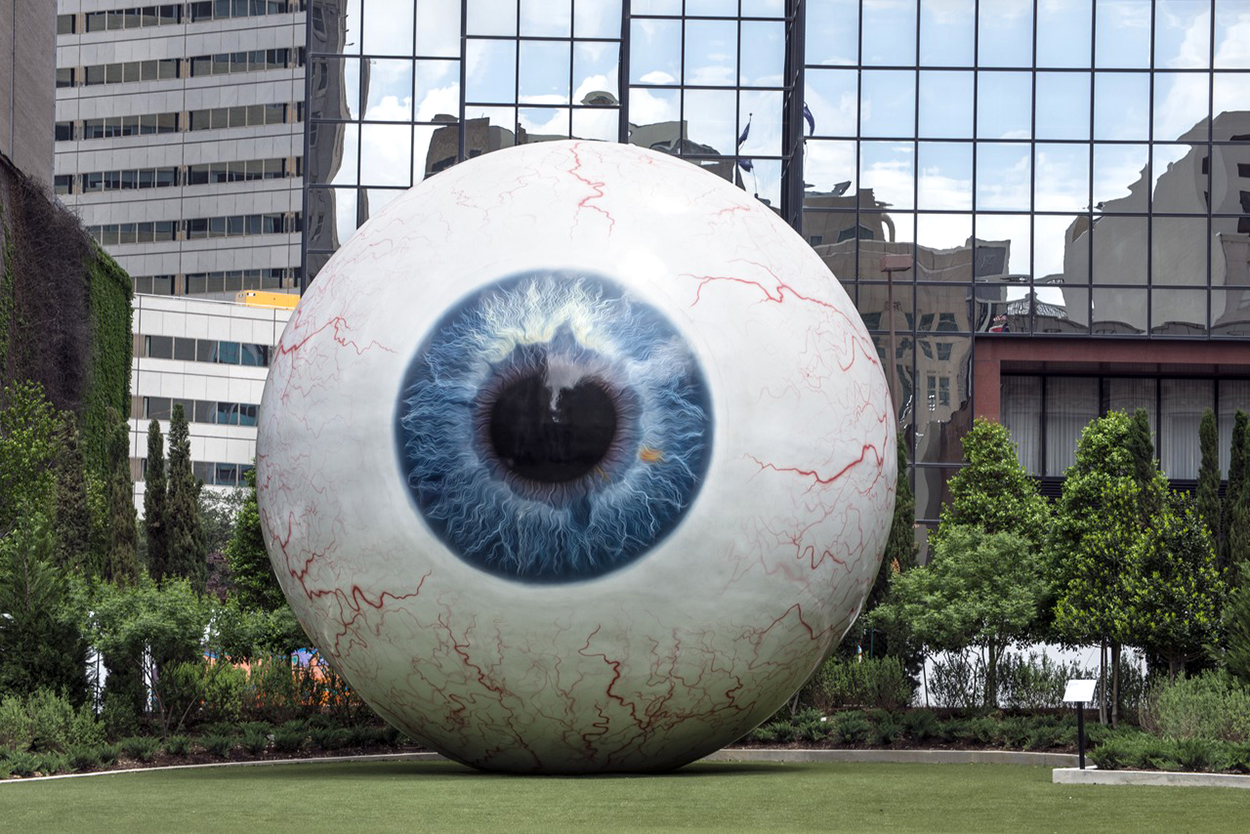
Giant eye Tony Tasset created a 30-foot (9-meter) diameter fiberglass eyeball (modeled on his own eye) in 2007. It’s a well-traveled item. First on display in Chicago’s Pritzer Park, then on the roadside in Sparta, Wisconsin (where it was originally constructed), and now in the Joule Hotel’s sculpture garden in Dallas.


Photograph by Carol M.Highsmith.

Taken apart

DECONSTRUCTING TO EXPLAIN.

Reality Photographed superbly by Adam Voorhes. http://www.voorhes.com

Illustrated instructions Assembly guides and parts diagrams are part of our everyday life. A note of caution: When this kind of thing is not done well, it can cause a nervous breakdown.

In pieces Walking around an exploded view is an experience. This VW Beetle installation, “Cosmic Thing,” is by Damion Ortega.

Blown-up Another gallery piece, “Cold Dark Matter” by Cornelius Parker. A garden shed and it’s contents was exploded (by the British Army), then the pieces were arranged and brightly lit from the inside. A frozen moment in time.

Motion A commercial for Lowe’s where the whole house comes apart. Click on the image to see the video. (It might take a little while to load.)

Cutaway And don’t forget this excellent book (from Gestalten) which has several exploded views. I featured it before: https://www.johngrimwade.com/blog/2016/11/17/cutaway-magic/

On Amazon: goo.gl/837SjK


Illustration by Nick Kaloterakis.