Category: Maps

Mountains

FROM THE HIMALAYAS TO FLORIDA.

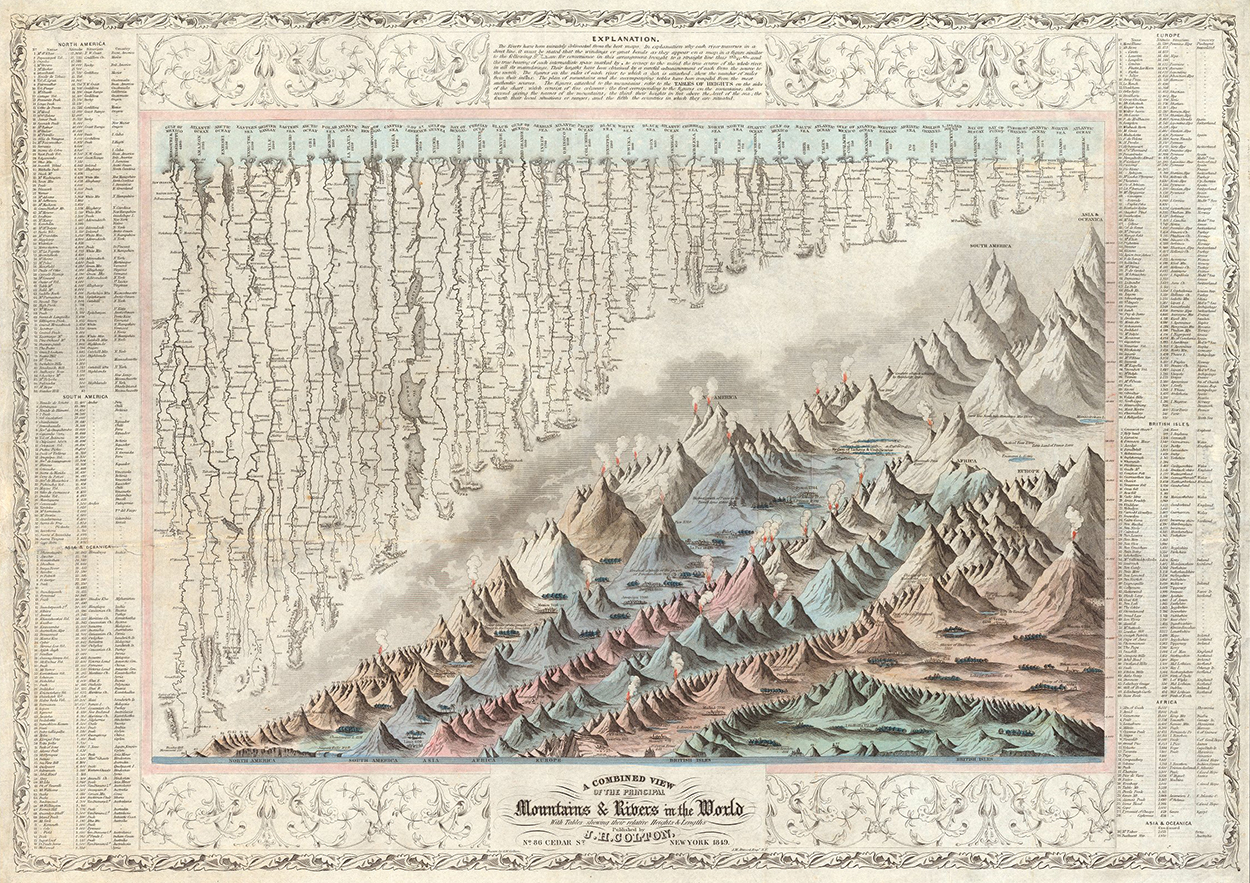
Classic comparison By George Woolworth Colton, 1849. Click on the image for a larger version. (From the David Rumsey Map Collection, where a very high resolution image can be downloaded: goo.gl/pTMC4O)

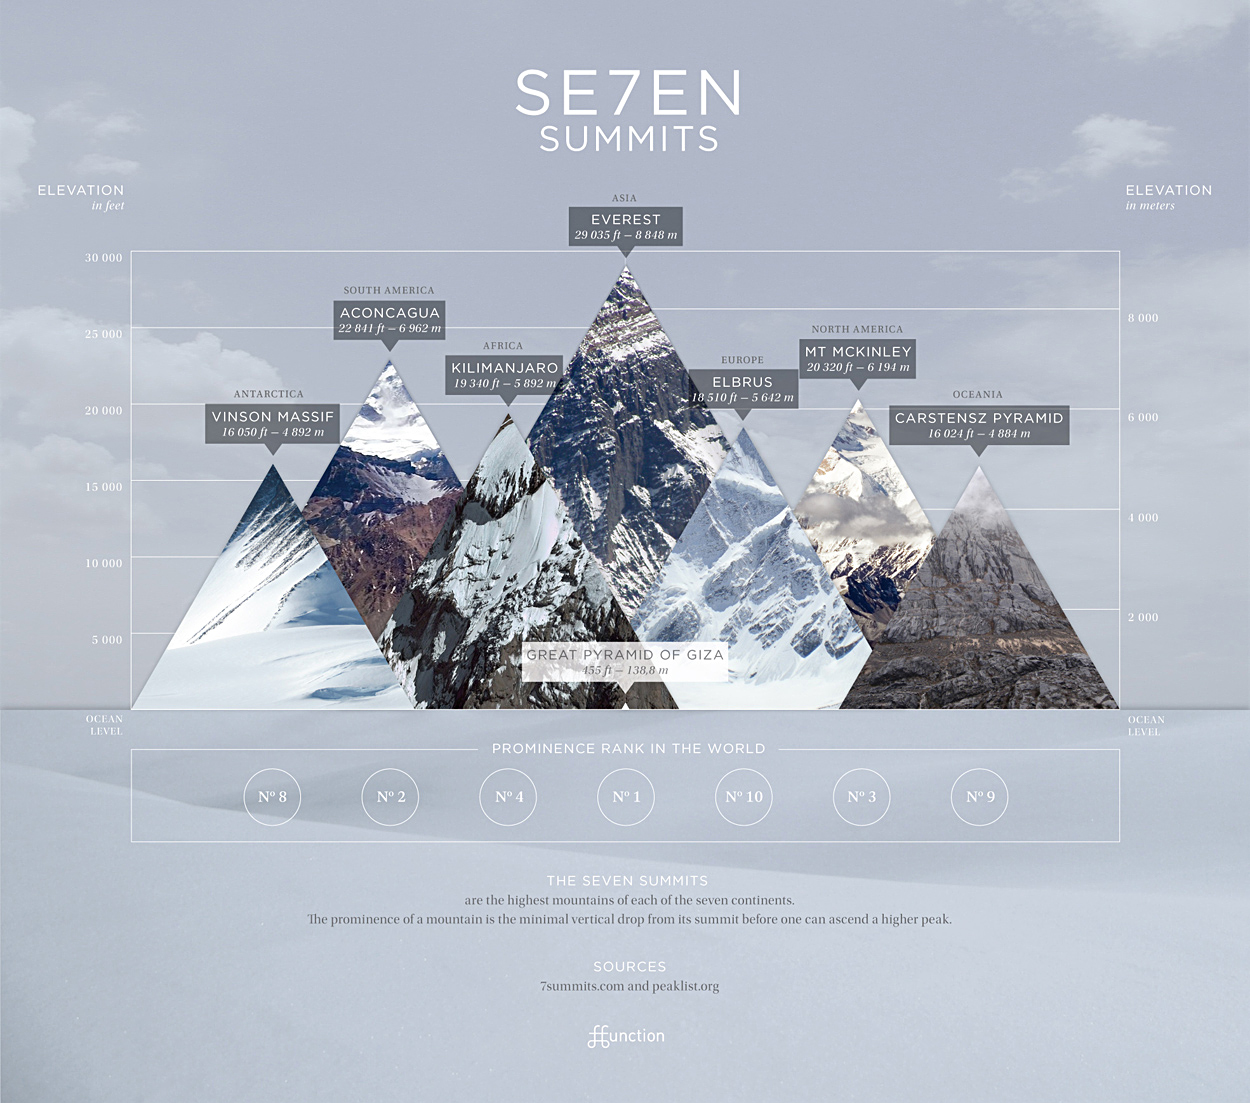
Seven summits The tallest peak in each continent, by Audree Lapierre of FFunction.
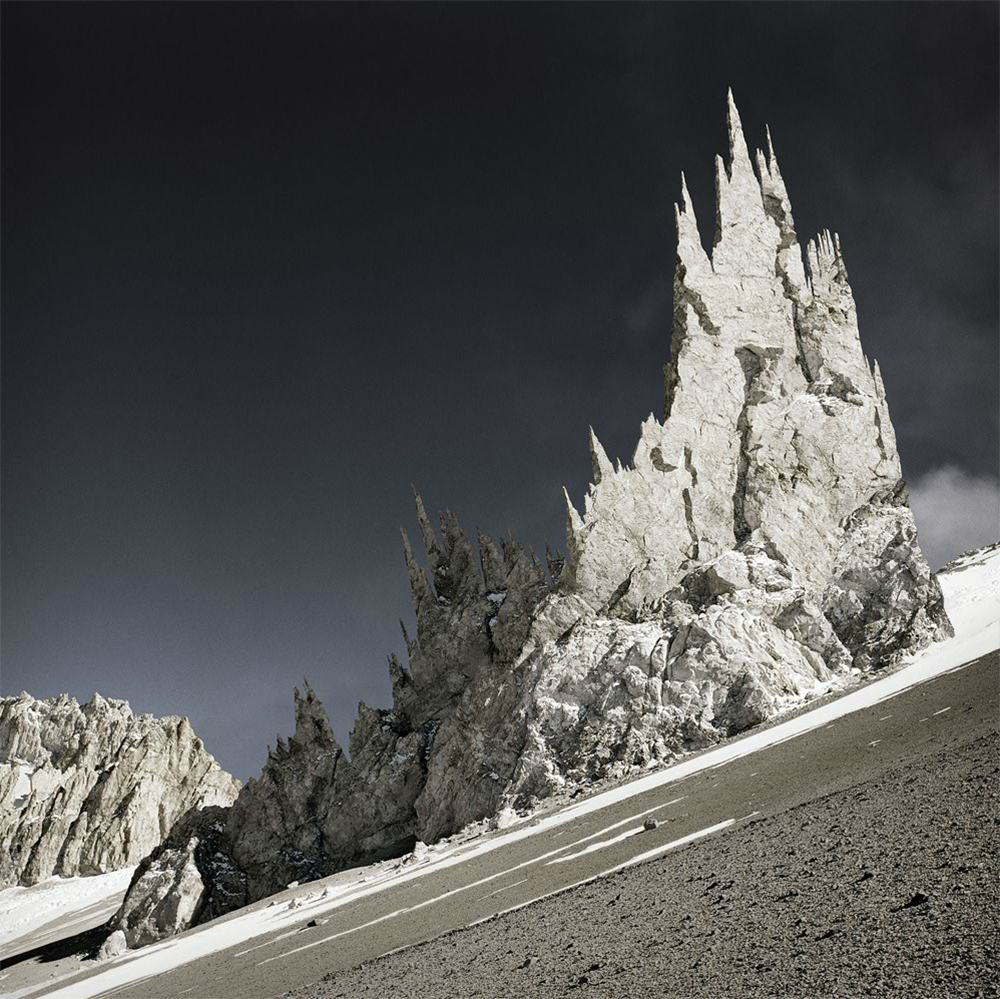
Mountain charts The peaks and valleys leading up to, and immediately following, the 2008 financial collapse, by Michael Najjar. Real data plots converted into mountainous landscapes. Below, Lehman Brothers share price, 1992–2008.
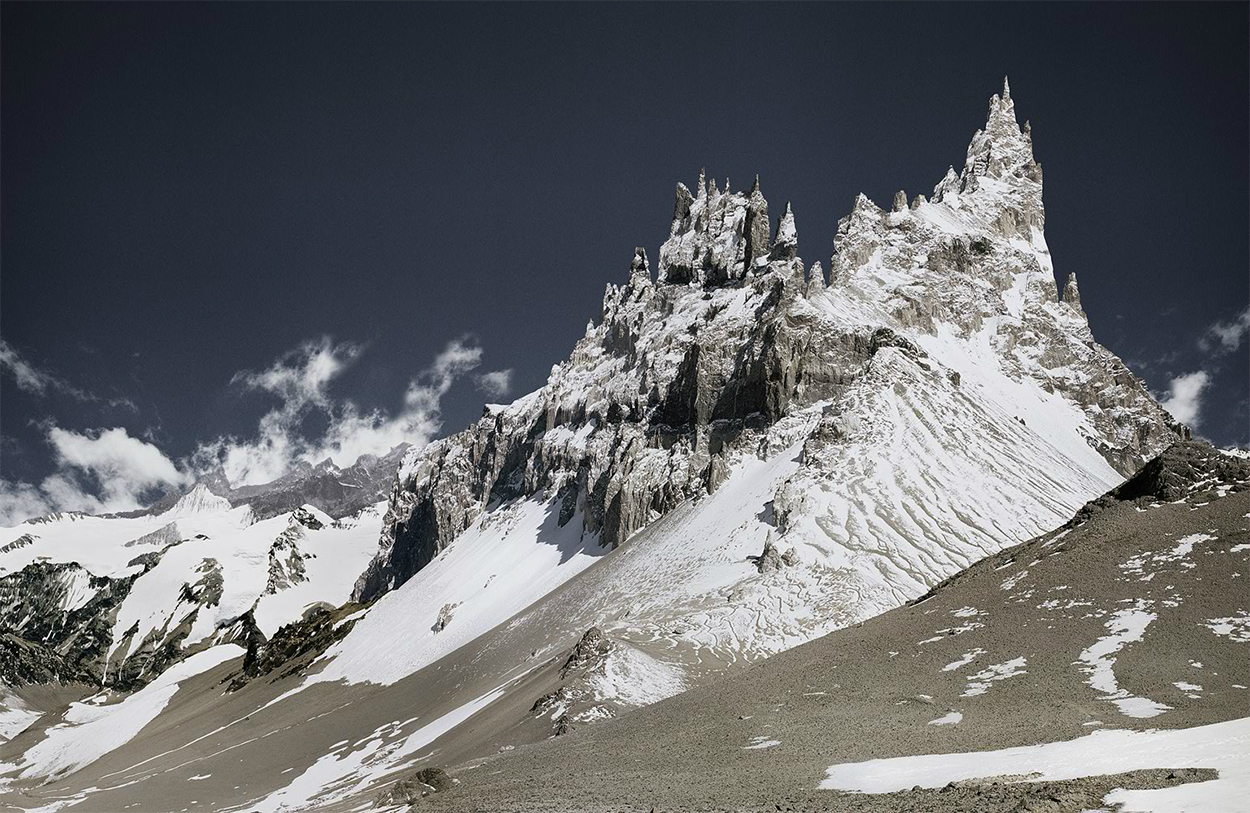
Mountain charts The peaks and valleys leading up to the 2008 financial collapse, by Michael Najjar. Real data plots made into mountainous landscapes. Above, Lehman Brothers share price, 1992–2008.

Dow Jones Industrial Average, 1980–2009.
Nasdaq Composite, 1980–2009.
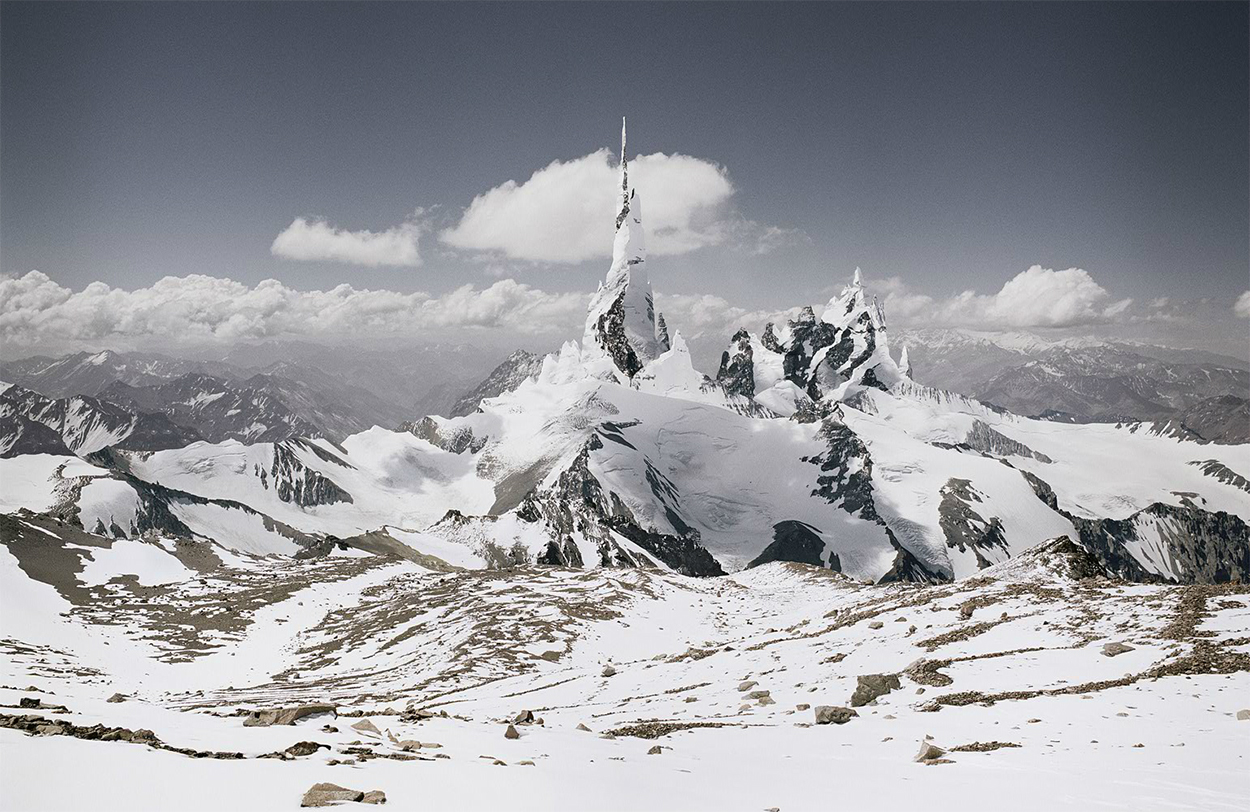
Skiing Alpine ski maps are not an exact depiction of a particular area. The view is altered, so although it looks similar to reality, the individual ski trails are clear.
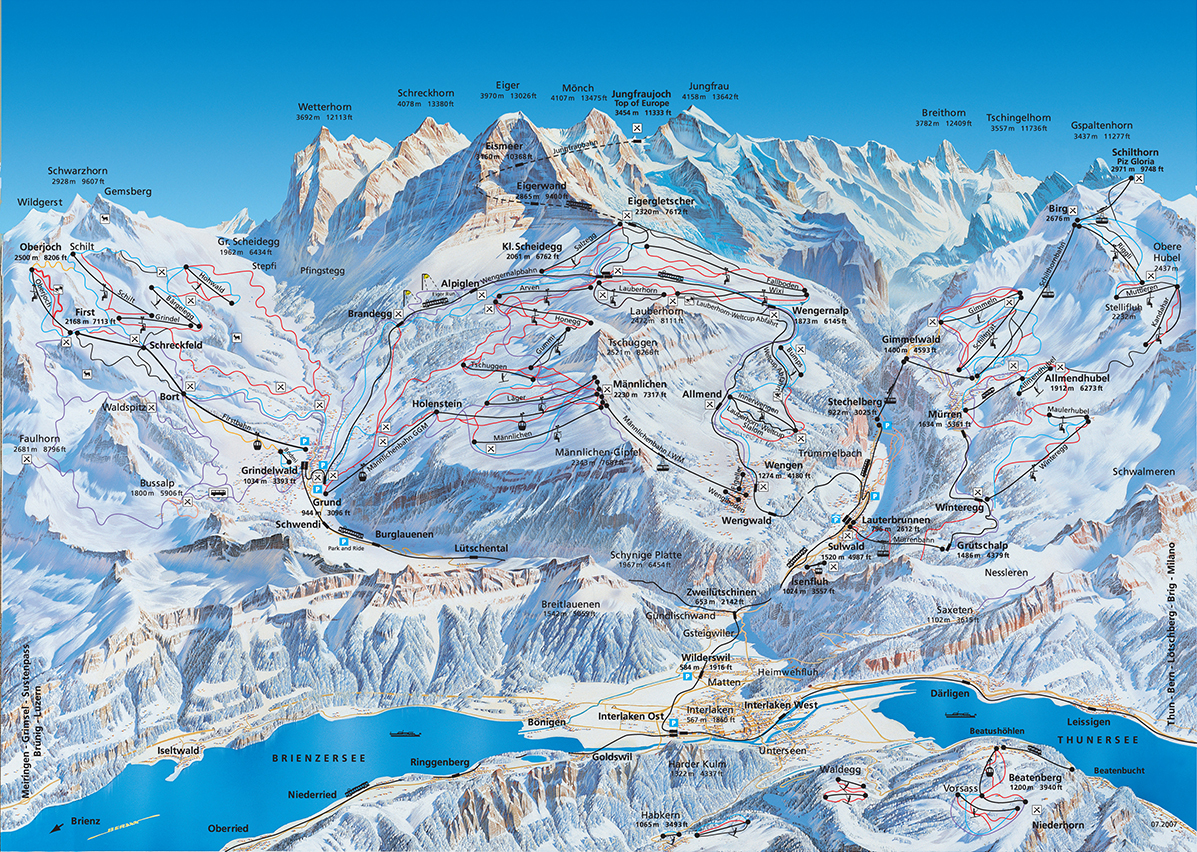
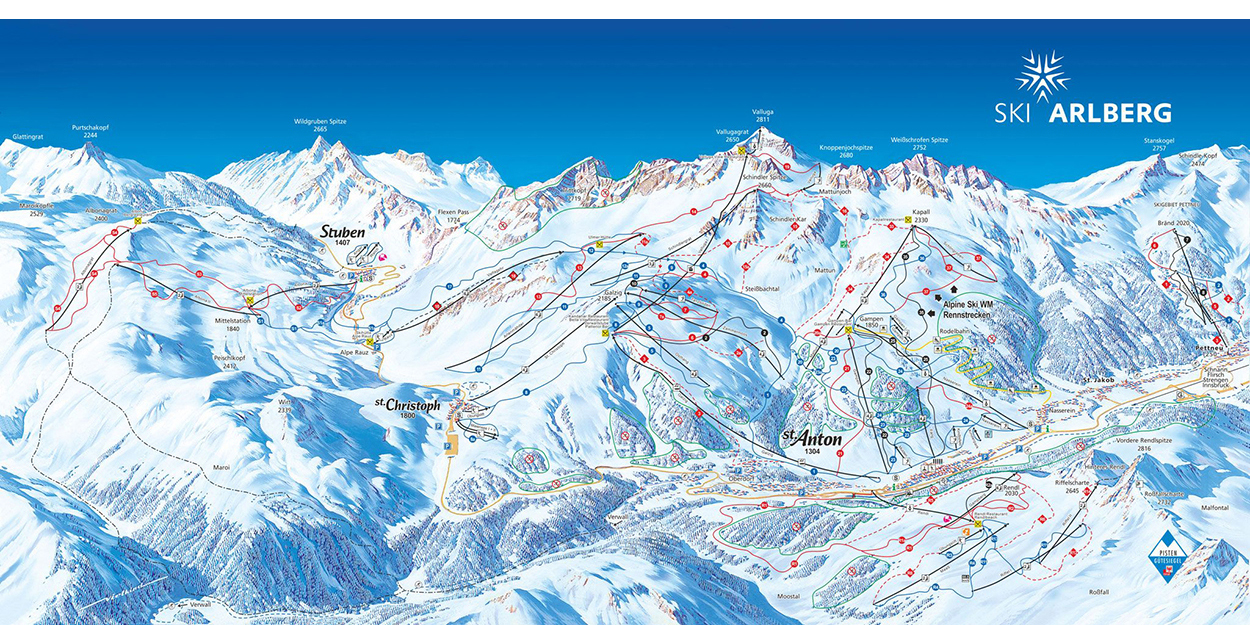
James Niehues has made maps of many U.S. ski resorts. They’re all hand-crafted with paintbrush and airbrush.
http://www.jamesniehues.com
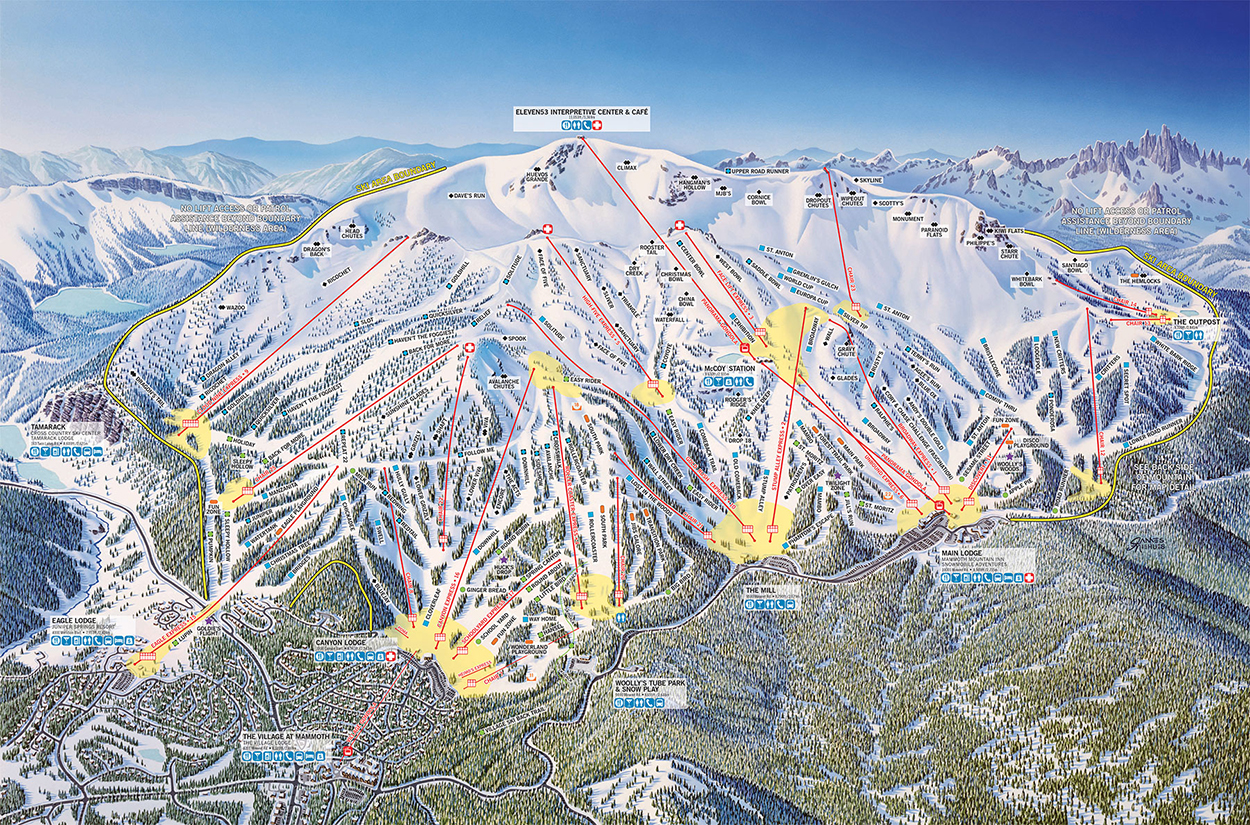
Below is an example of his work. Mammoth Mountain Ski Area (California), shown without labels.
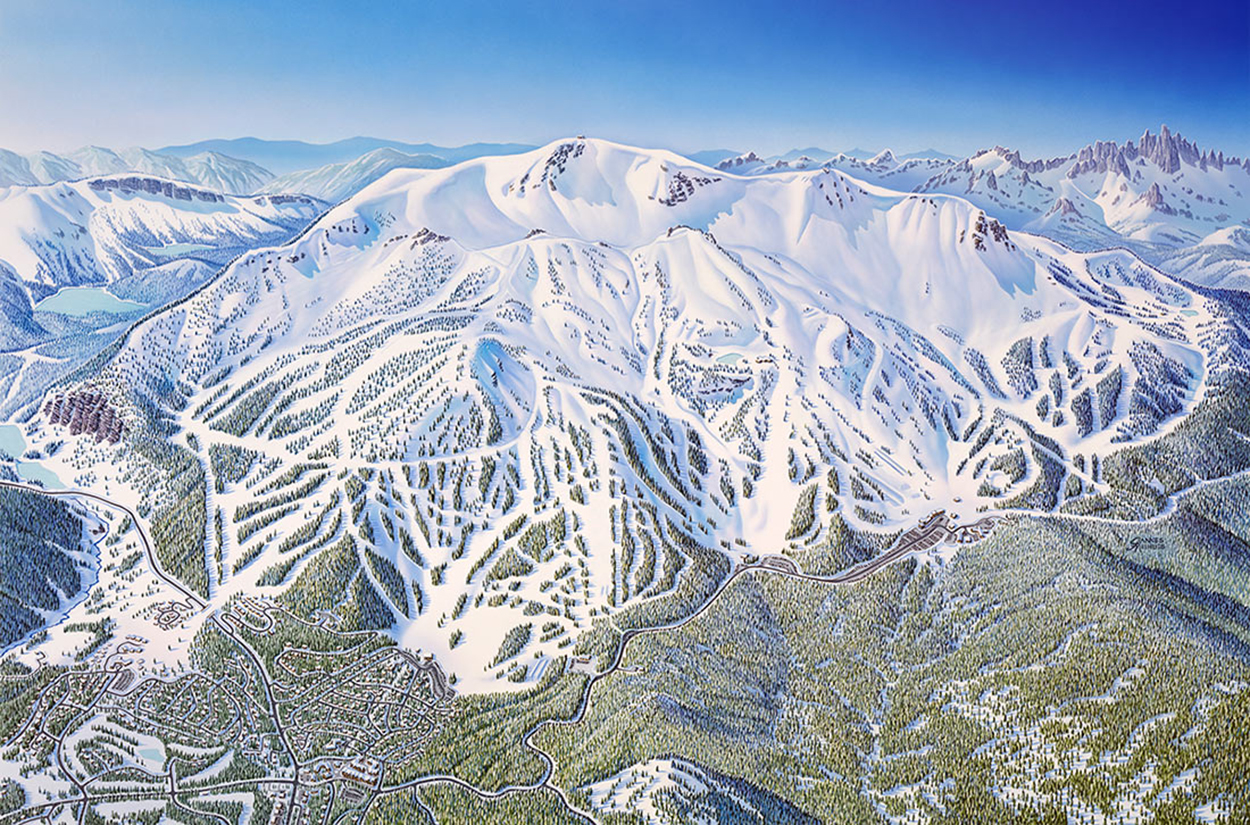
And with skiing information added.
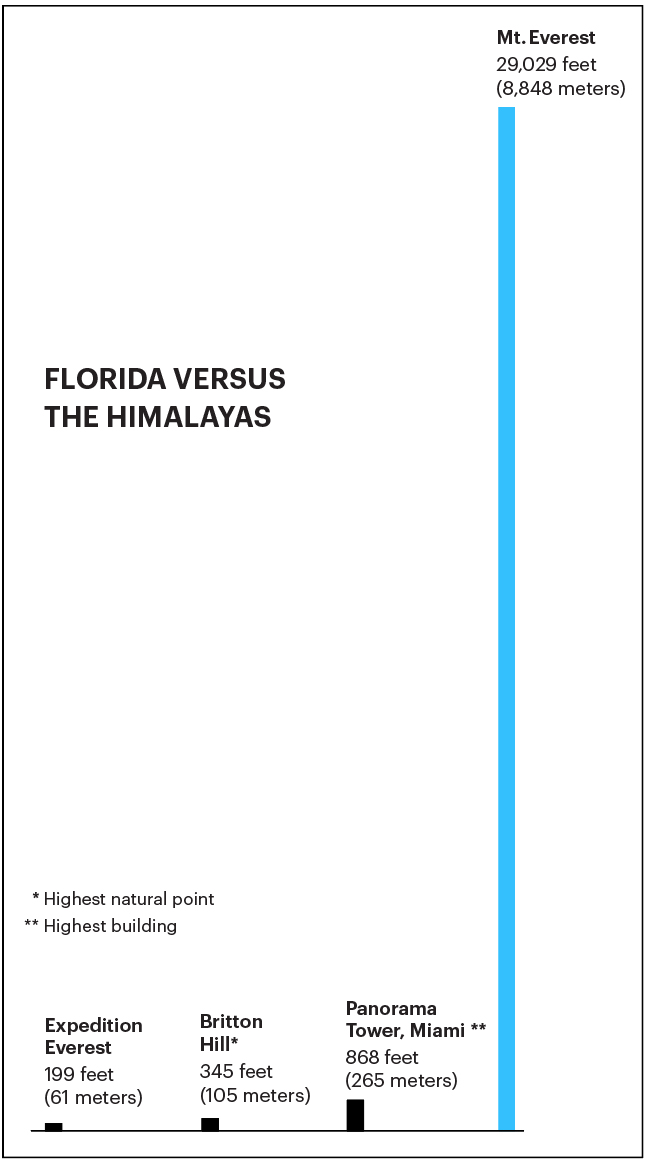
Florida I stayed at a hotel in Orlando, and from the window of my room on the 20th floor, I could clearly see a snow-capped peak rising above the subtropical greenery. It was Everest Expedition at Disney World. It’s only 199 feet high, but Florida is very flat. The real Mt. Everest reaches 29,029 ft (8,848 meters). Apart from the height, another big difference is that the Everest in the Himalayas does not have a roller coaster ride inside it. The Disney World website states: “Careen through the Himalayan mountains on a speeding train while avoiding the clutches of the mythic Abominable Snowman.”
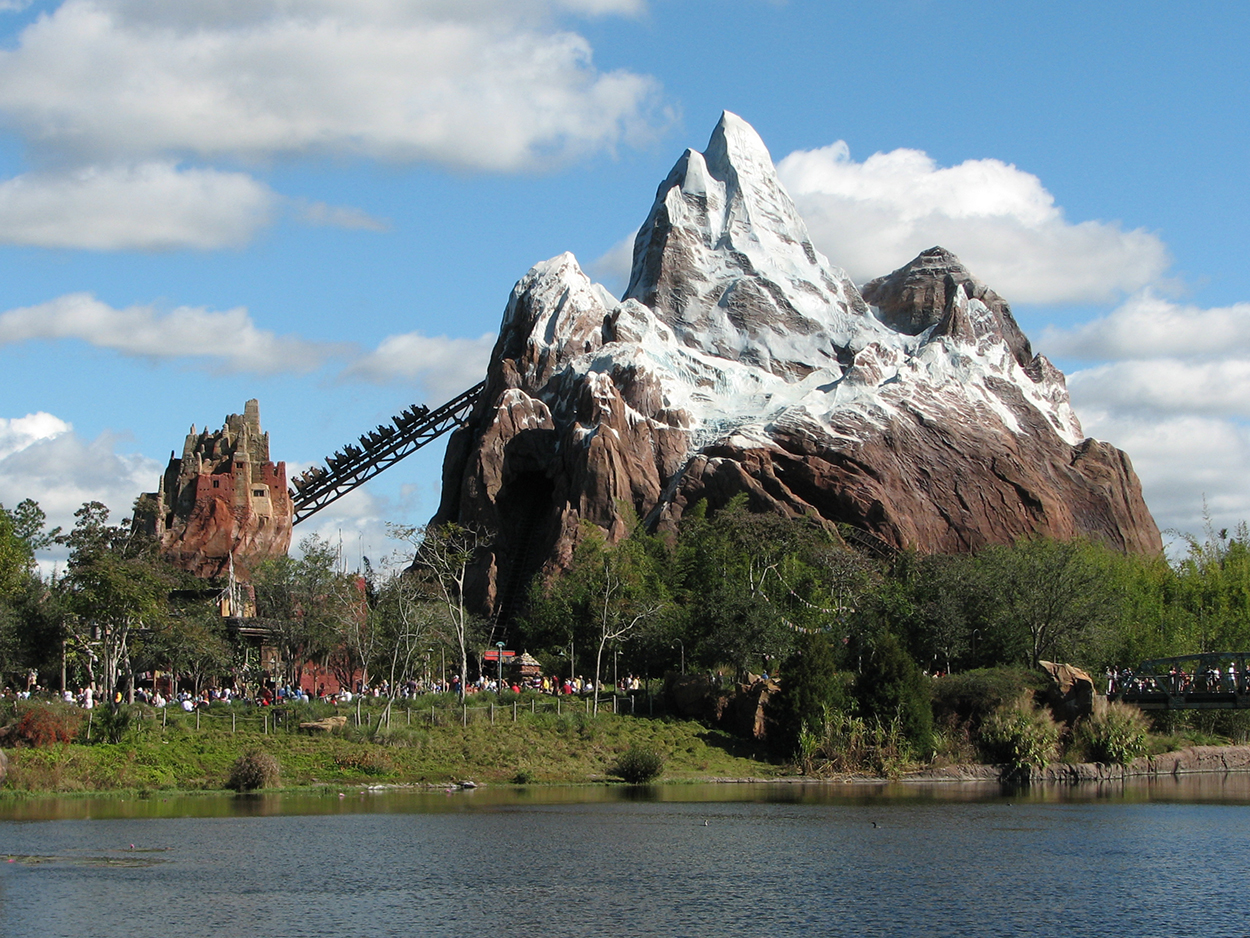
Above, Expedition Everest. (Photograph by Benjamin D.Esham.)
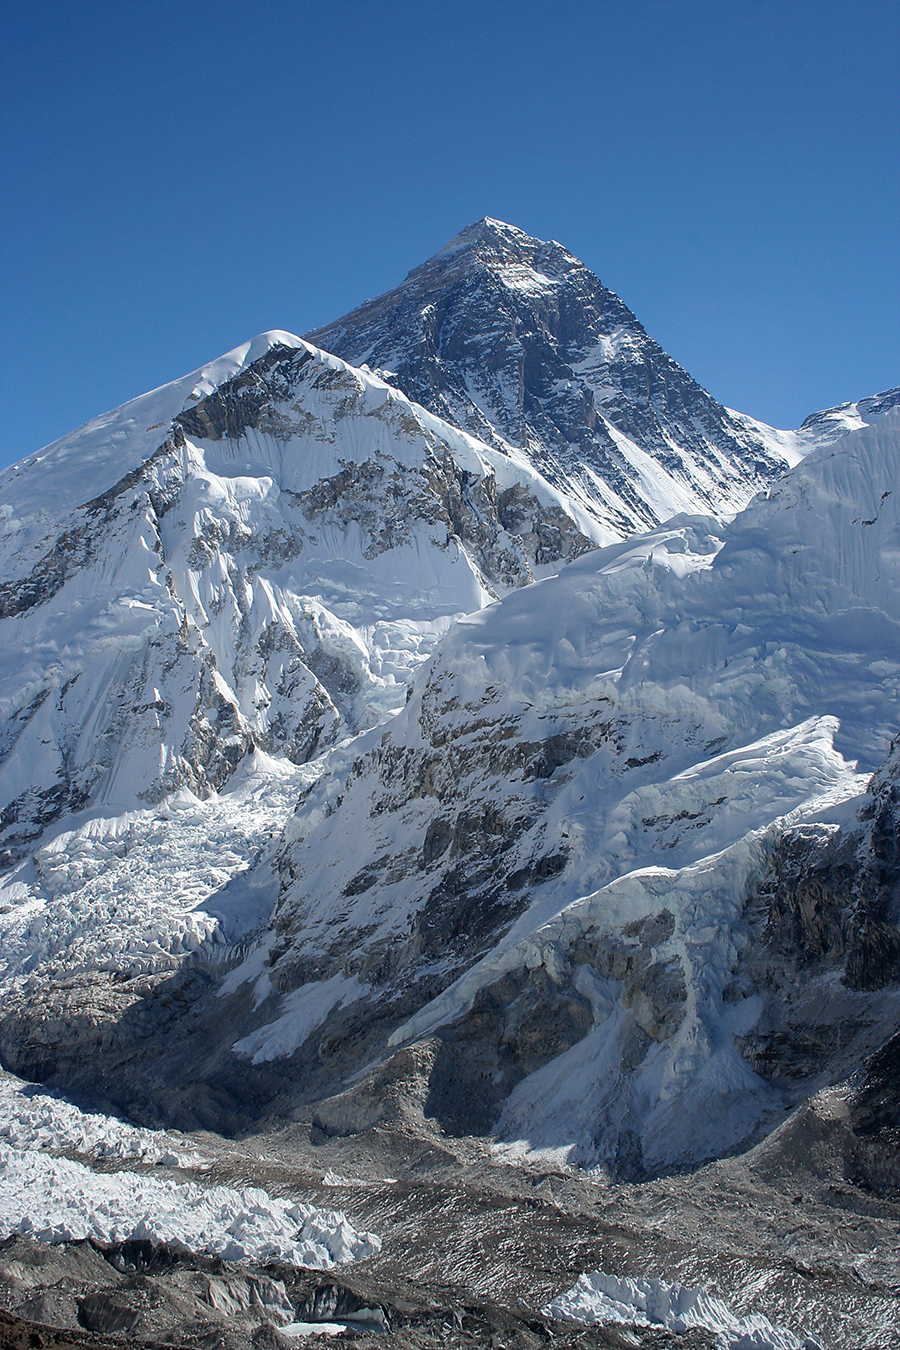
Below, the real Mount Everest. (Photograph by Pavel Novak.)
The high points compared.
 

The 42nd Street globe

ANOTHER NEW YORK CITY GIANT.

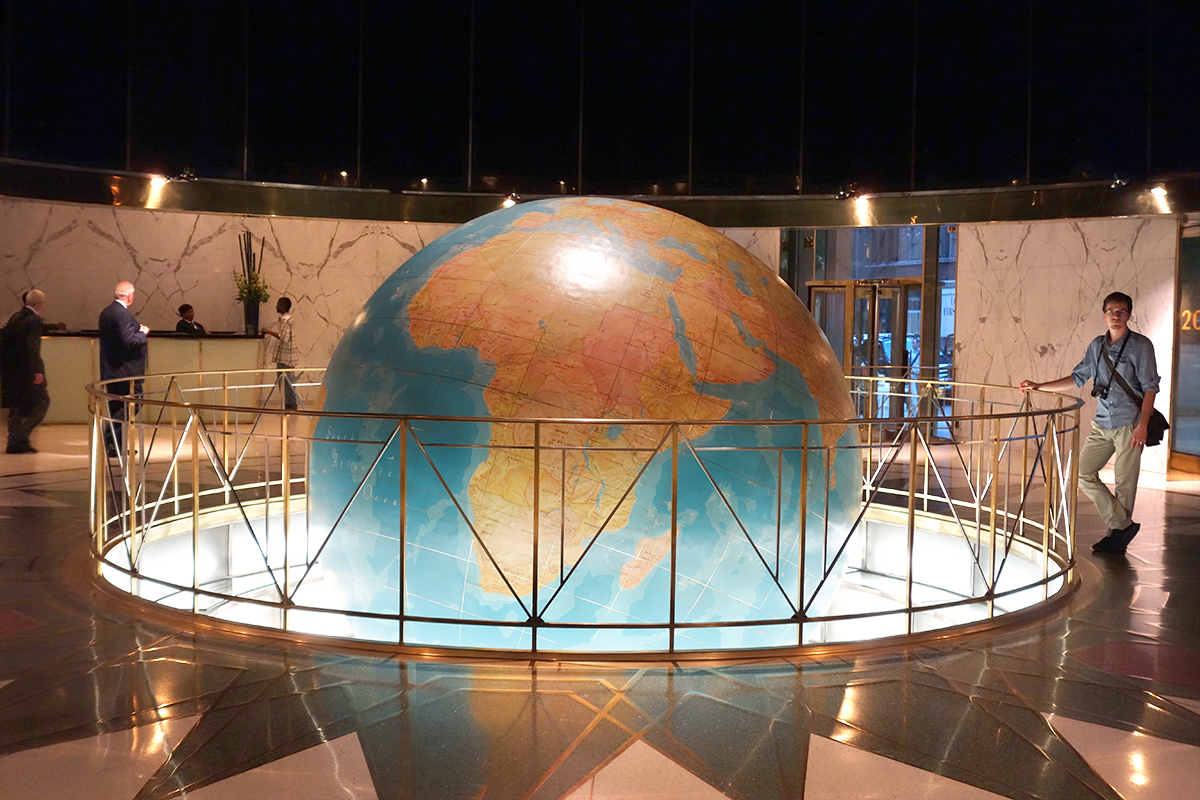
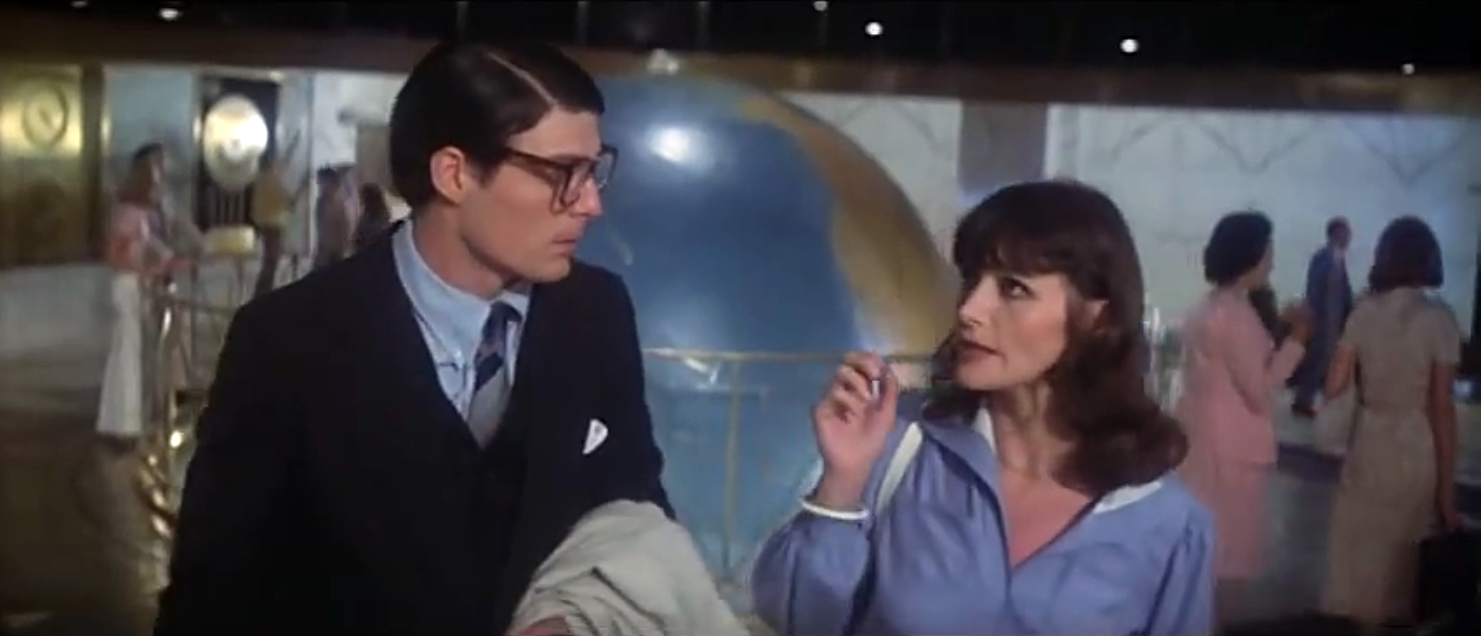
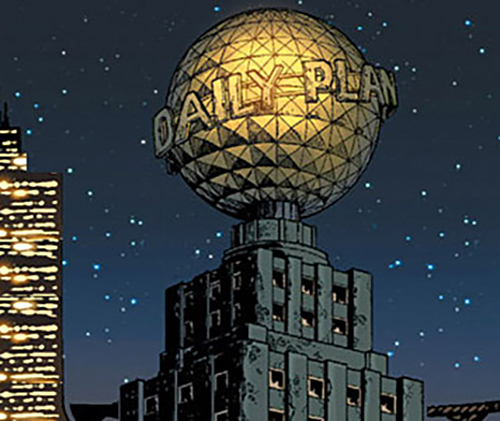
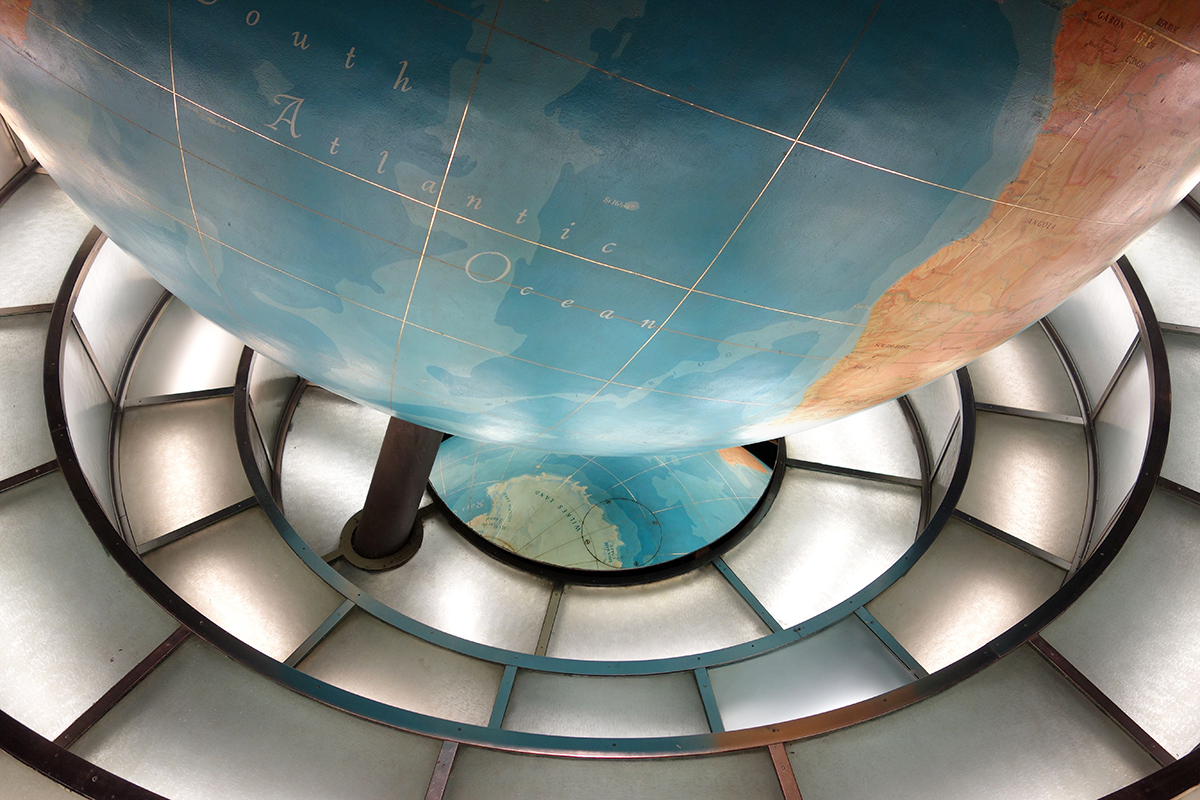
In the lobby of the Daily News Building, a 1930 Art Deco classic on New York’s 42nd Street, is a magnificent globe that’s 12 feet (3.7 meters) in diameter and rotates under a black glass ceiling. The building and lobby are sometimes cited as the inspiration for the Daily Planet newspaper in the Superman comic series. This idea was supported by the fact that the building (and the globe) featured in the 1978 Superman movie (below).

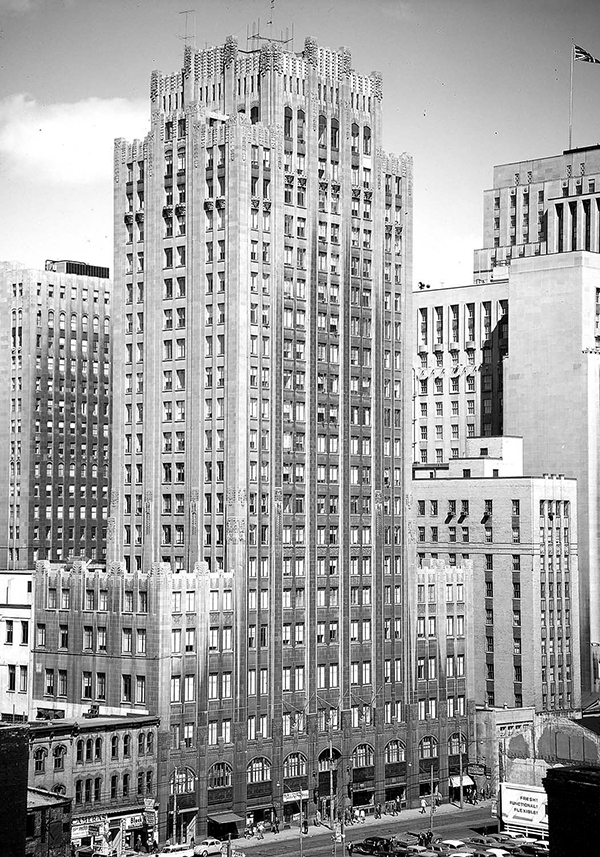
However, the source for the Daily Planet headquarters was the Old Toronto Star Building (below). Superman co-creator Joe Shuster once worked for the Toronto Daily Star as a newspaper boy, and in the early Superman comics the newspaper where Clark Kent worked was called The Daily Star.

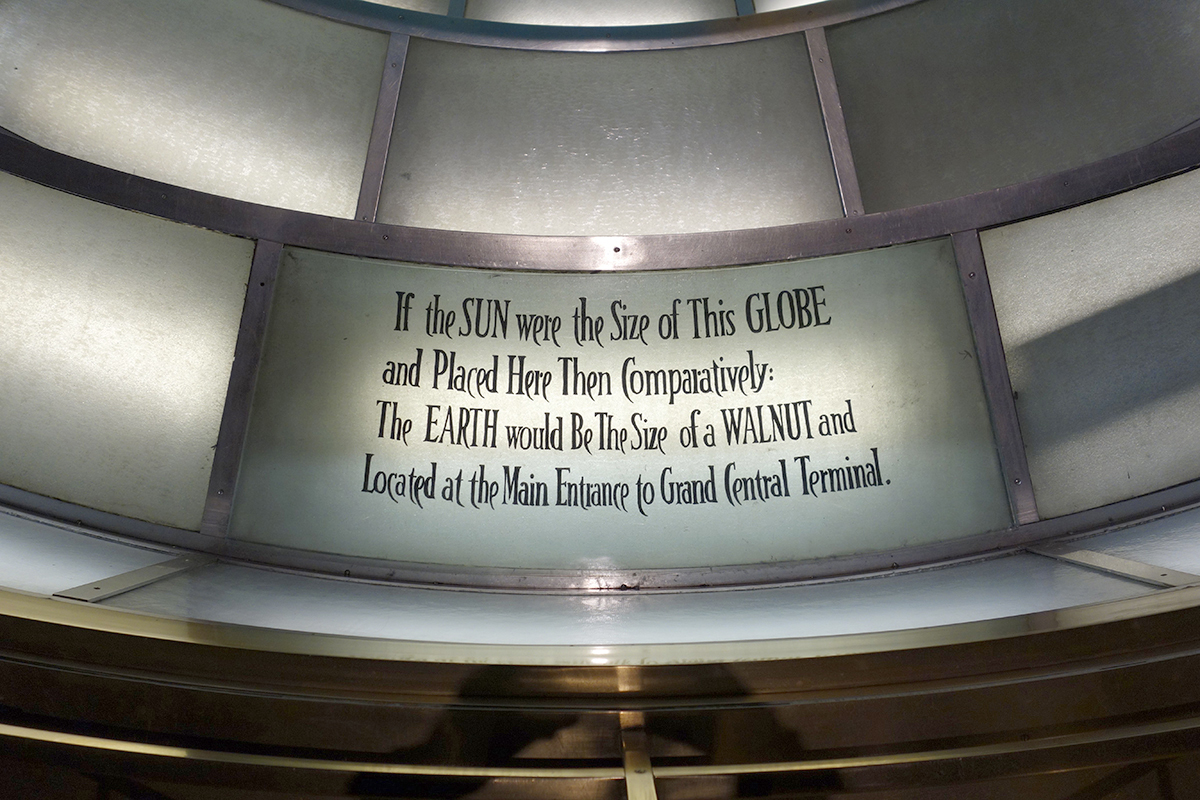
Back to New York City: The Daily News Building’s lobby has meteorological instruments, and clocks with the time in various international cities. The globe is the center of a vast imaginary diagram. There are statements positioned around it with the distances to planets and stars expressed as the distances to landmarks, if the Sun was shrunk to the same size of the globe. So then the Earth would be at Grand Central Station, just down the street (and quite small), and Alpha Centuari would be 68,000 miles away. I love a solar model, as this previous post pointed out:
https://www.johngrimwade.com/blog/2016/12/12/solar-modeling/

The South Pole is reflected in a mirror.

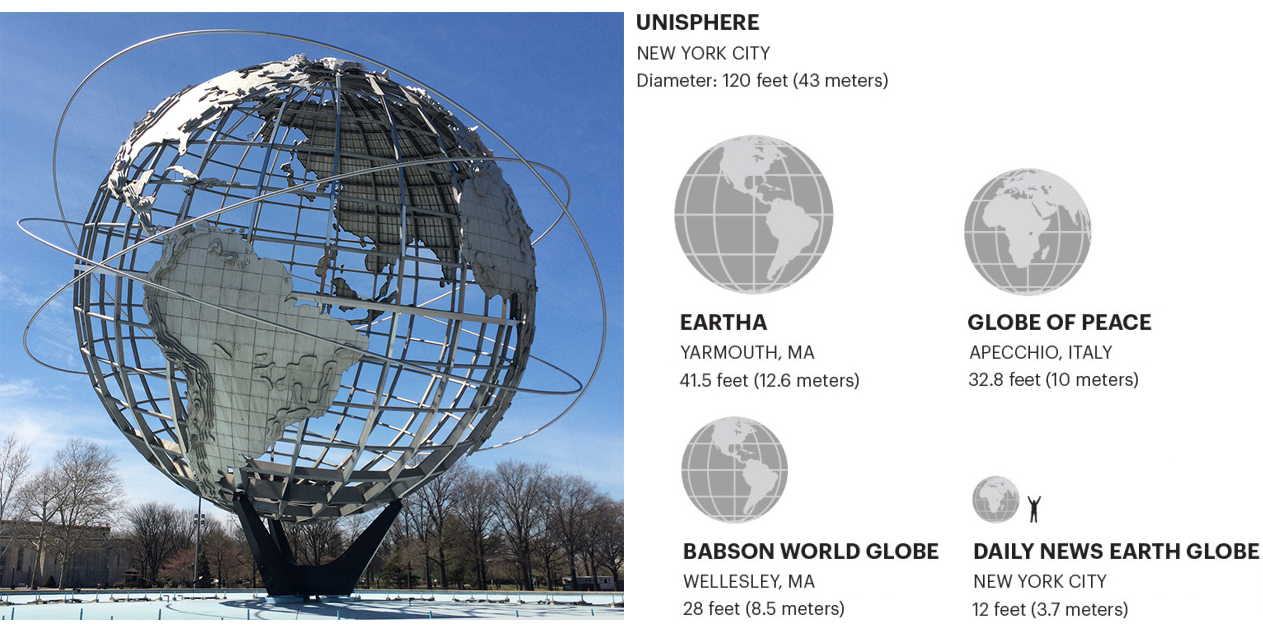
This relative-size graphic of big globes appeared in a post about another (and much bigger) NYC globe, the Unisphere: https://www.johngrimwade.com/blog/2016/08/25/the-biggest-globes/ 

Photographs by Michael Stoll.

Moving borders

CLIMATE CHANGE ALTERS THE EDGE OF ITALY.

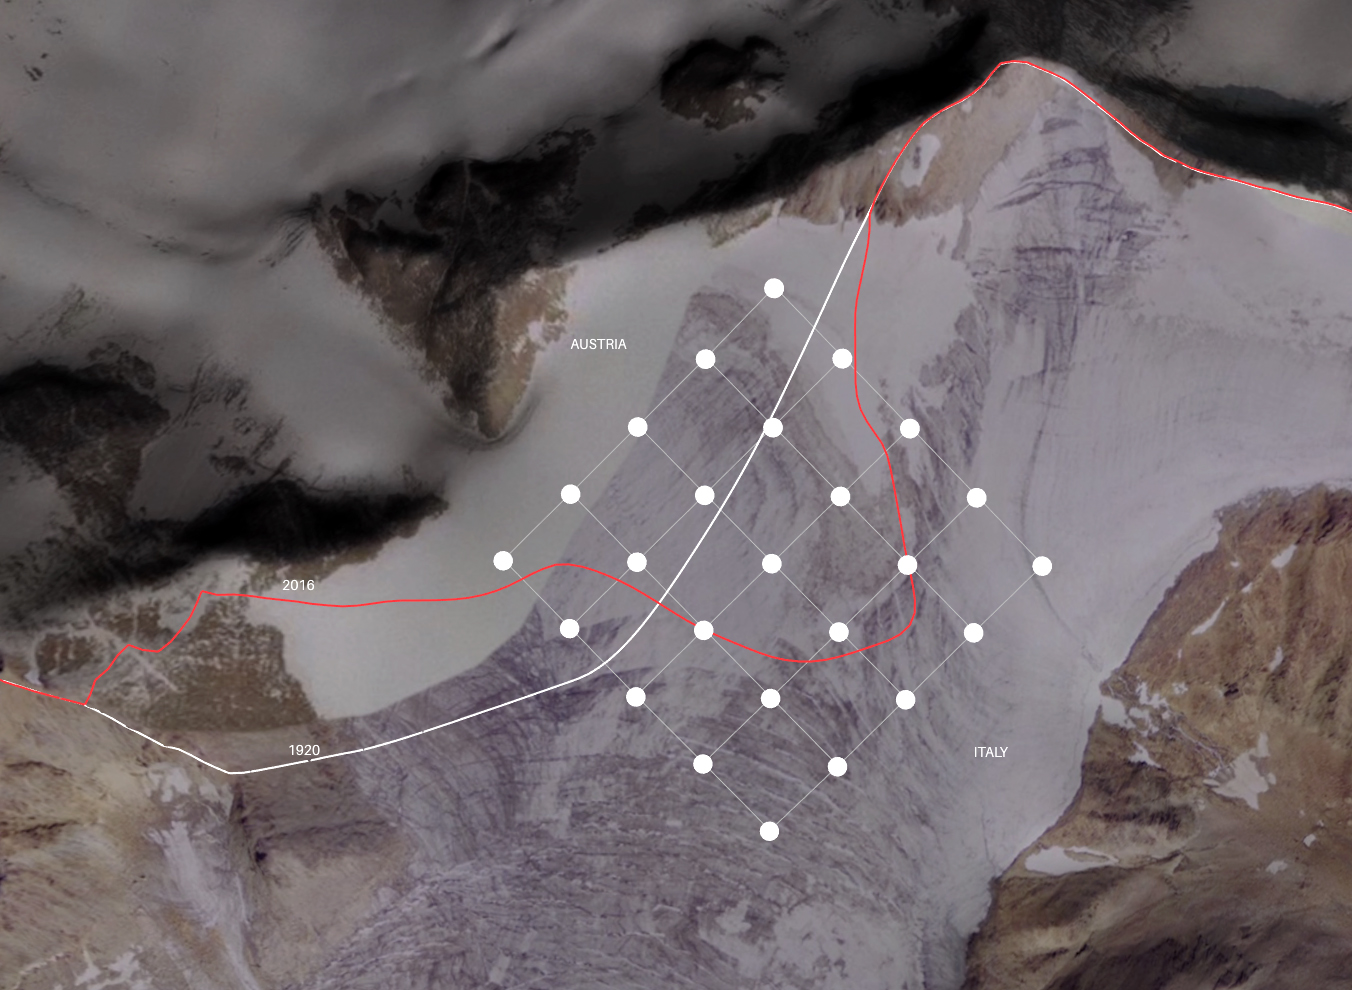
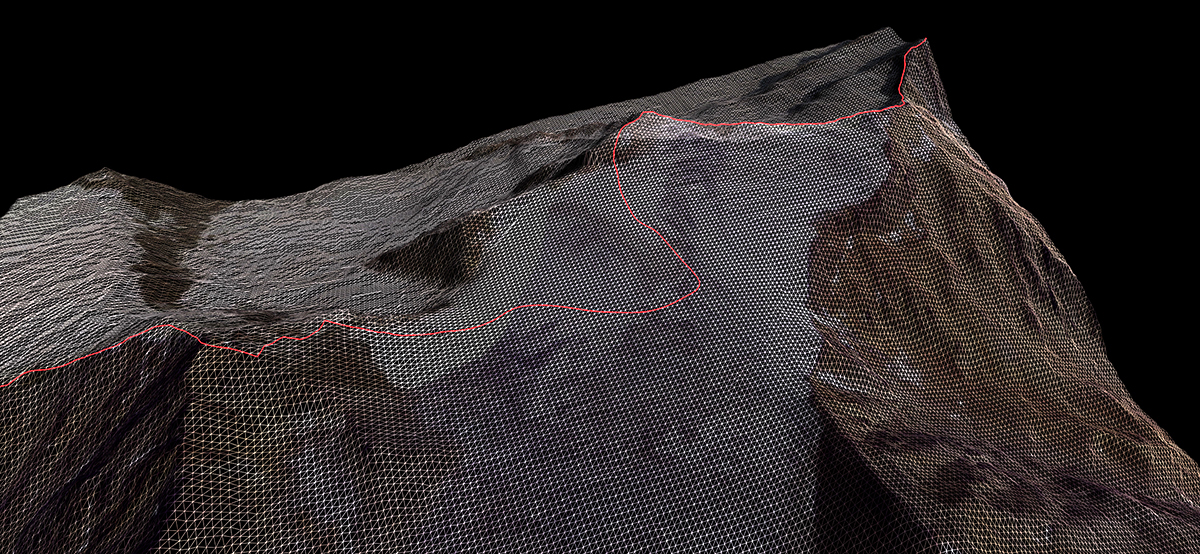
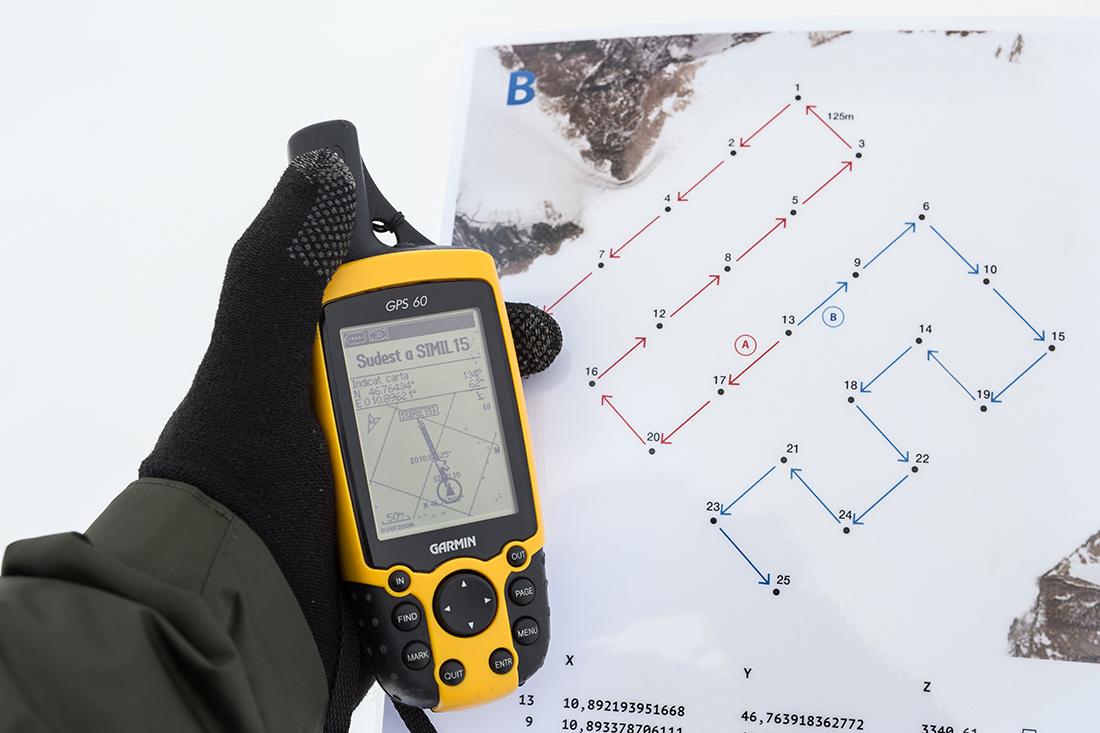
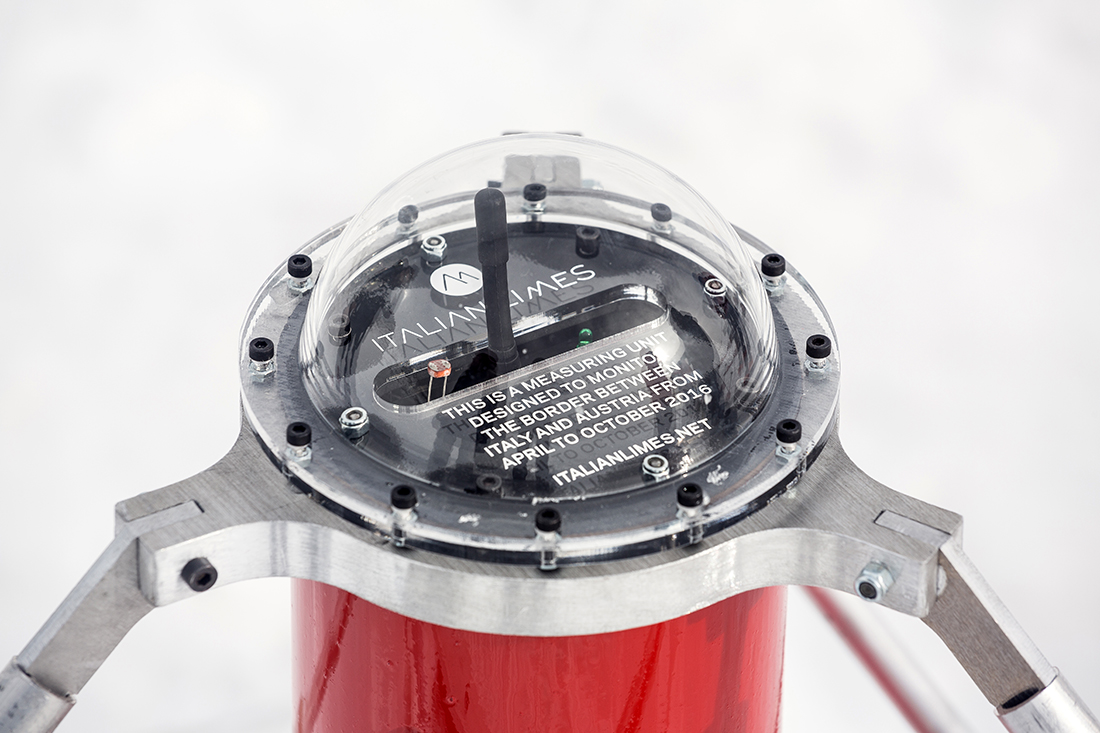
The border between Italy and it’s neighbors in the Alps is not fixed. It depends upon the position of glaciers, and they’re shrinking. Our dependence on fixed printed maps, like those in atlases, is challenged by this data visualization. Using ultra-precise GPS sensors, the border can be seen moving in real time.
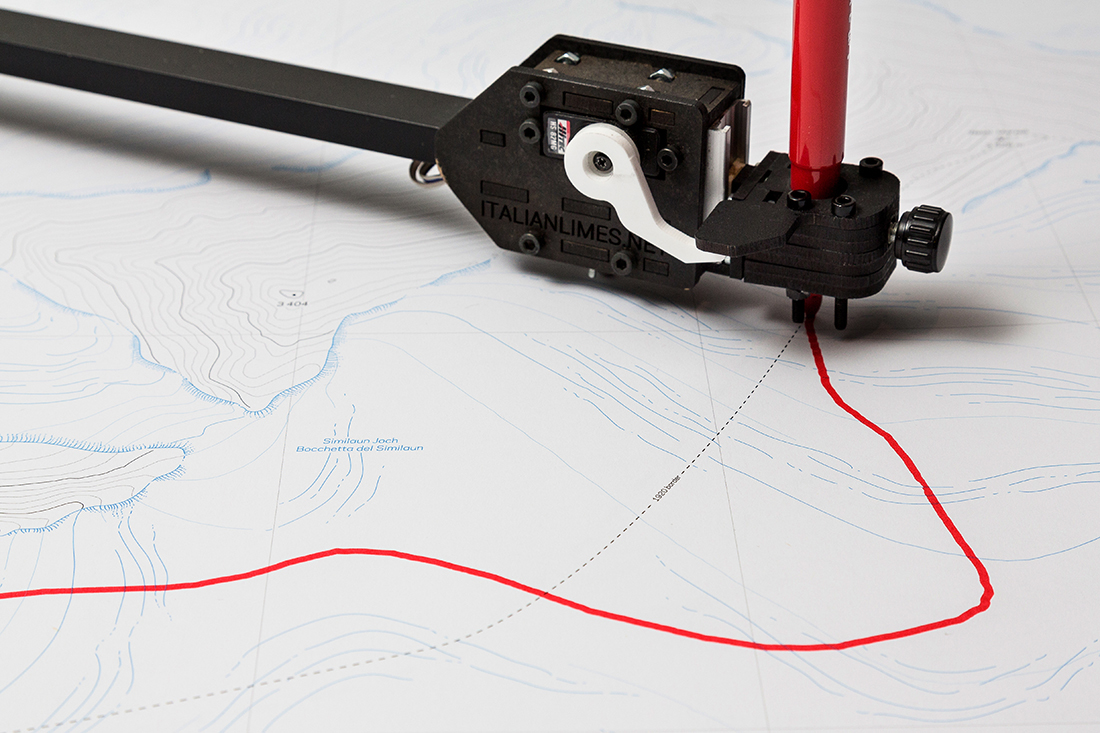
The “Italian Limes” project was originally designed for an installation at the 2014 Architecture Biennale in Venice, by Studio Folder. The focus is the Grafferner Glacier that borders Austria.

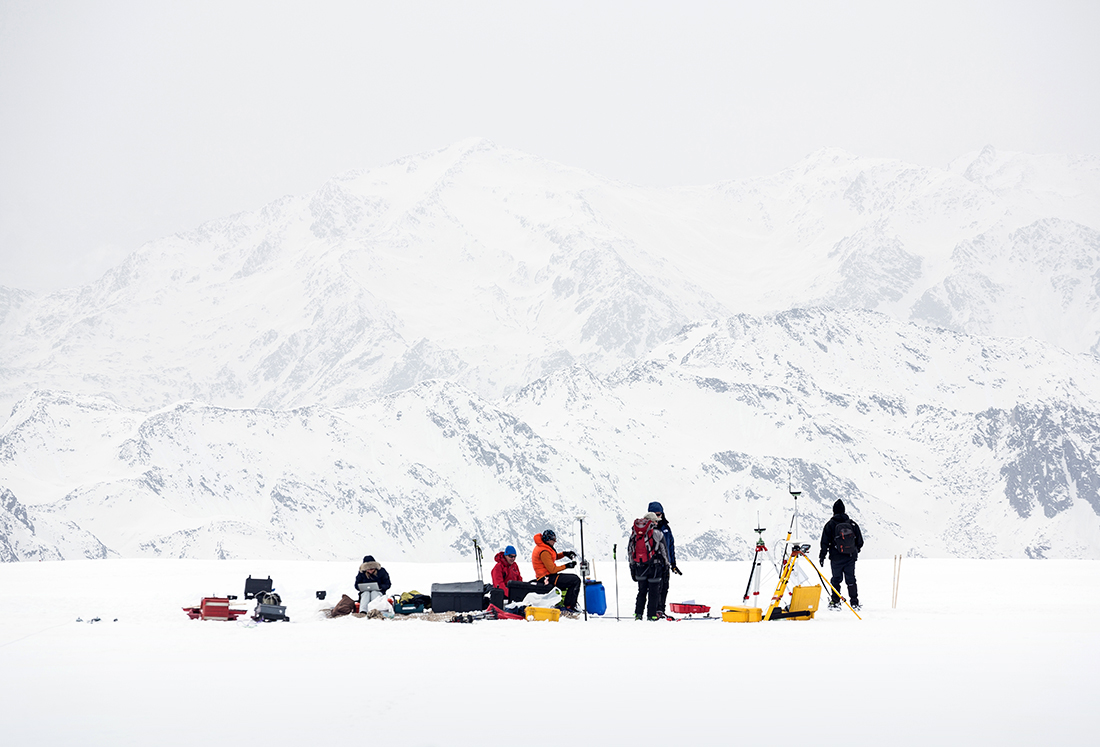
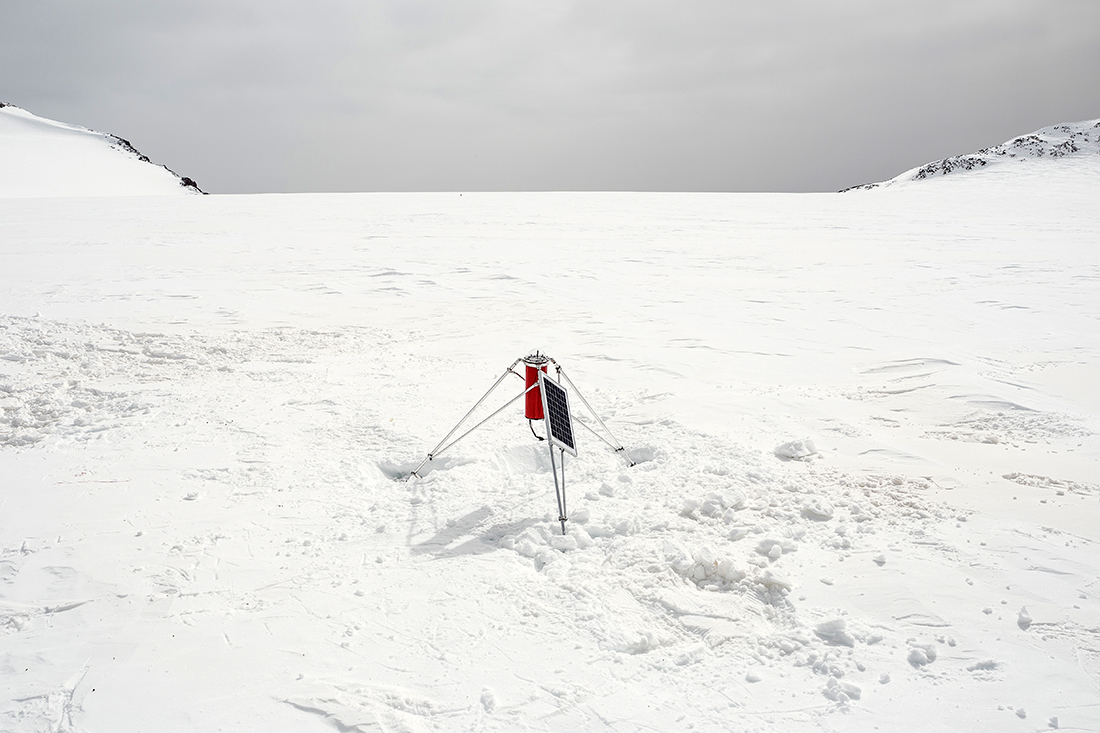
Installing new solar-powered sensors in April 2016 at the base of Mt. Similaun, which is 3,300 meters (10,800 feet) above sea level.

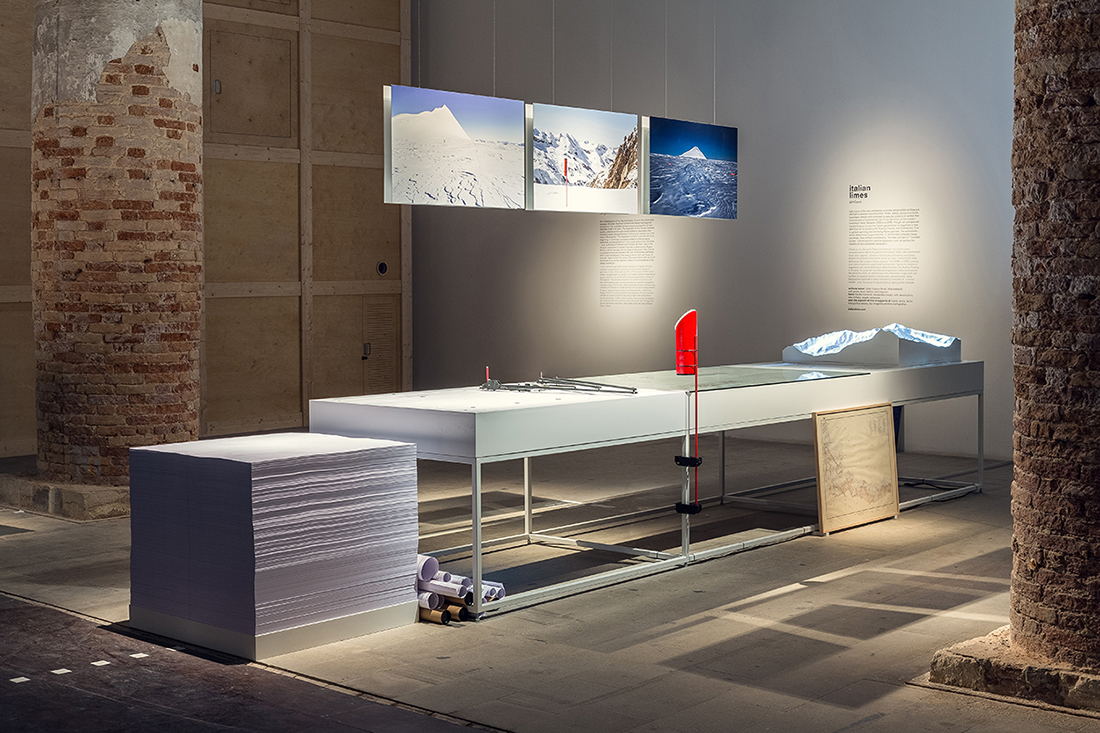
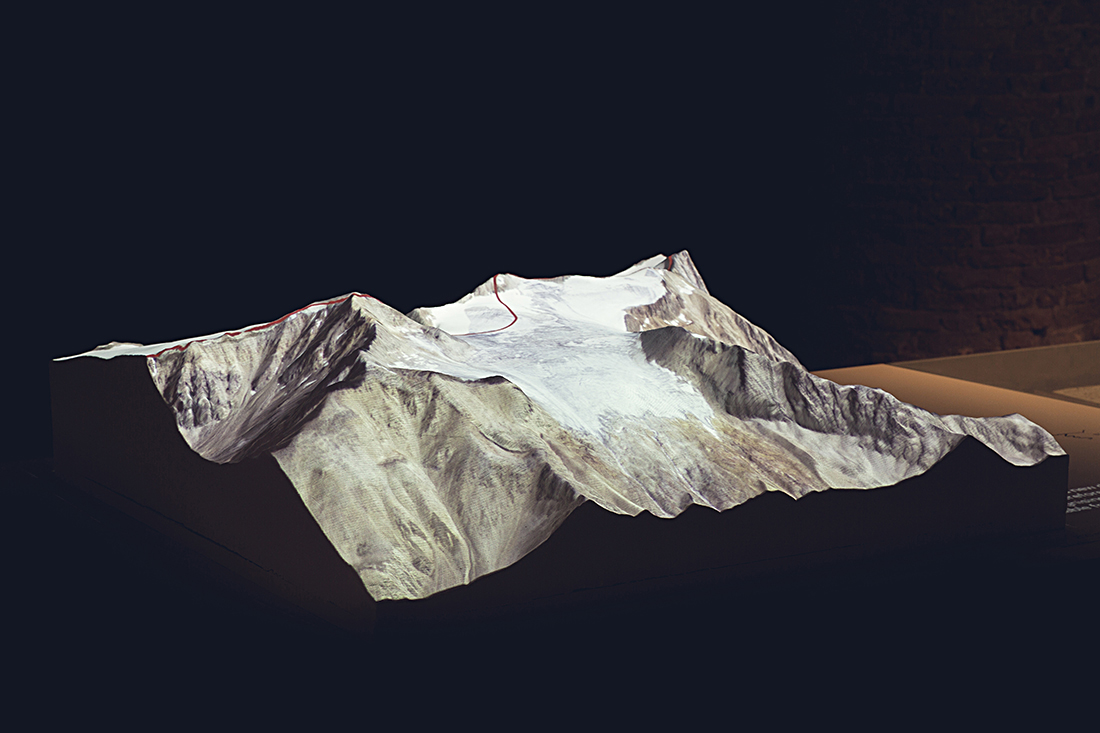
At the installation, changes in the boundary are projected onto a 3D model.

An automated pantograph, controlled by an Arduino board and programmed with Processing, translates the coordinates received from the sensors on the glacier into a real-time representation of the shifts in the border. It produces a real-time map that visitors can take away.

http://www.italianlimes.net

Italian Limes is an ongoing project by Folder (Marco Ferrari, Elisa Pasqual), Delfino Sisto Legnani, Pietro Leoni, Alessandro Mason, Angelo Semeraro, Livia Shamir. All photos are by Delfino Sisto Legnani.

The incredible Bollmann map workshop (2)

THE AXONOMETRIC VIEW.

(See Part 1 here: https://www.johngrimwade.com/blog/2017/03/27/the-incredible-bollmann-map-workshop-part-1/)

Perspective effect
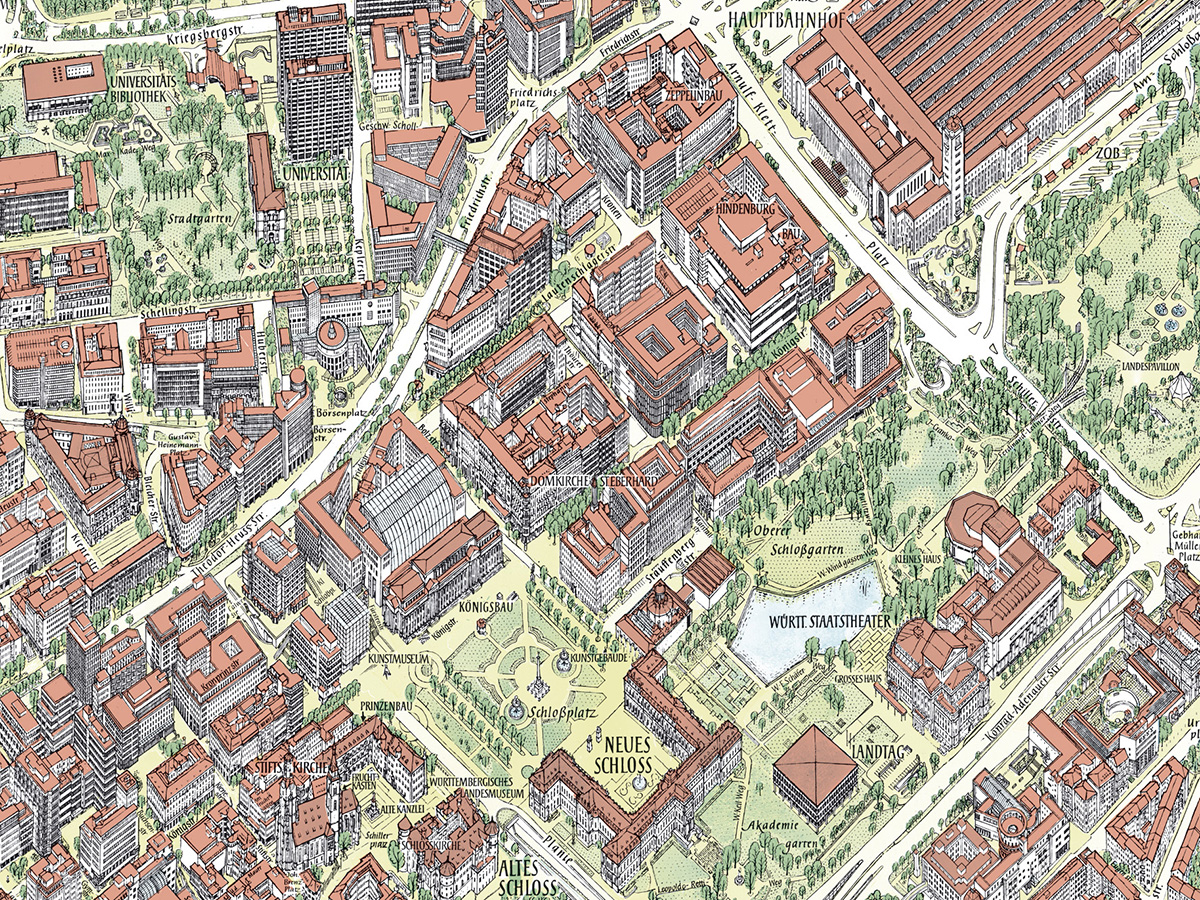
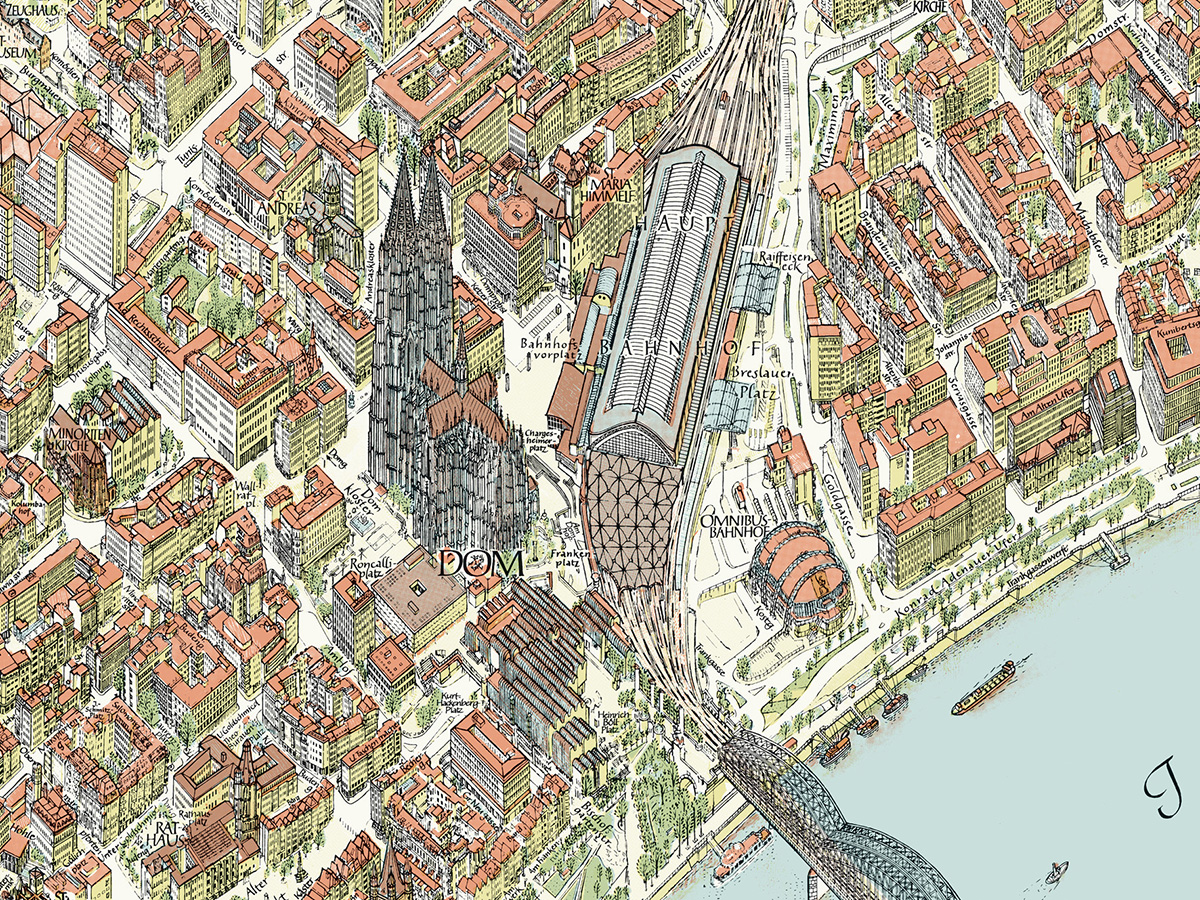
The maps are obviously not drawn in perspective. They use a modified axonometric projection, invented by Hermann Bollmann. With this kind of parallel projection, the scale is constant across the map. A 45-degree angle gives the best compromise of dimension and clarity, and each map has it’s own unique viewpoint which is chosen to best show that city. The color palette is also selected on a case-by-case basis.

Detail from the Stuttgart map.

The secret of success
Why do Bollmann’s maps seem so much more informative, in terms of being useful navigational aids, than aerial photos and 3D-rendered views like Google Earth? There is a lot of high-tech, data-driven mapping at our disposal, but it is no match for their informational artistry. A key factor is that the Bollmann maps are not drawn in an exact realistic proportion. Otherwise we would mostly see roofs with compressed facades, which would not be useful for helping navigation on the ground. Buildings are adjusted to be more visually descriptive without compromising the character of the structure. A vertical exaggeration of between 120% and 170% is applied, depending on the character of the city. Also, the streets have been considerably widened, so we can clearly see them and their labels. It’s not obvious until you compare one of these maps to an aerial photo. “We draw cities from above, as you see them from below”, says Sven. Like all good informational graphics, the interpretation enhances our understanding. A crucial point. It’s why many 3D-rendered maps are very unsatisfying. Just disappointing pieces of technical wizardry, in terms of wayfinding, without this careful infographic intervention.
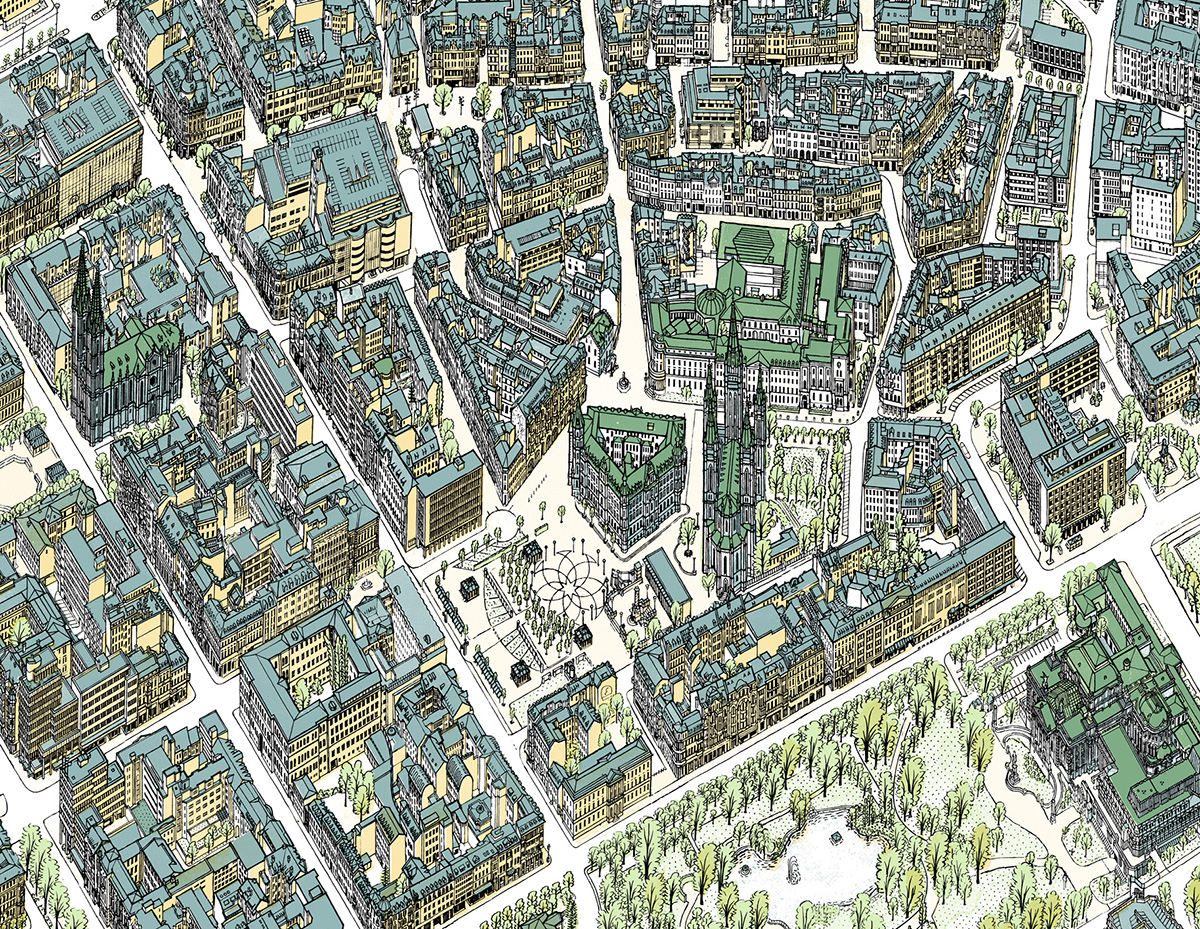
Detail of the Wiesbaden map.

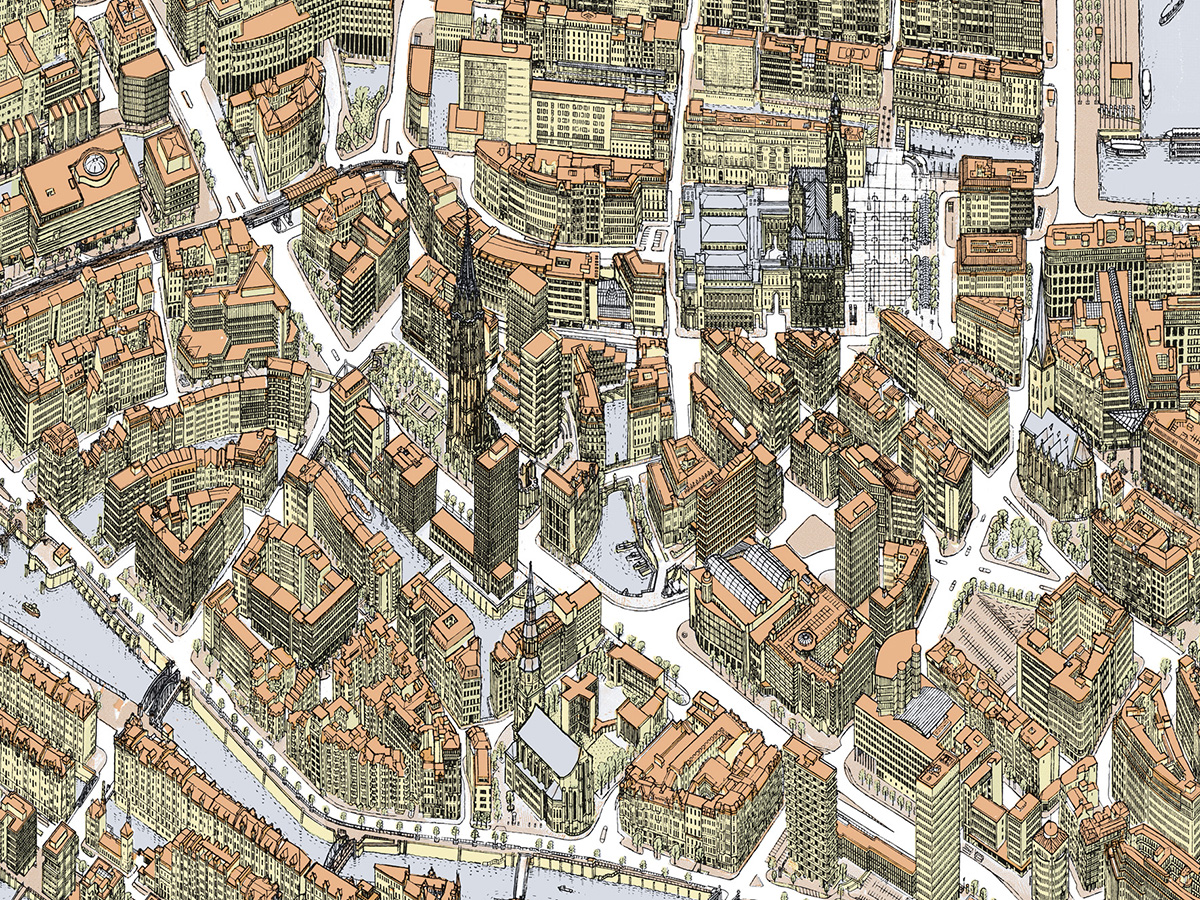
Detail of the Hamburg map.

Master mapmaker
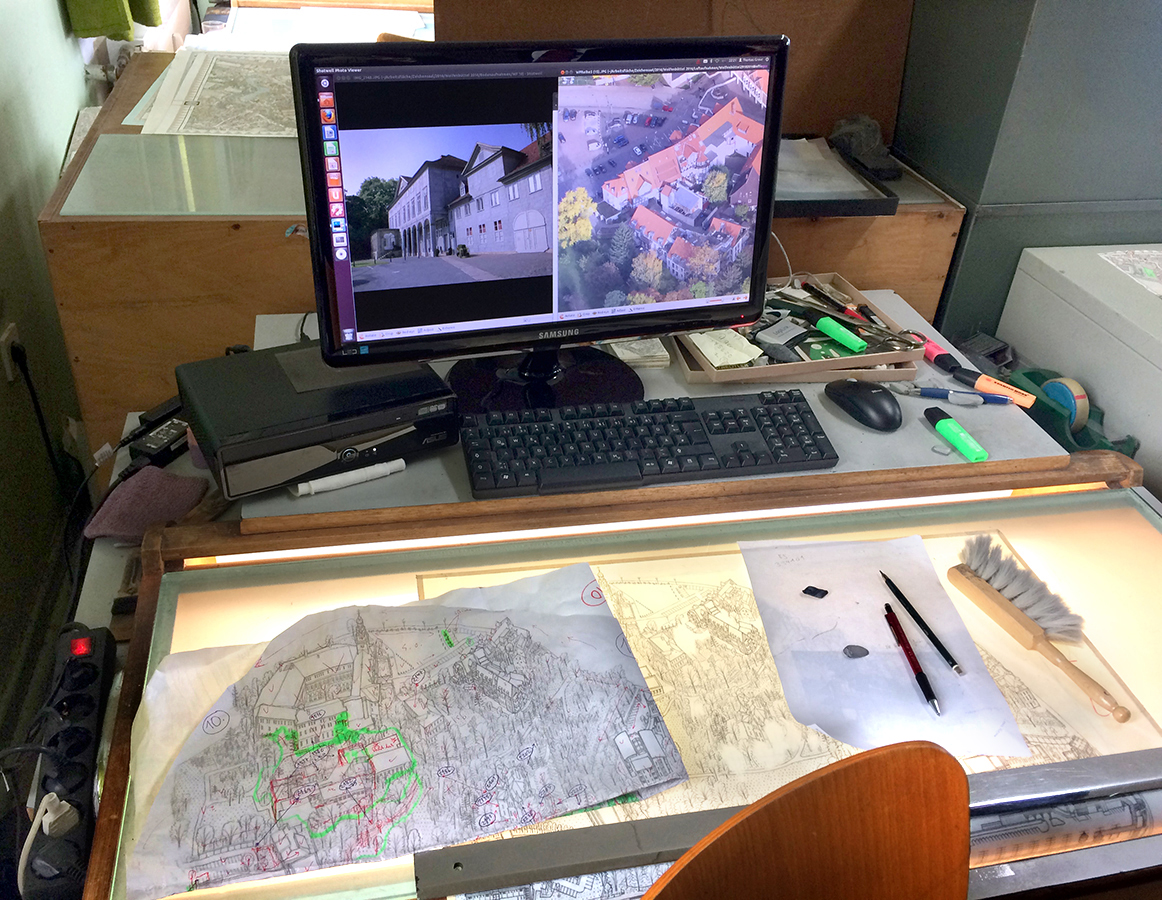
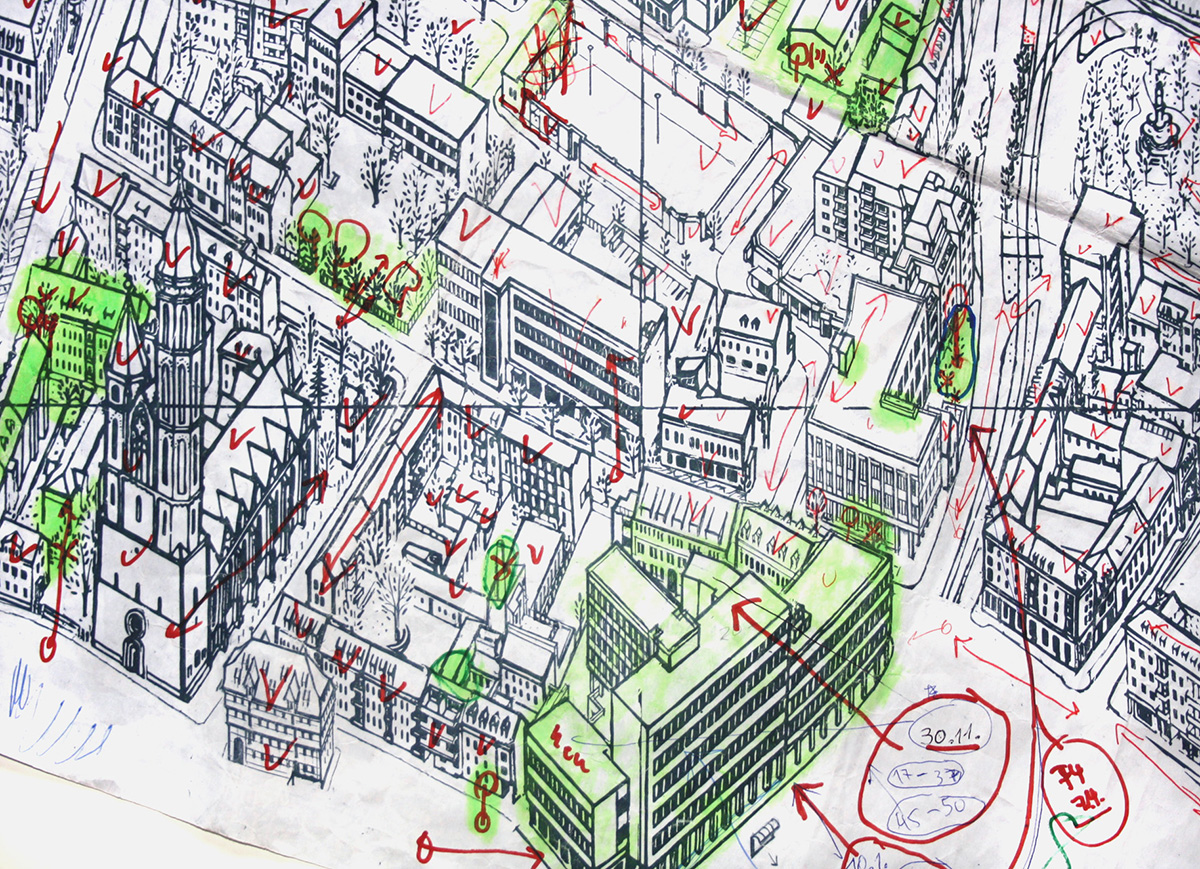
Above is Thomas Greve’s workstation, where he spends many hours making hand-drawn map corrections. It’s a mixture of analog and digital. Photos from the street, and from the air, are on the monitor. Areas needing attention are marked in green. The detail below (different from the one shown above) shows the painstaking checking and correction process.

Advertising pays the bills
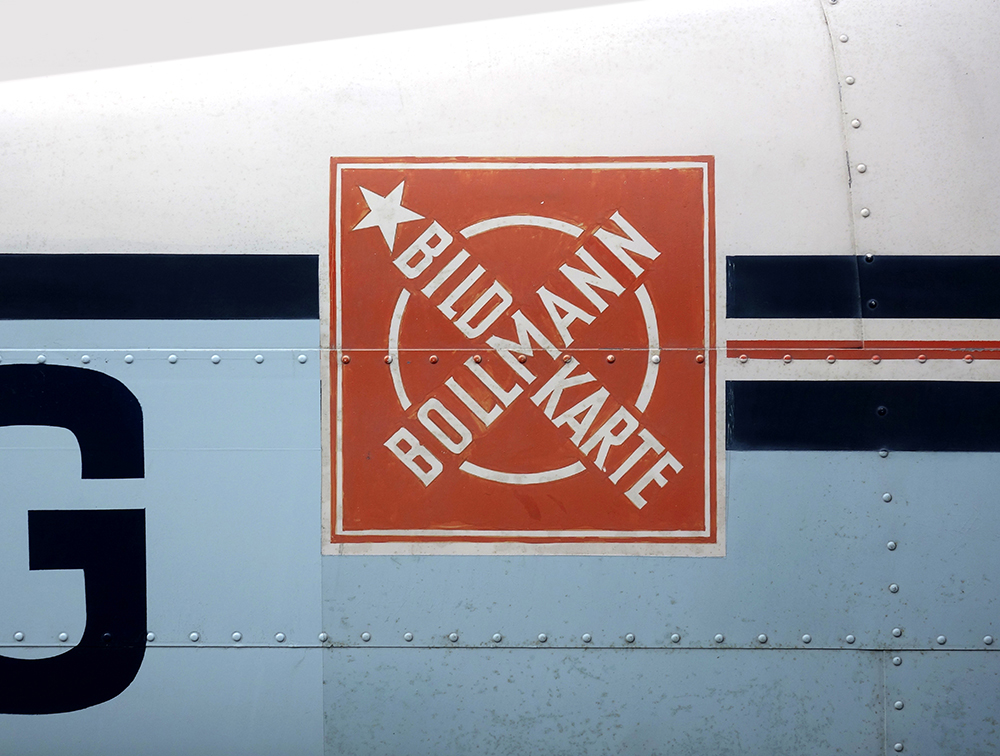
90% of Bollmann’s income is from companies having their small logo placed on a map. This has been the business model since the company began. Without that source of revenue, they would not have been able to maintain their standards. Well, not without having to charge a very high price for each map. The current cost of a folded city map is 6.90 Euros (about $7.25).

New York City
I mentioned in an earlier post, the classic map of the 1964/65 World’s Fair that I have on the wall in my office:
www.johngrimwade.com/blog/2016/08/25/the-biggest-globes.
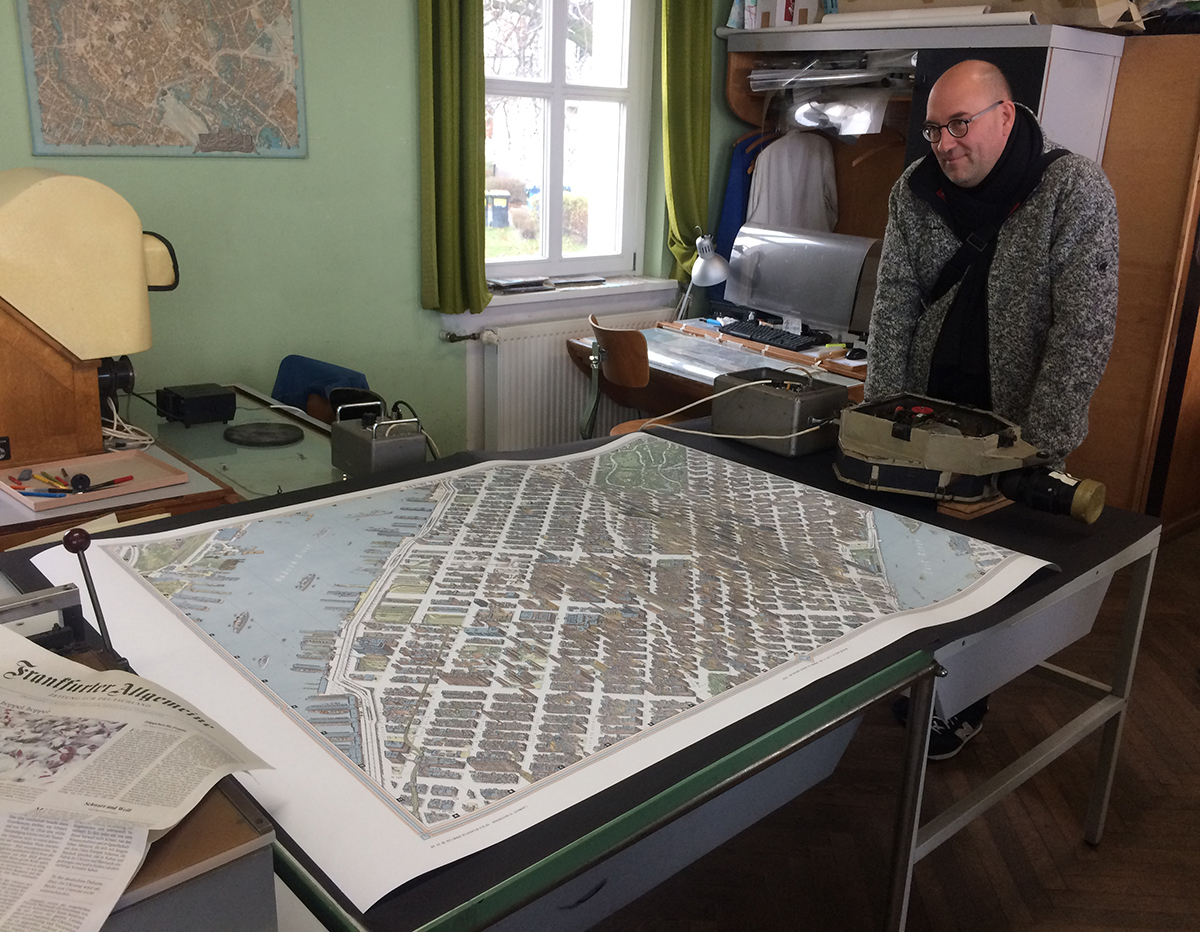
To mark my visit, the Bollmanns presented me with the best gift imaginable, a specially-printed oversize version of the classic map of New York City. This 1962 tour-de-force was based on 50,000 street-level photographs, and 17,000 from the air. The print is huge and magnificent, and framing it will cost me a very large amount of money, but I’m finding a wall and this is going on it. Here is Michael Stoll* standing near the map, and perhaps wishing it was his.

A big thank you to Sven Bollmann for his invaluable help with these two posts. And for that amazing map!

Bollmann Maps: www.bollmann-bildkarten.de

(All map images © Bollmann Bildkarten. All photographs by Bollmann Bildkarten, or Michael Stoll.)

*Professor Stoll organized this trip for myself and four of his students from the Augsburg University of Applied Sciences. Michael’s superb collection of classic information design has featured in this blog a number of times already, and will be here in the future.

The incredible Bollmann map workshop (1)

AT THE HOME OF THE MASTERS OF THE ILLUSTRATED MAP.

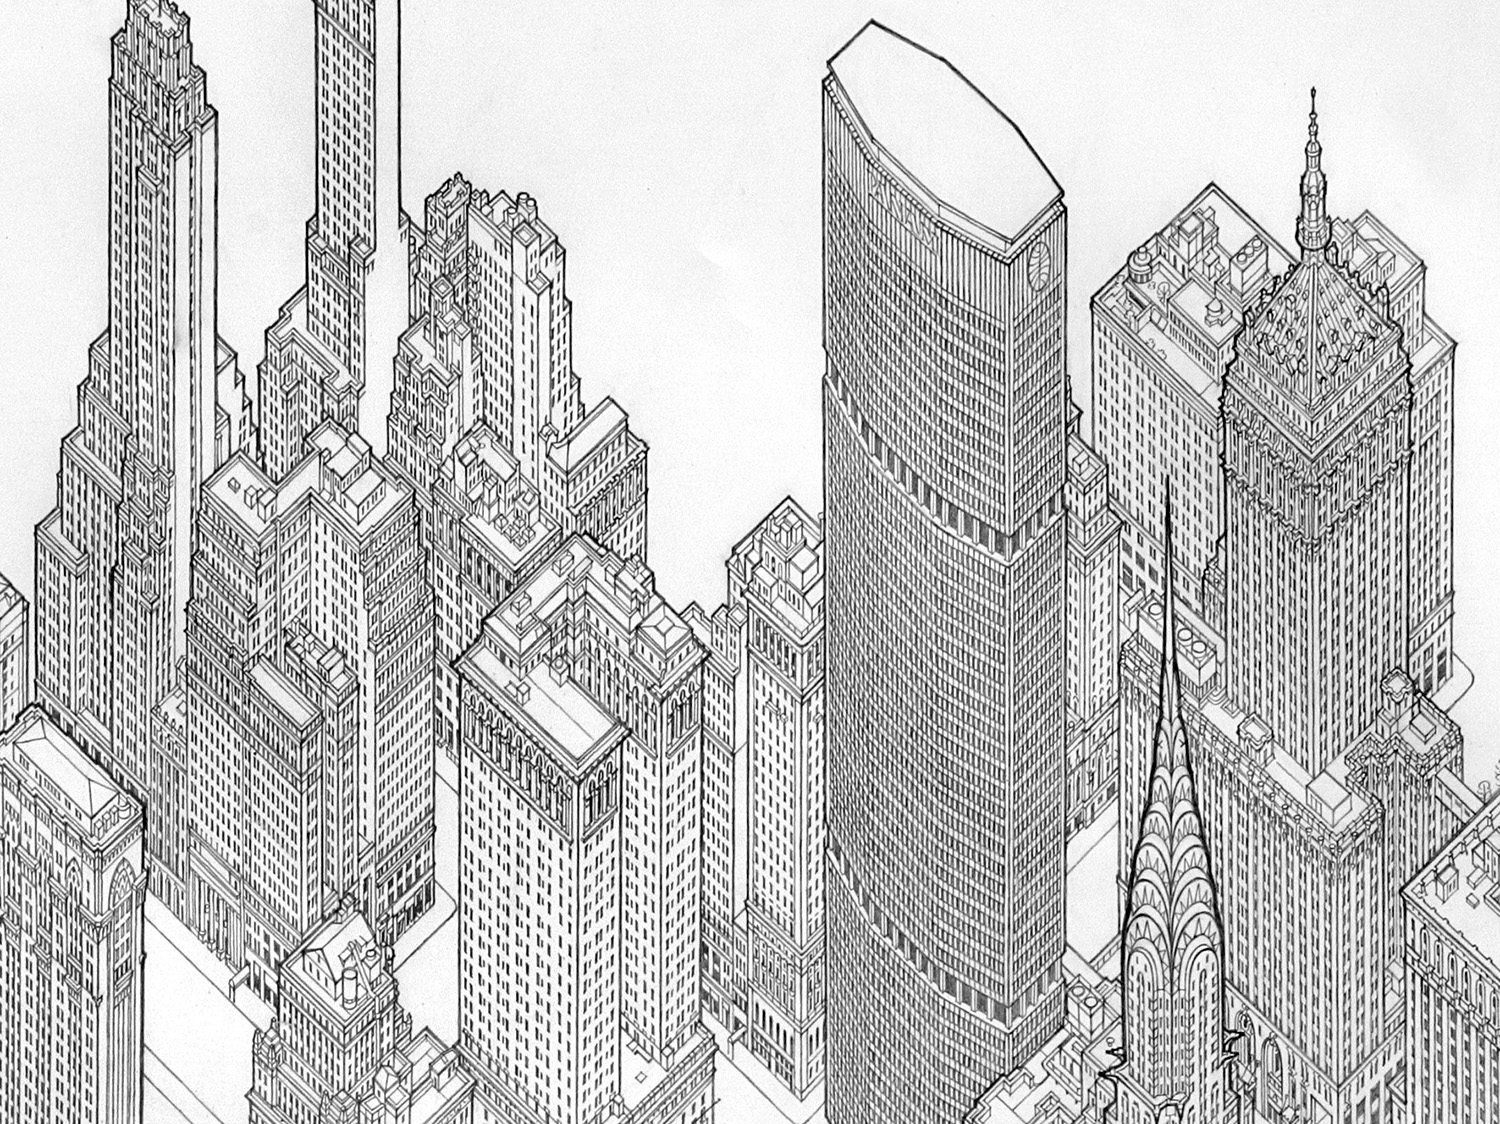
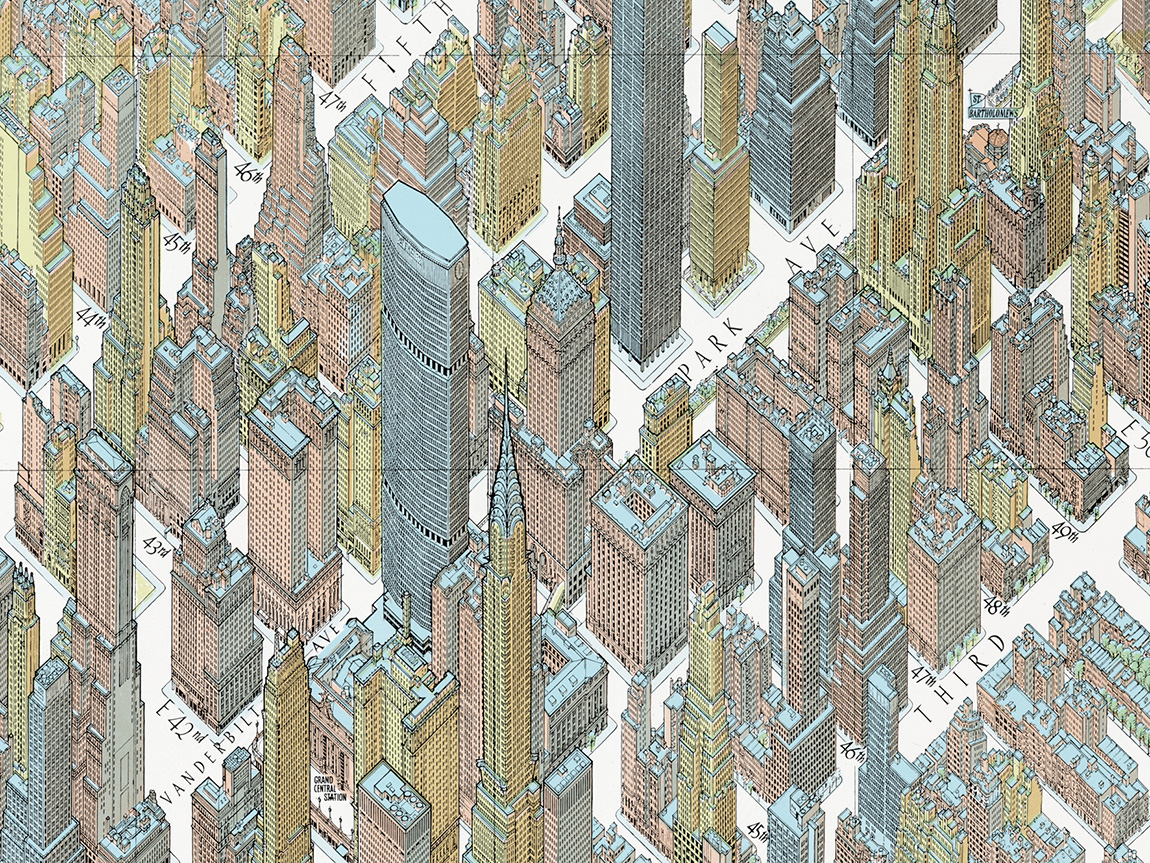
Detail from the 1962 map of New York City.

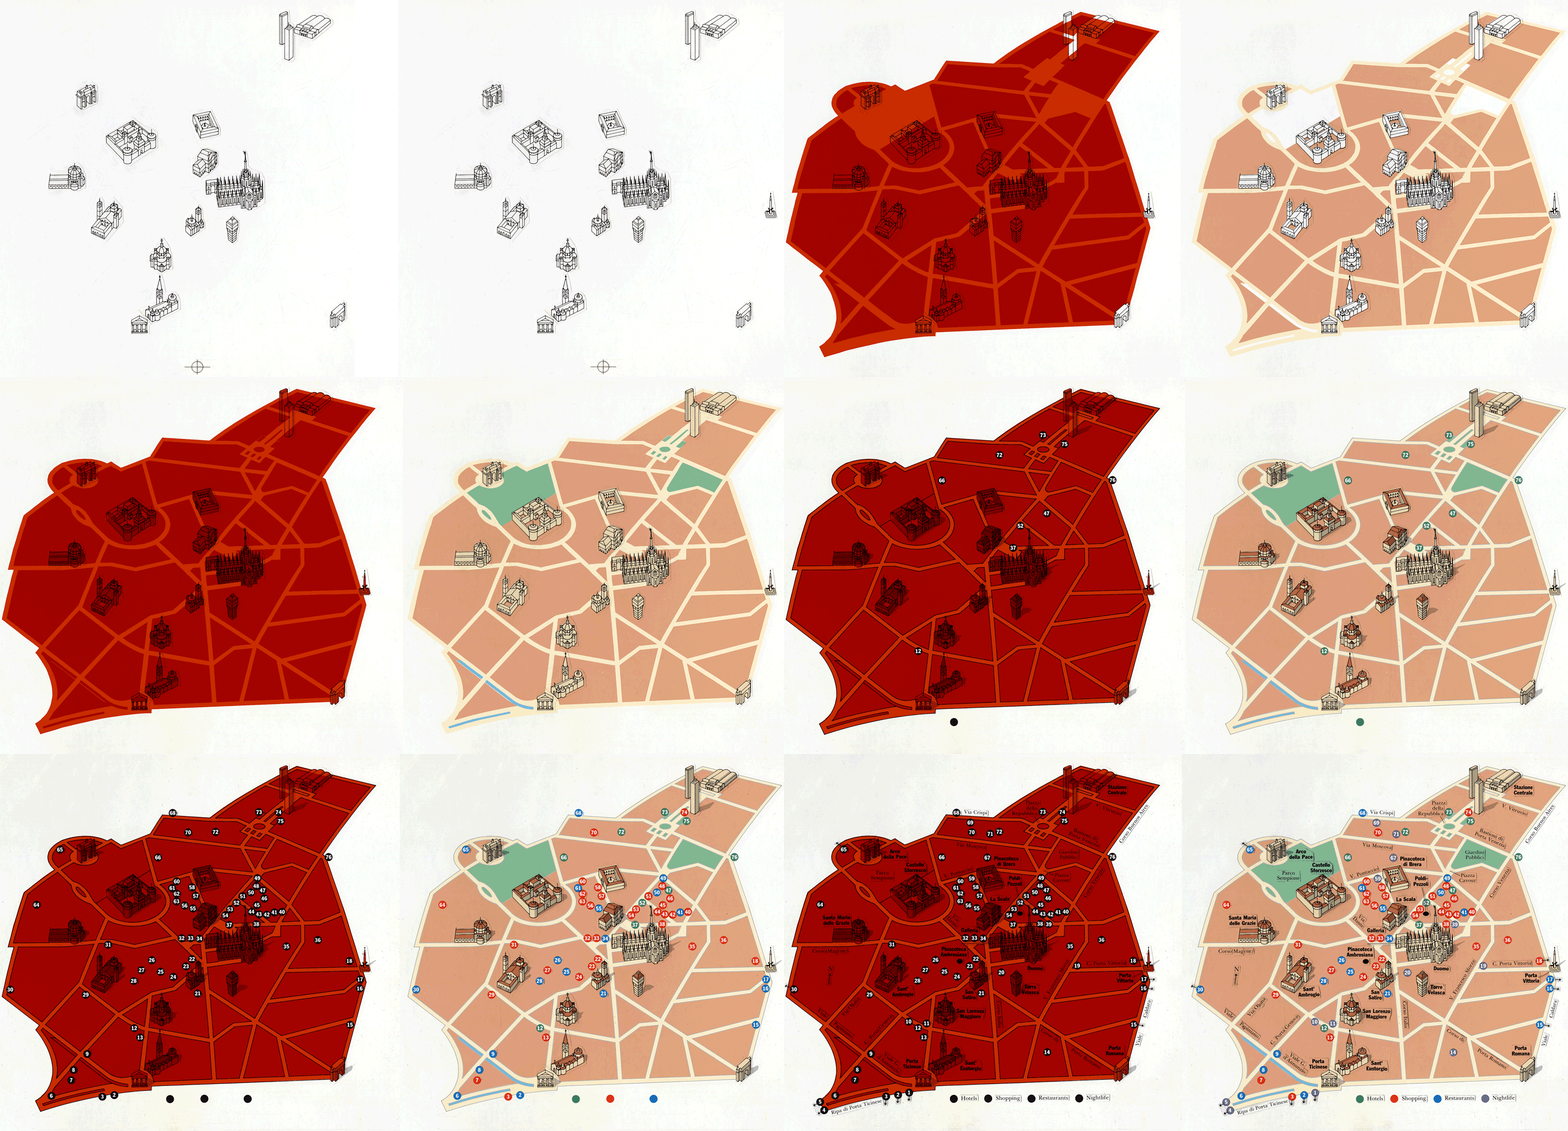
On the 18th of November last year, I stepped into a time tunnel, and stepped out into the offices of Bollmann Maps in Braunschweig, Germany. And I mean that in the best possible way. These cartographers produce all of their maps with the same methods that have been in use since 1963. Everything is hand-crafted. The production process is completely analogue. They use pen and ink on overlay film, photograph it with a classic 1950s line art camera, and print on their own 1965 printing press. (Bollmann Maps: www.bollmann-bildkarten.de)

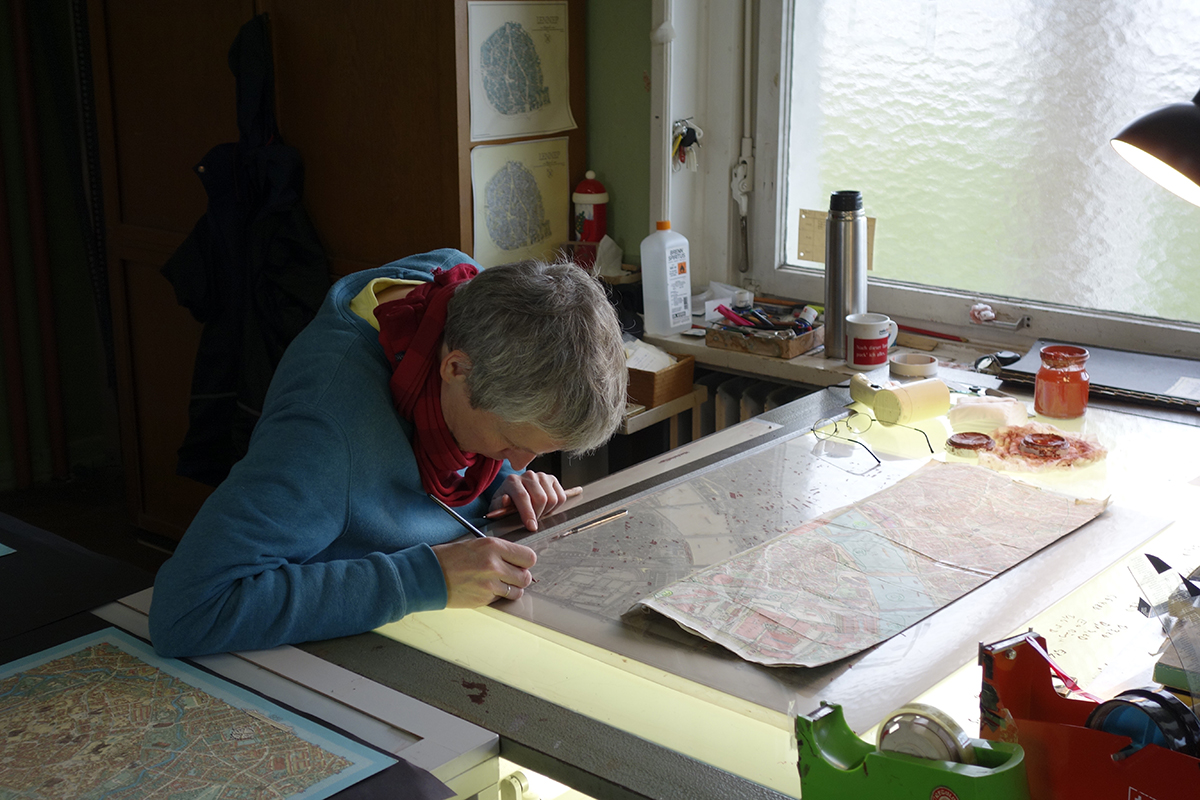
Jan at work on a set of map overlays.

Care, craftsmanship, quality. This visit was a unique and memorable experience. Sven Bollmann, and his brother Jan, showed our group around. Their pride in the work was evident everywhere, and so refreshing to see. Whatever they have achieved has been through solid, hard work and by relentlessly applying the highest standards. If I had the Grimwade Gold Award of Informational Graphic Excellence to hand out, they would be getting it by FedEx two-day express shipping.

Origins
After the Second World War, Hermann Bollmann (Sven’s grandfather) was looking to record, as part of the rebuilding process, the devastation from the Allied bombing of Braunschweig. So in 1948, he decided to make an aerial-view illustrated map. The 69-year story of Bollmann Maps began right there. The first map was made purely from street-level observations, not from aerial photographs. Today, the company has a catalogue of about 100 maps, most of which they update every five years or so. The list includes many German cities, but also Amsterdam, Copenhagen, Jerusalem, and several other international urban centers. There is a staff of 10, including three artists and cartographers. Each map takes a maximum of one year to produce (or it would be out-of-date by the time it is printed), and thousands of aerial and street-level photographs are used as references.

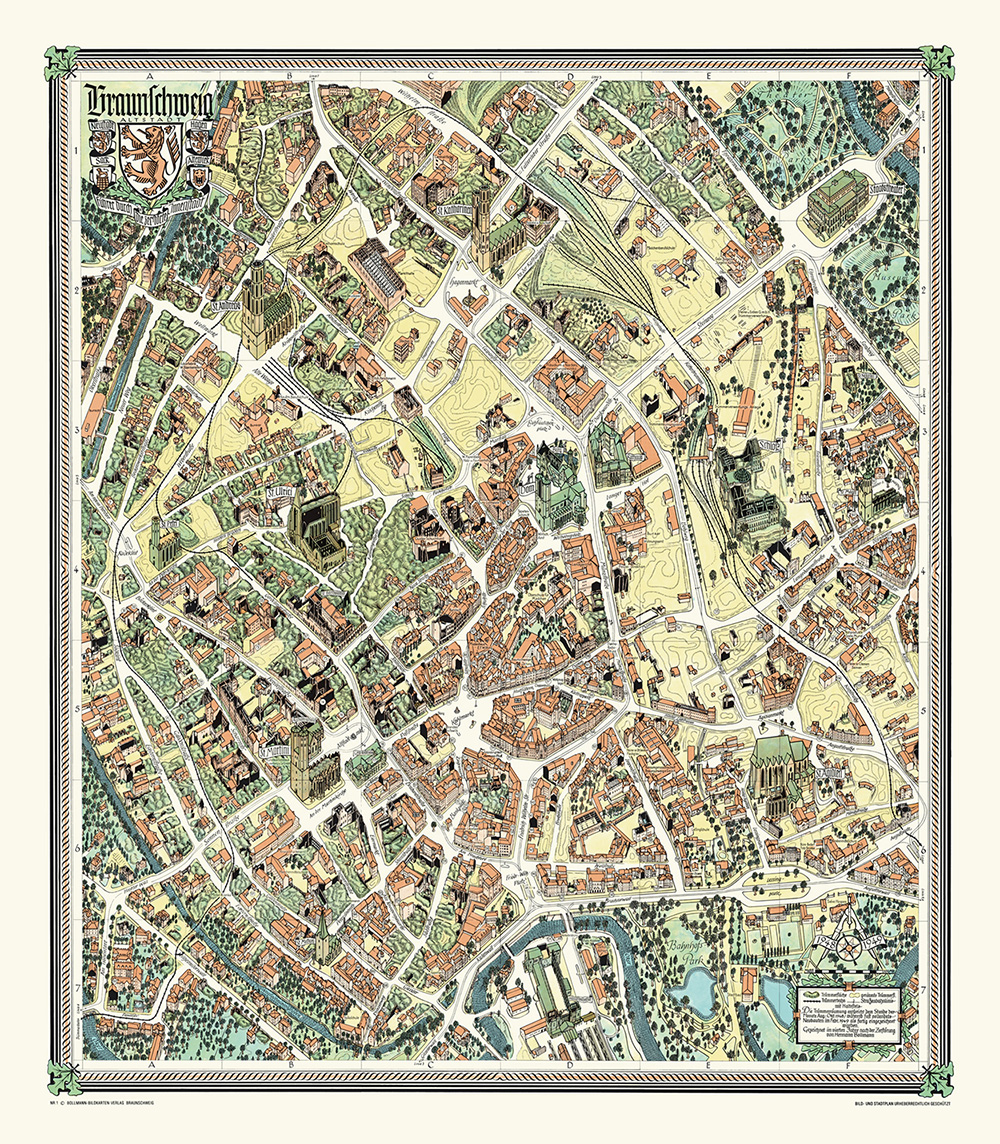
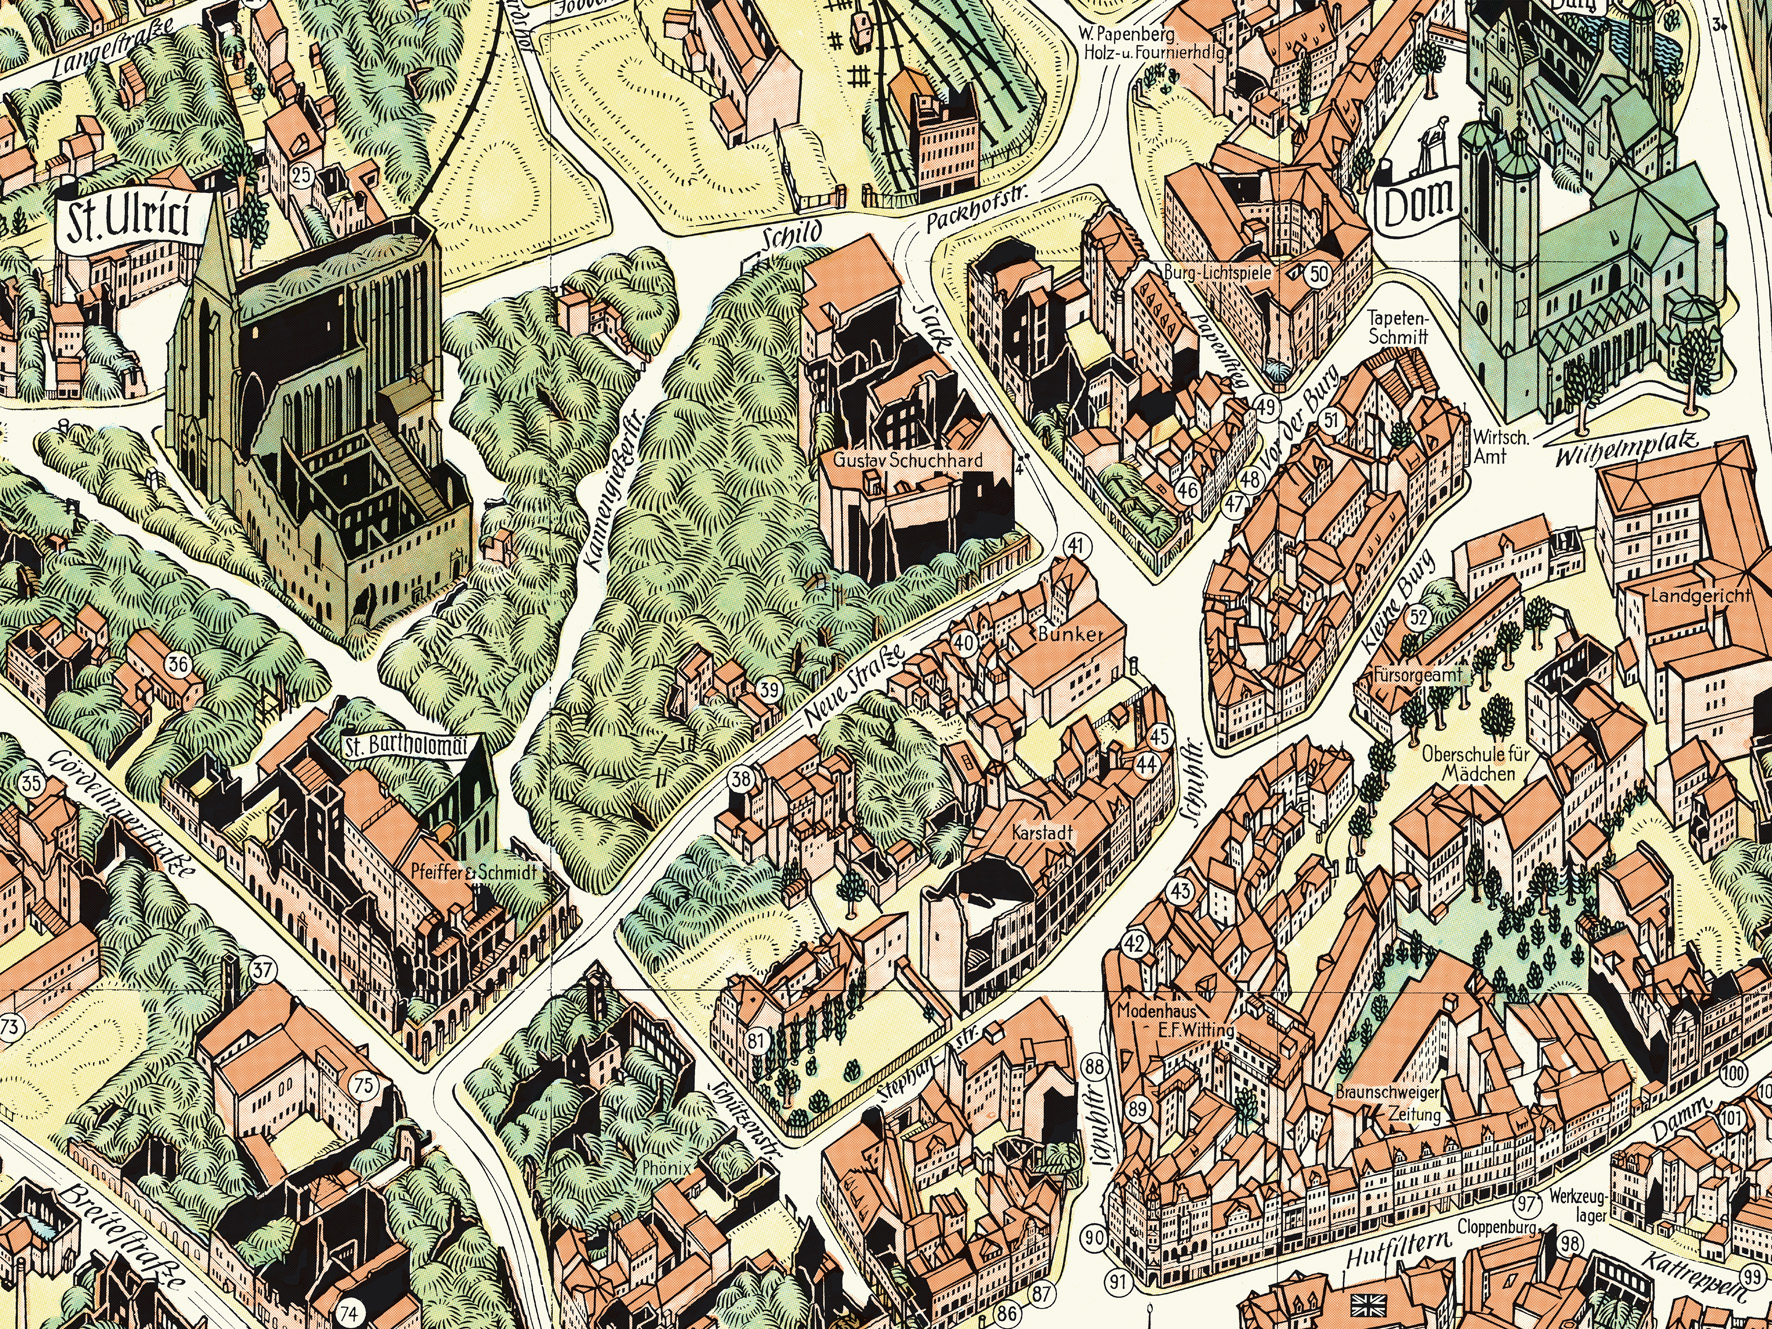
Map number one: Braunschweig, 1948. The complete map and a detail.

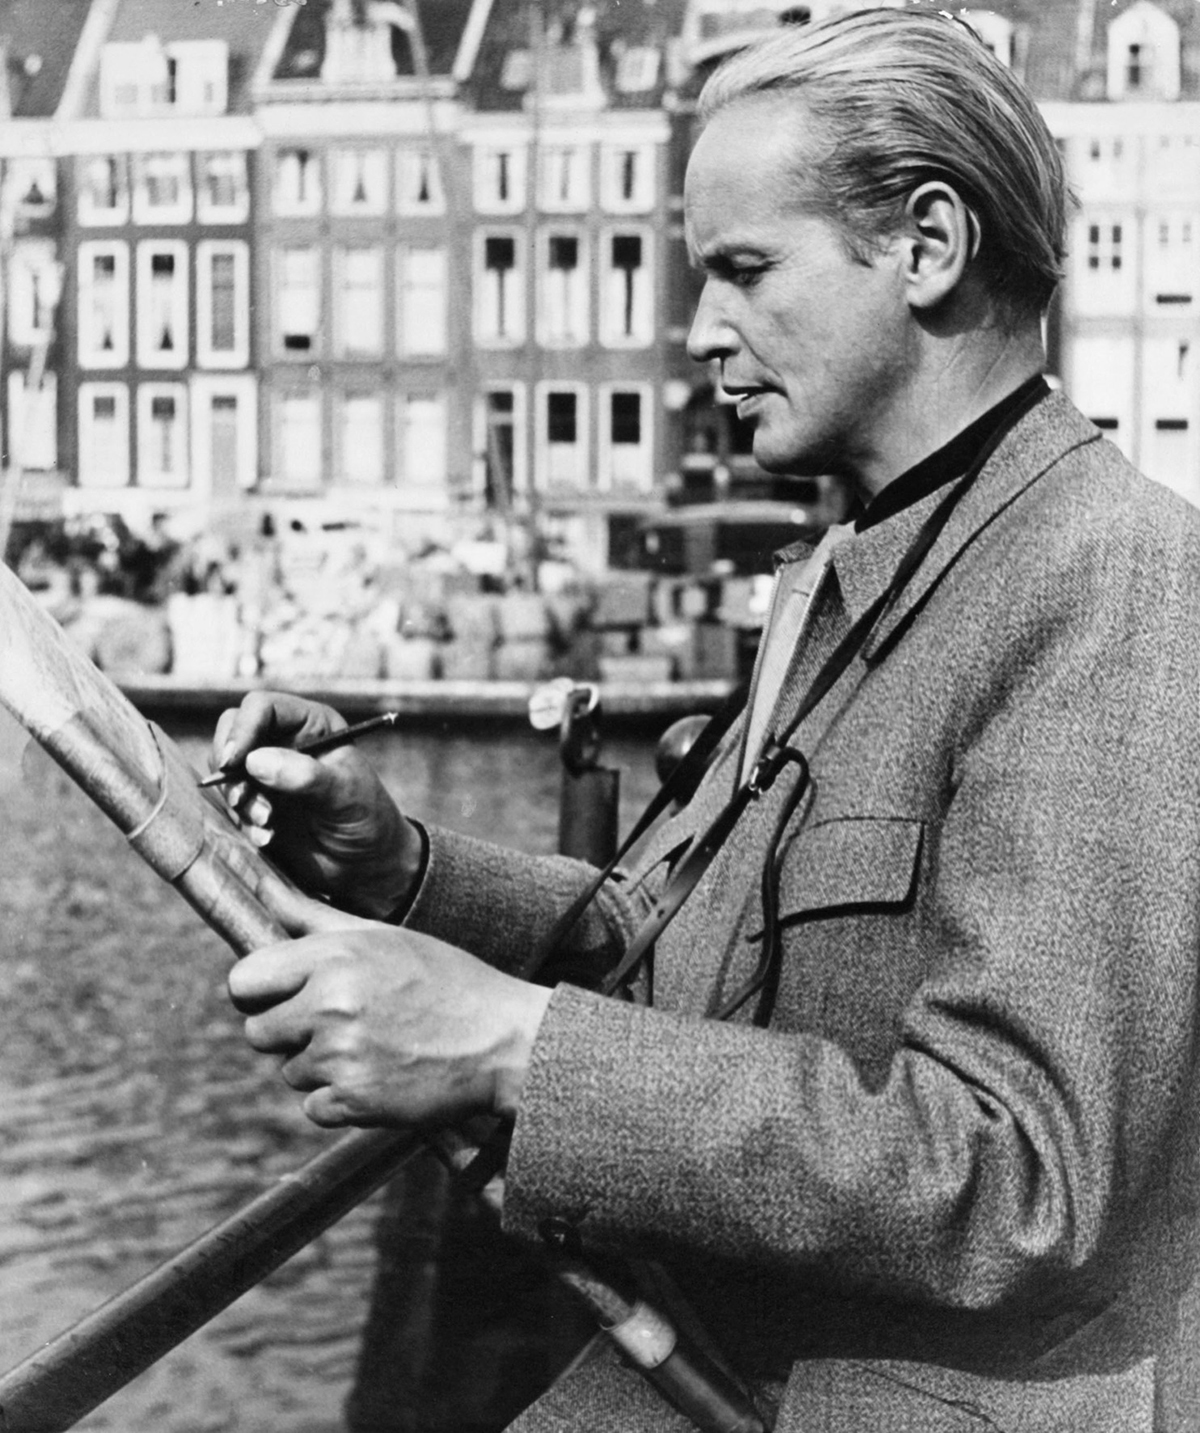
Hermann sketching on location.

The original Street View
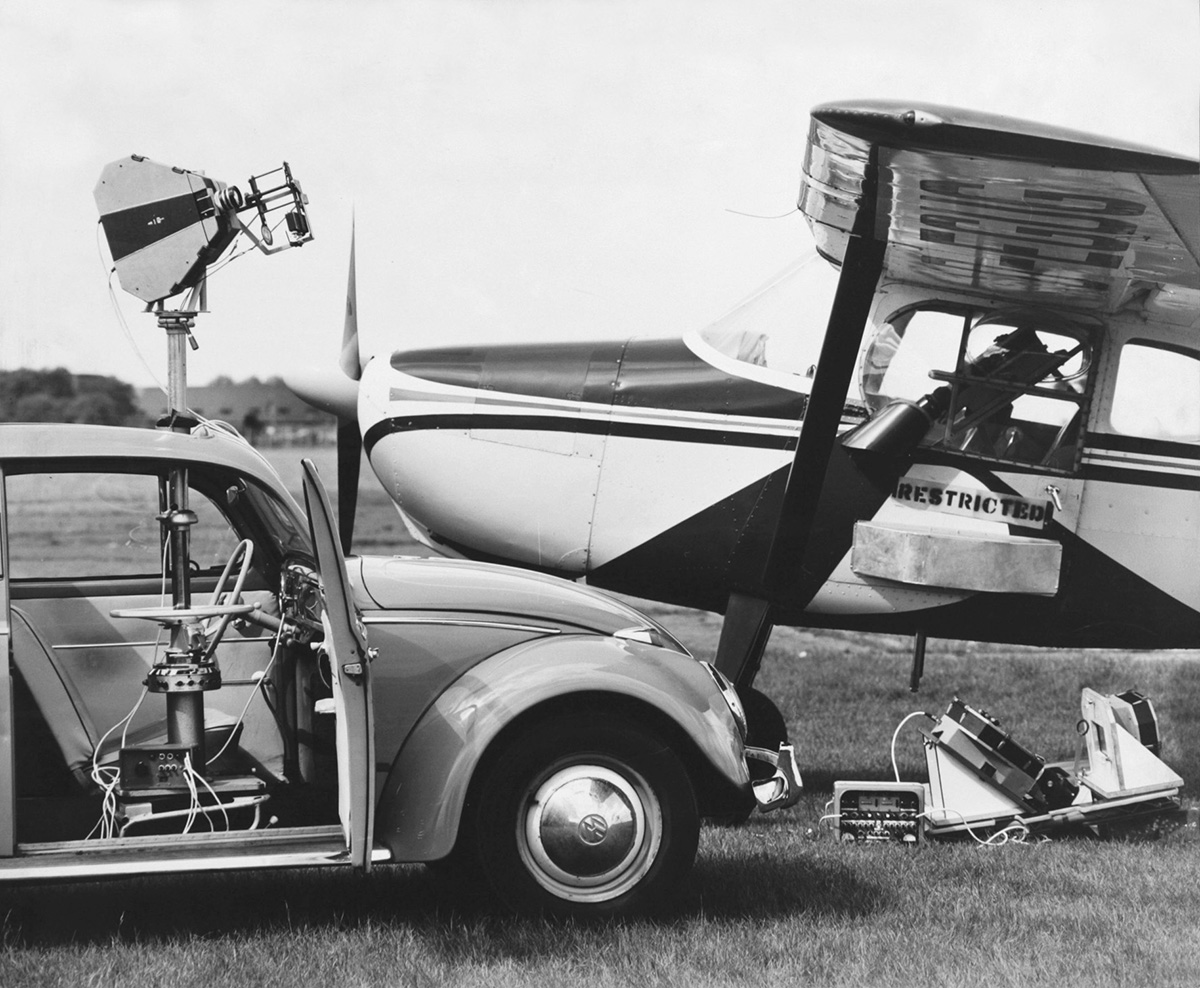
In 1958, Hermann bought a Volkswagen taxi that he fitted with a camera, raised on a pole through the sunroof, and triggered by the revolution of the wheels so that it took a photo every 65 feet (20 meters). Now a modern small car (with a sunroof) is used.

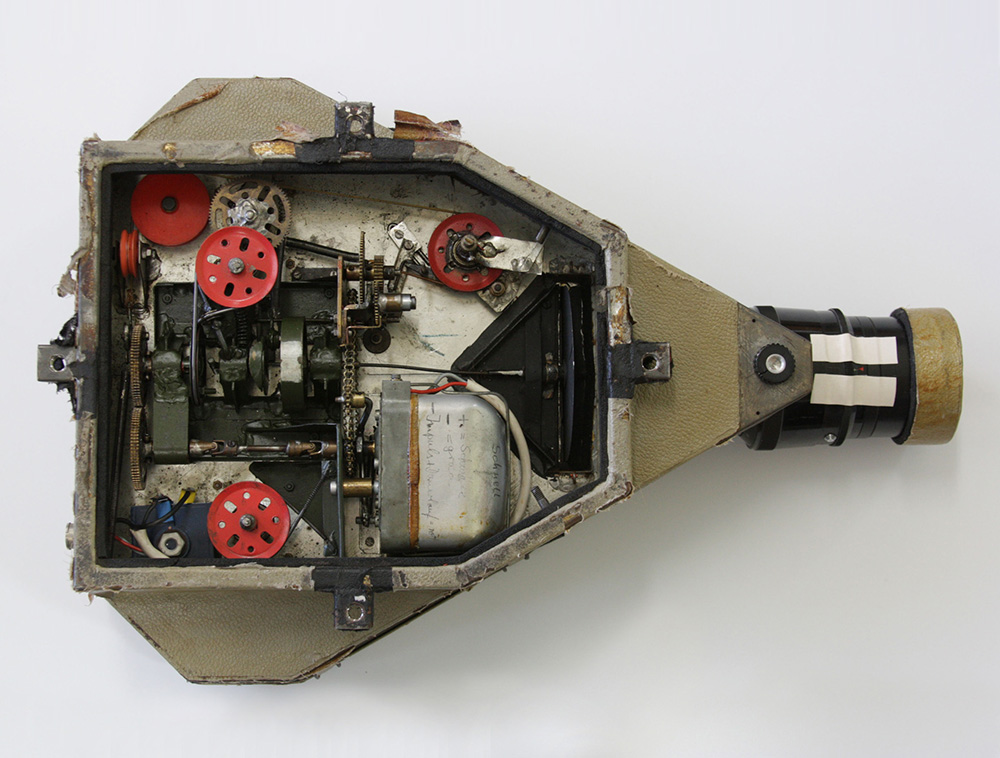
Below, the original aircraft camera with it’s model construction kit parts.

In the air and on the ground
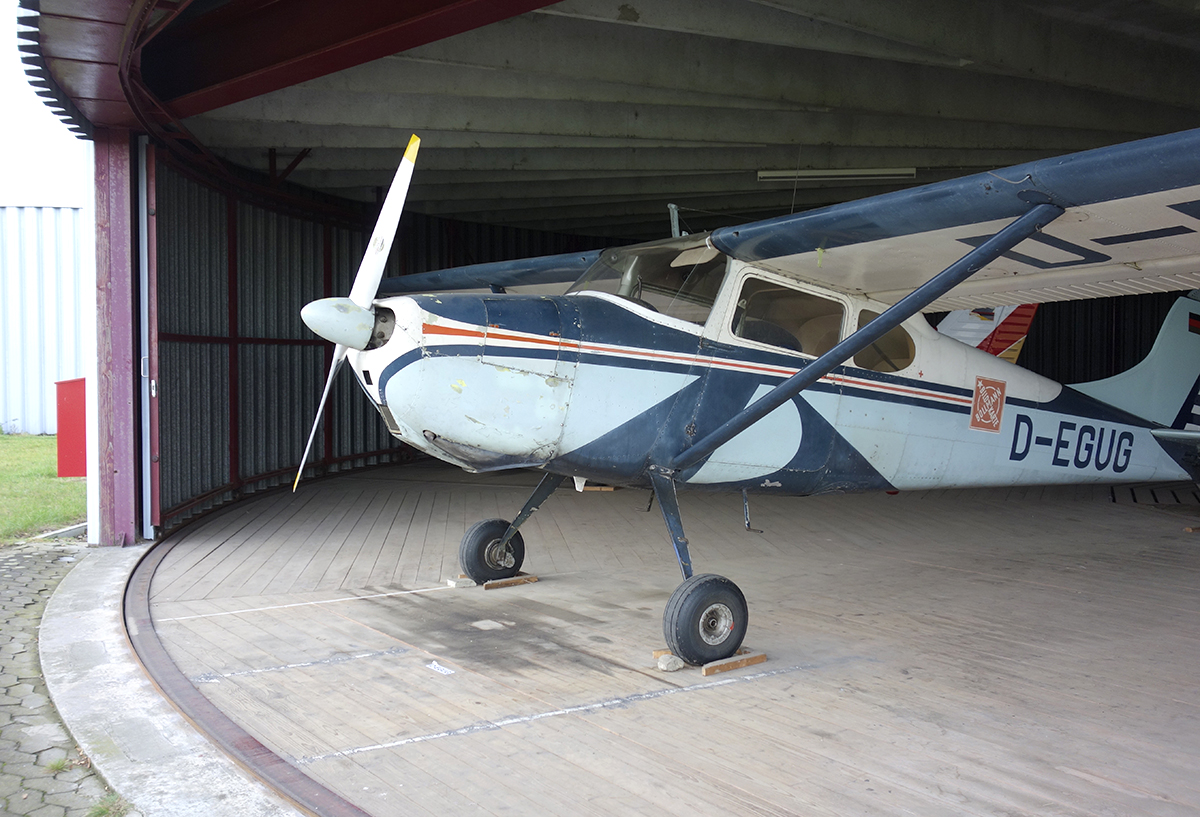
I sat in the Bollmann aircraft (shown above). A 1954 Cessna 170B that was also purchased in 1958, and is used to this day for aerial reference, and now flown by Sven. The instrumentation has never been changed, although they’ve added a radio and a transponder. It’s a three-faceted reference-gathering operation. The artists walk the streets making visual notes, with a pencil on paper, a car drives around with a camera taking continual photographs, and the plane flies overhead taking images at the angle of the illustrated maps. This combination leads to a unmatched level of mapping accuracy. As anyone who has used Google Street View for reference knows, the dates of the images are very variable, and there can often be buses, trucks and other objects blocking the view. The Bollmann approach means that they are not dependent on anyone else. In our world of infographics that are too often based on an internet search (for various complicated reasons), the integrity of their information is complete. They can approach any project with complete confidence that it is correct, and their reputation is built on that.

A detail from the Cologne (Köln) map.

To be continued in the next post…


(All map images © Bollmann Bildkarten. All photographs by Bollmann Bildkarten, or Michael Stoll.)

Instructional

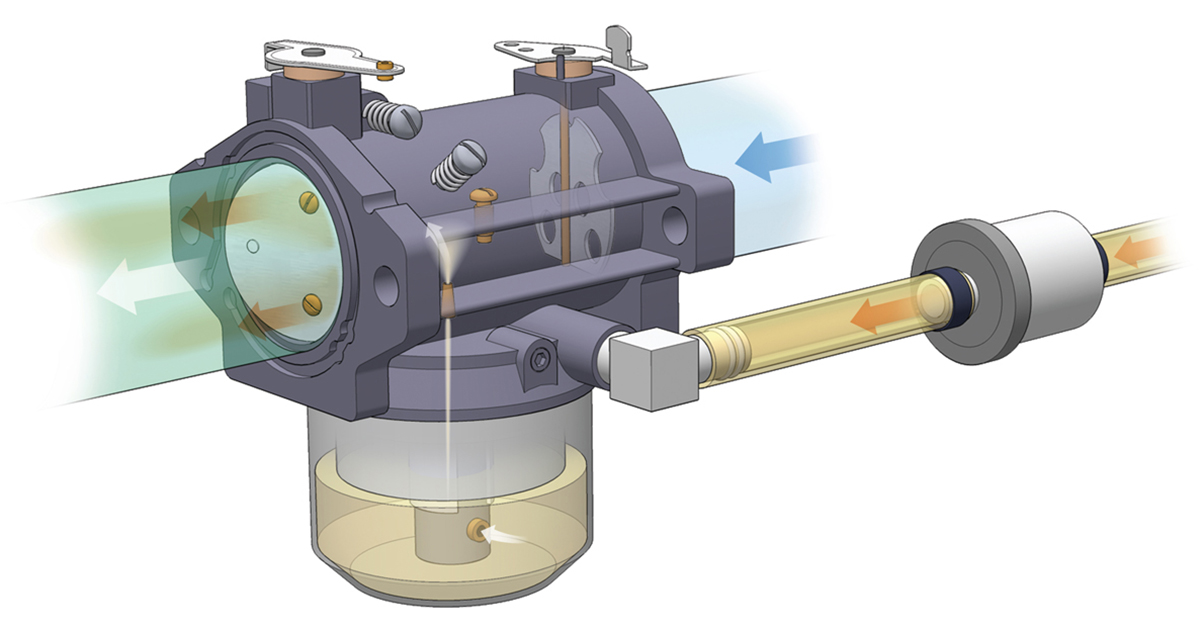
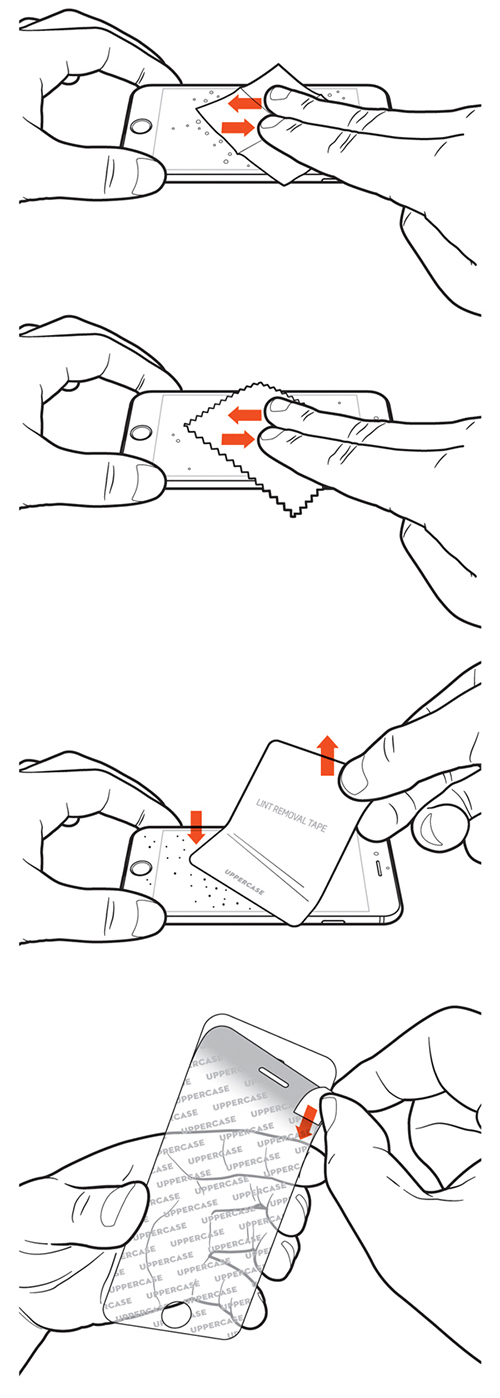
GREG MAXSON’S EXPLANATORY GRAPHICS.When I was the consulting graphics director for Popular Science back in the 1990s, I commissioned Greg to produce many diagrams. Like me, he began in the world of analog graphics, working with technical draughtsman tools, and by the 90s was, of course, working on the computer. Here are some examples of his precise, clear style. These instructional graphics help us with our day-to-day life, and deserve as much respect as the mega-graphics that frequently sweep up the prizes. See more of Greg’s work here: https://gregmaxson.com
An example below of one of Greg’s pre-computer graphics. This style was perfect for the transition to computer-based illustration.


The examples below are all digital.

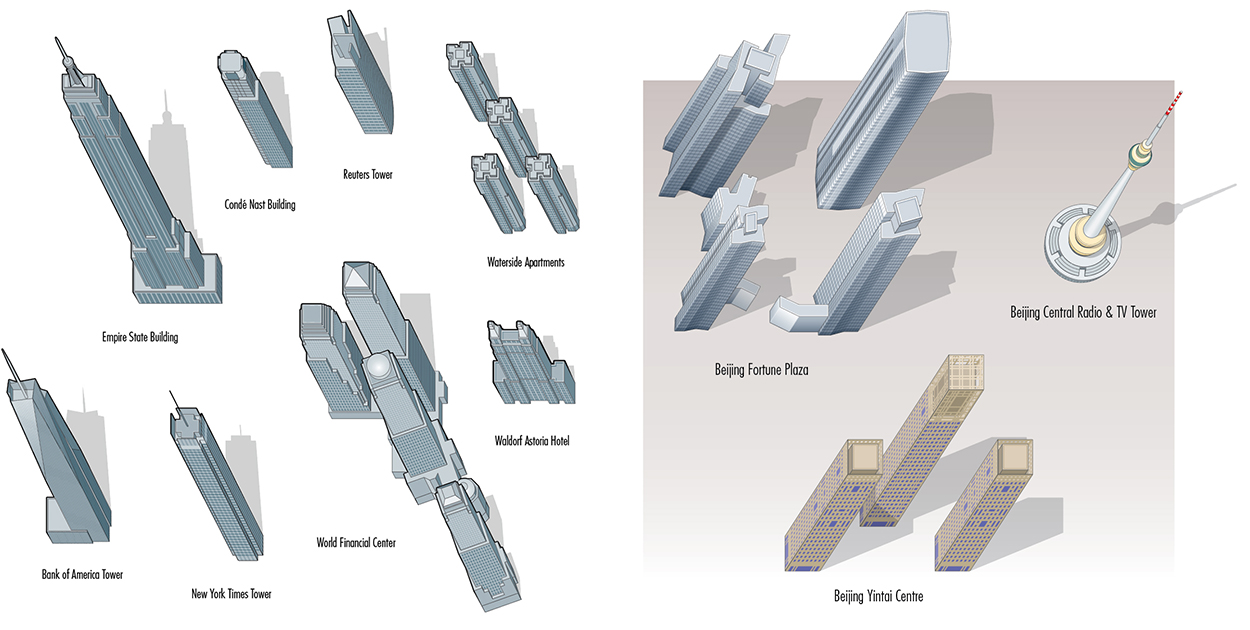
Greg has drawn hundreds of buildings for VanDam’s excellent series of maps. Some examples:

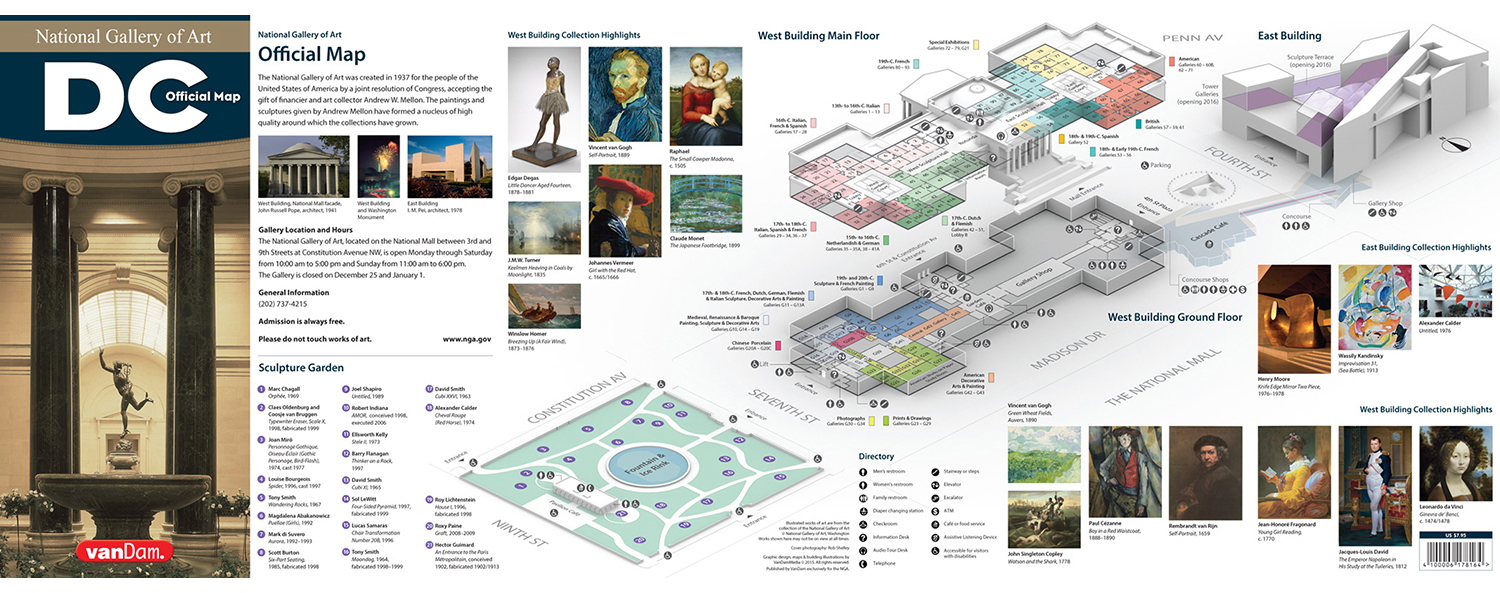
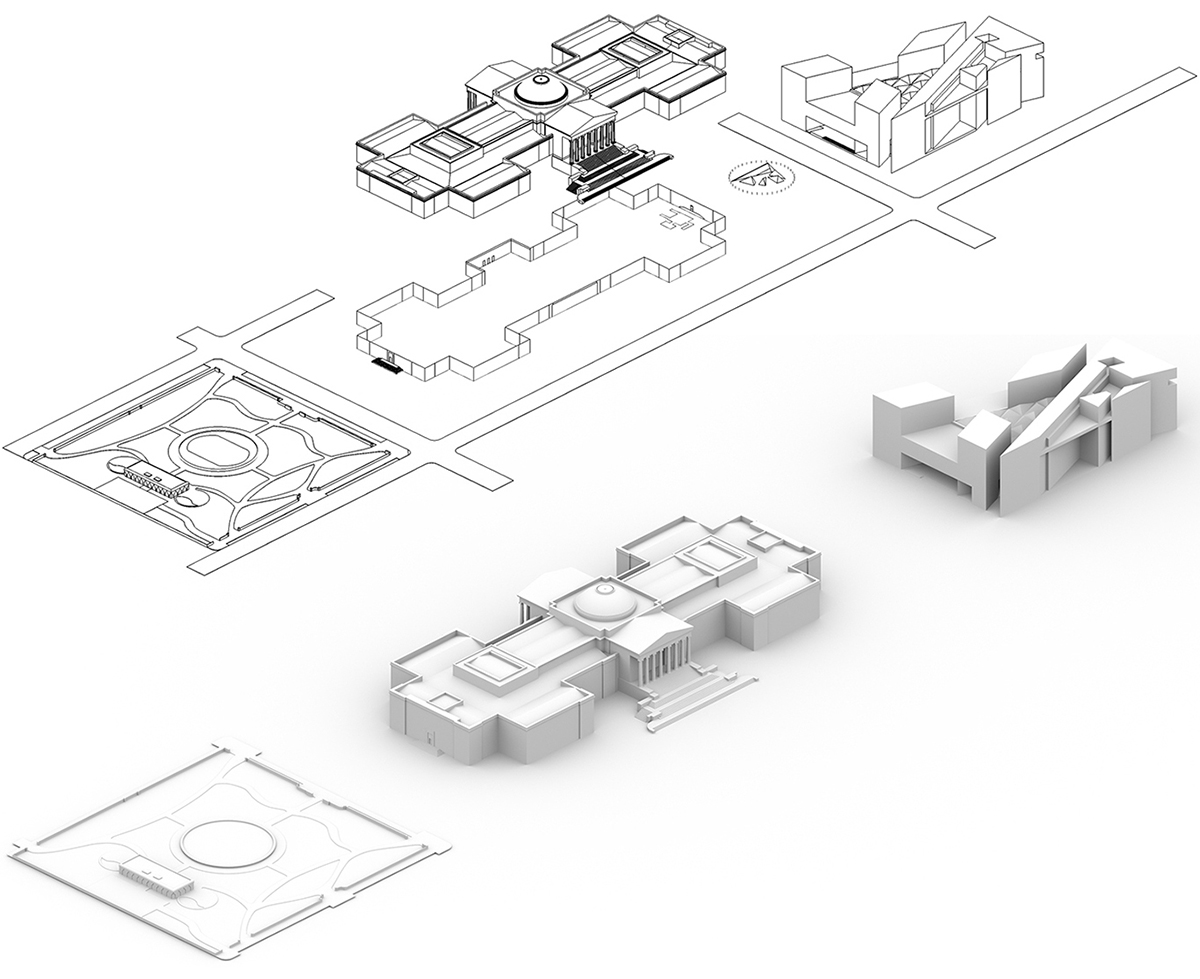
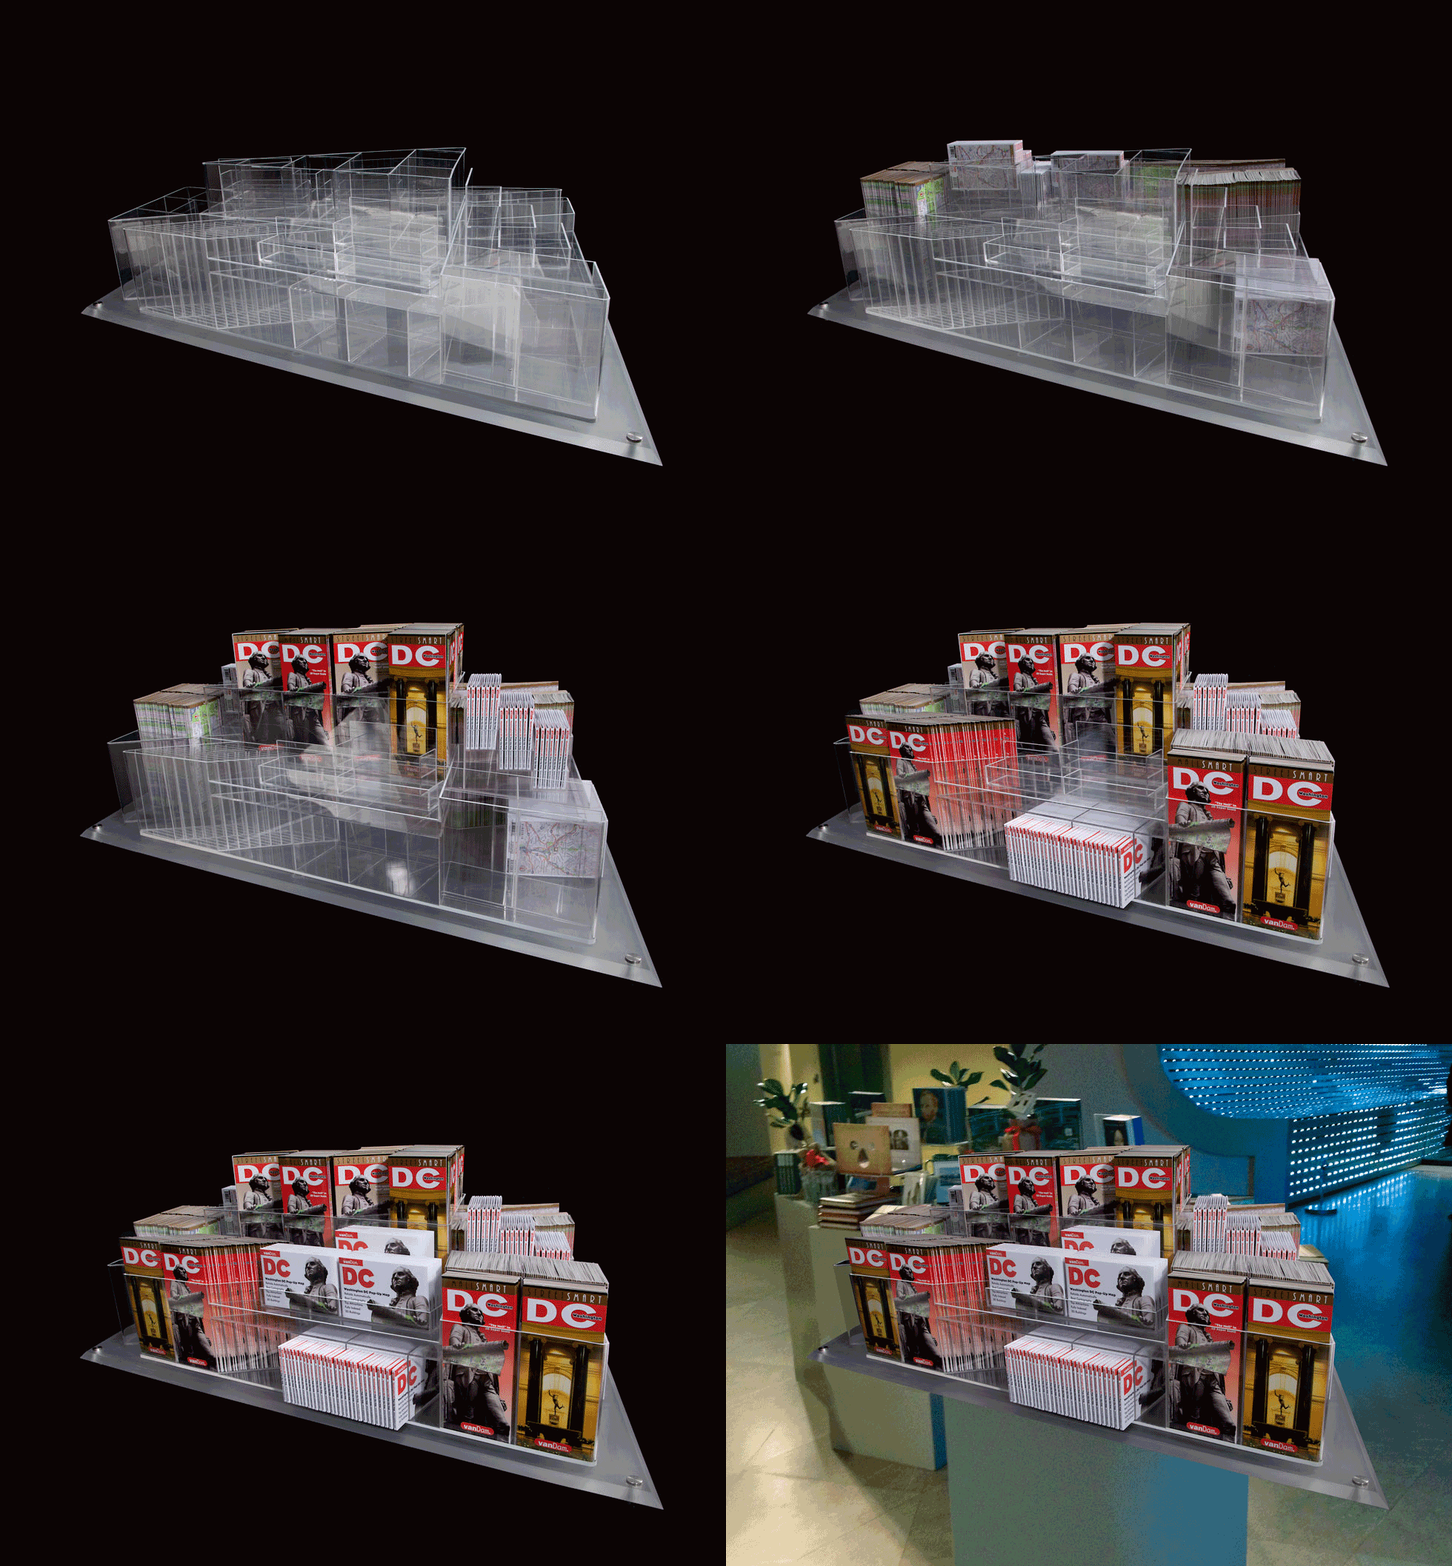
Stephan Van Dam was approached by the National Gallery of Art to create a map (for the 75th anniversary of the museum), and to build a miniature version of the East Wing as a display case. Stephan and his team collaborated with Greg on the project.

The SketchUp model, and a Shaderlight rendering for the map.

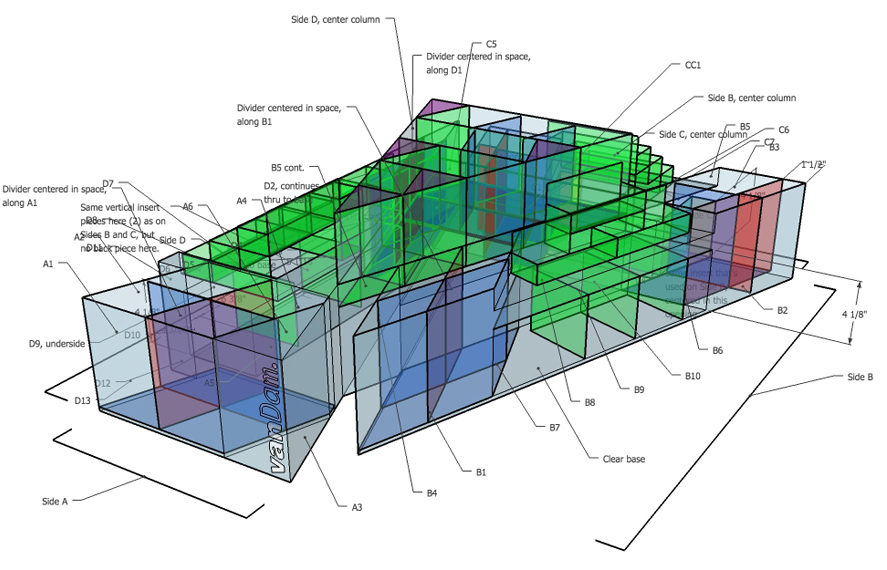
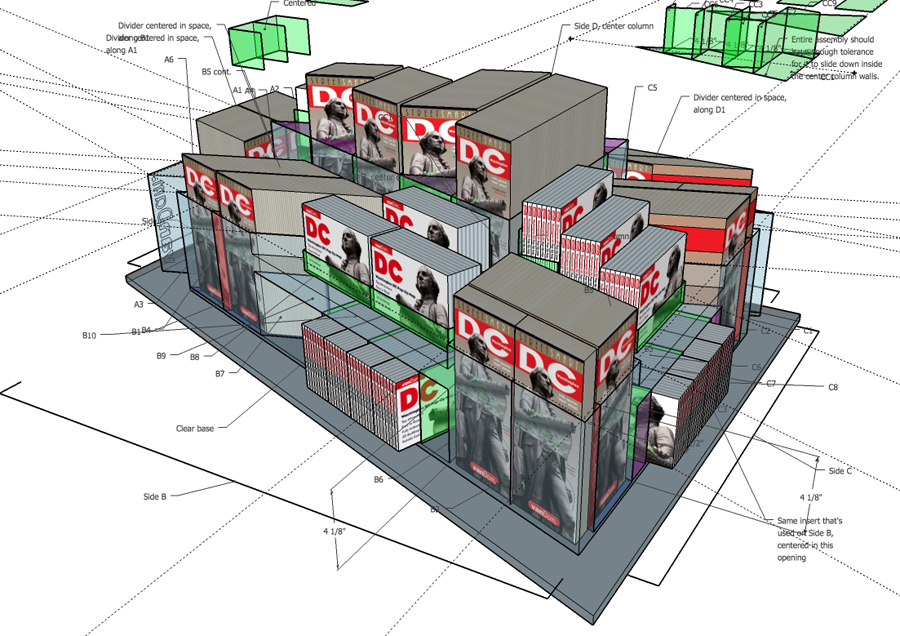
The team studied the East Wing, and determined the best way to reflect the architecture in a lucite case that would hold the maps. Using SketchUp, Greg created a 3D model of the shell. Then the dividers and pockets were designed.

Making the complex case, with it’s sharp 18-degree corners was a real challenge. Stephan wasn’t able to find a model manufacturer in the U.S., but eventually a Shanghai-based shop agreed to construct it.

See the range of VanDam maps, and buy them, here: http://www.vandam.com

(All map, building & display images ©VanDamMedia. All rights reserved.)

Mechanical

FROM OVERLAYS TO COLOR.

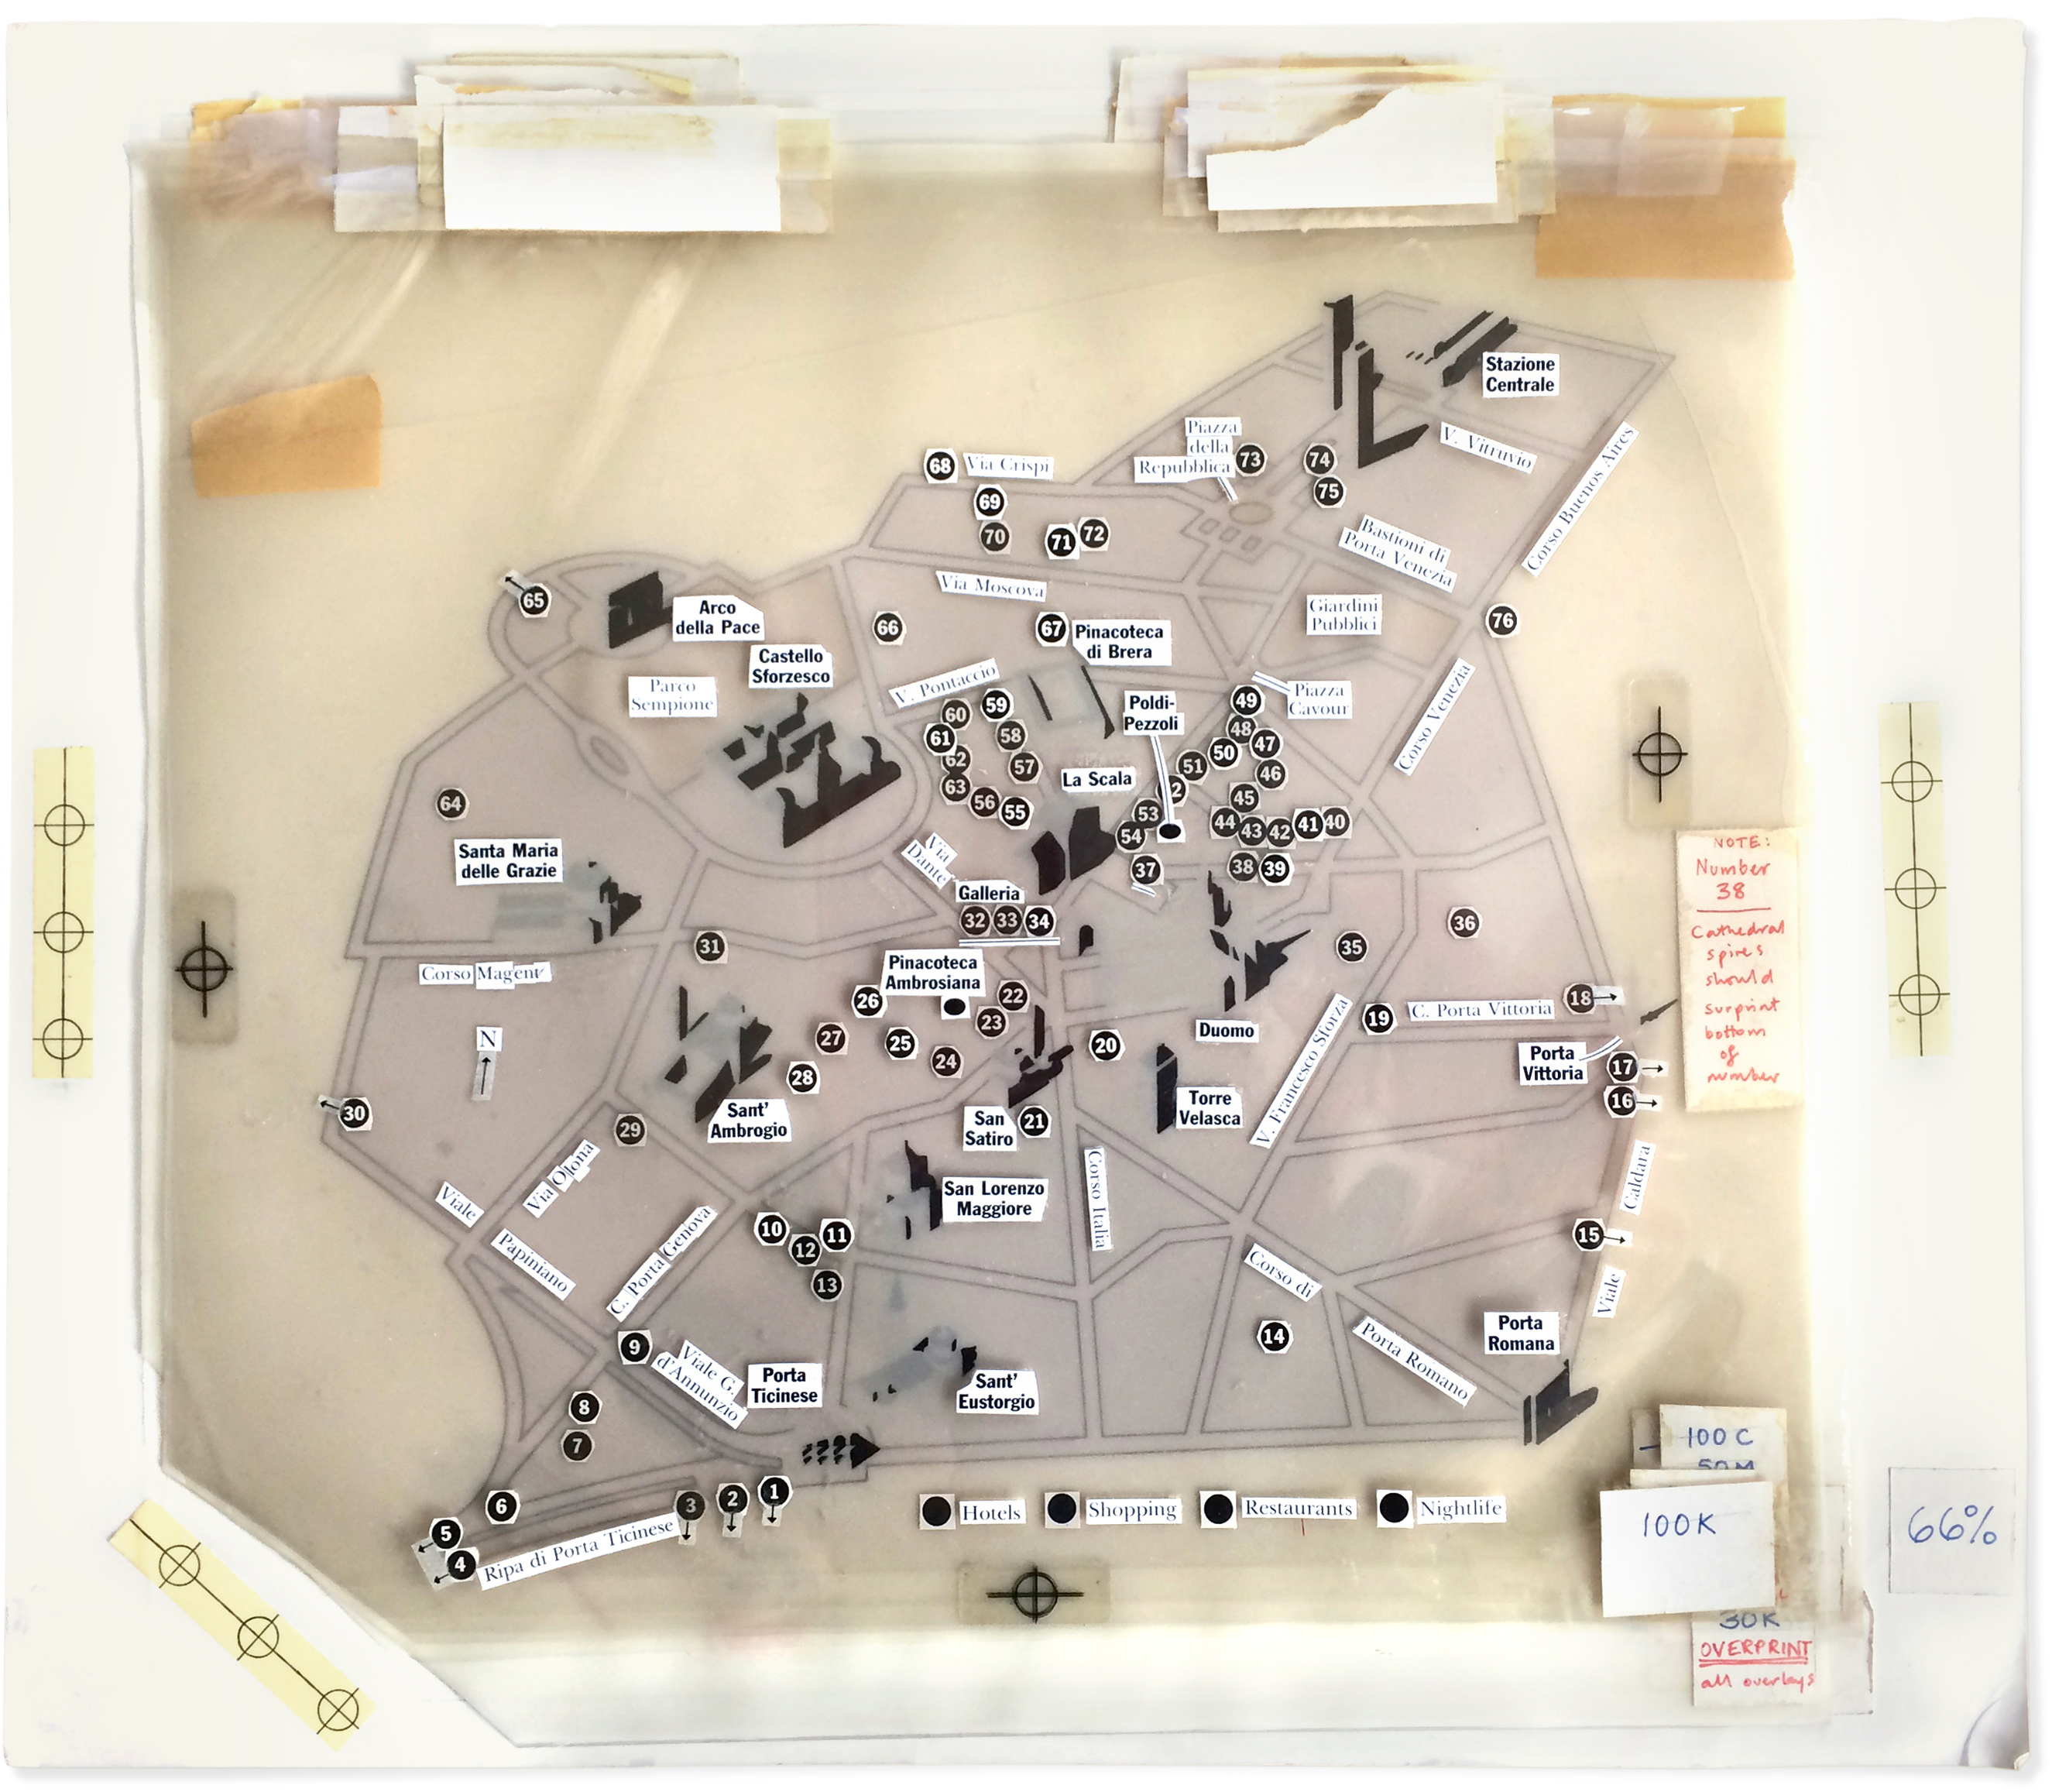
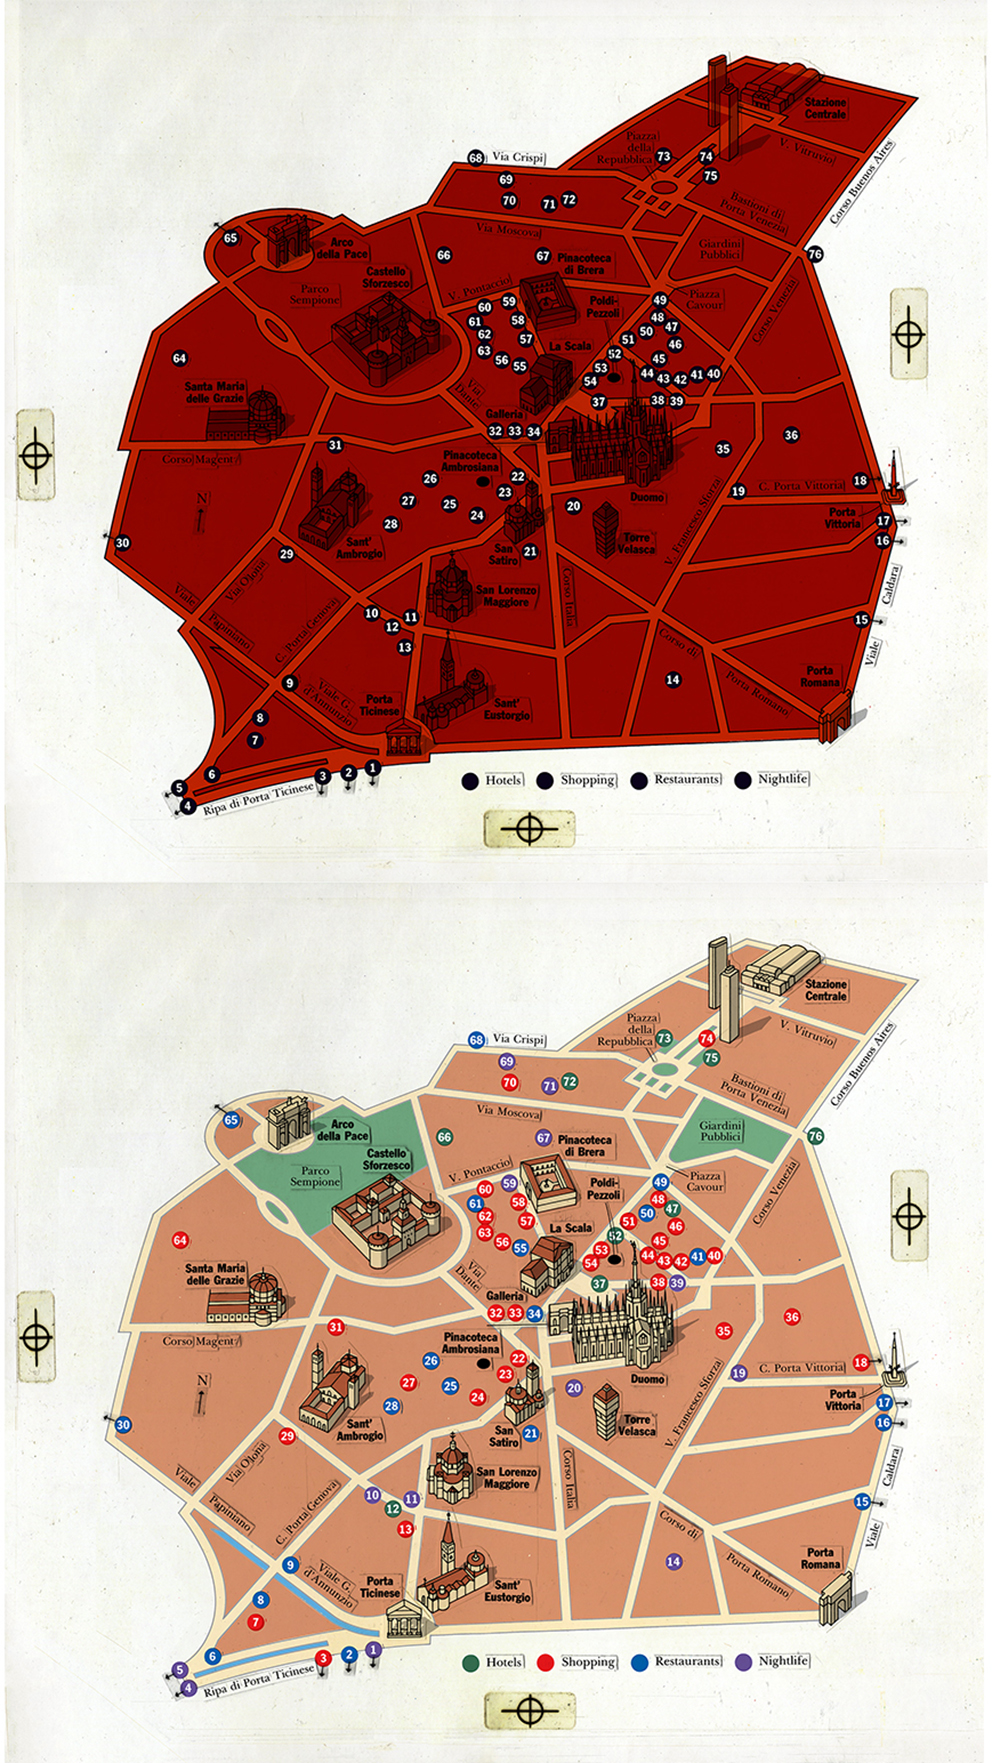
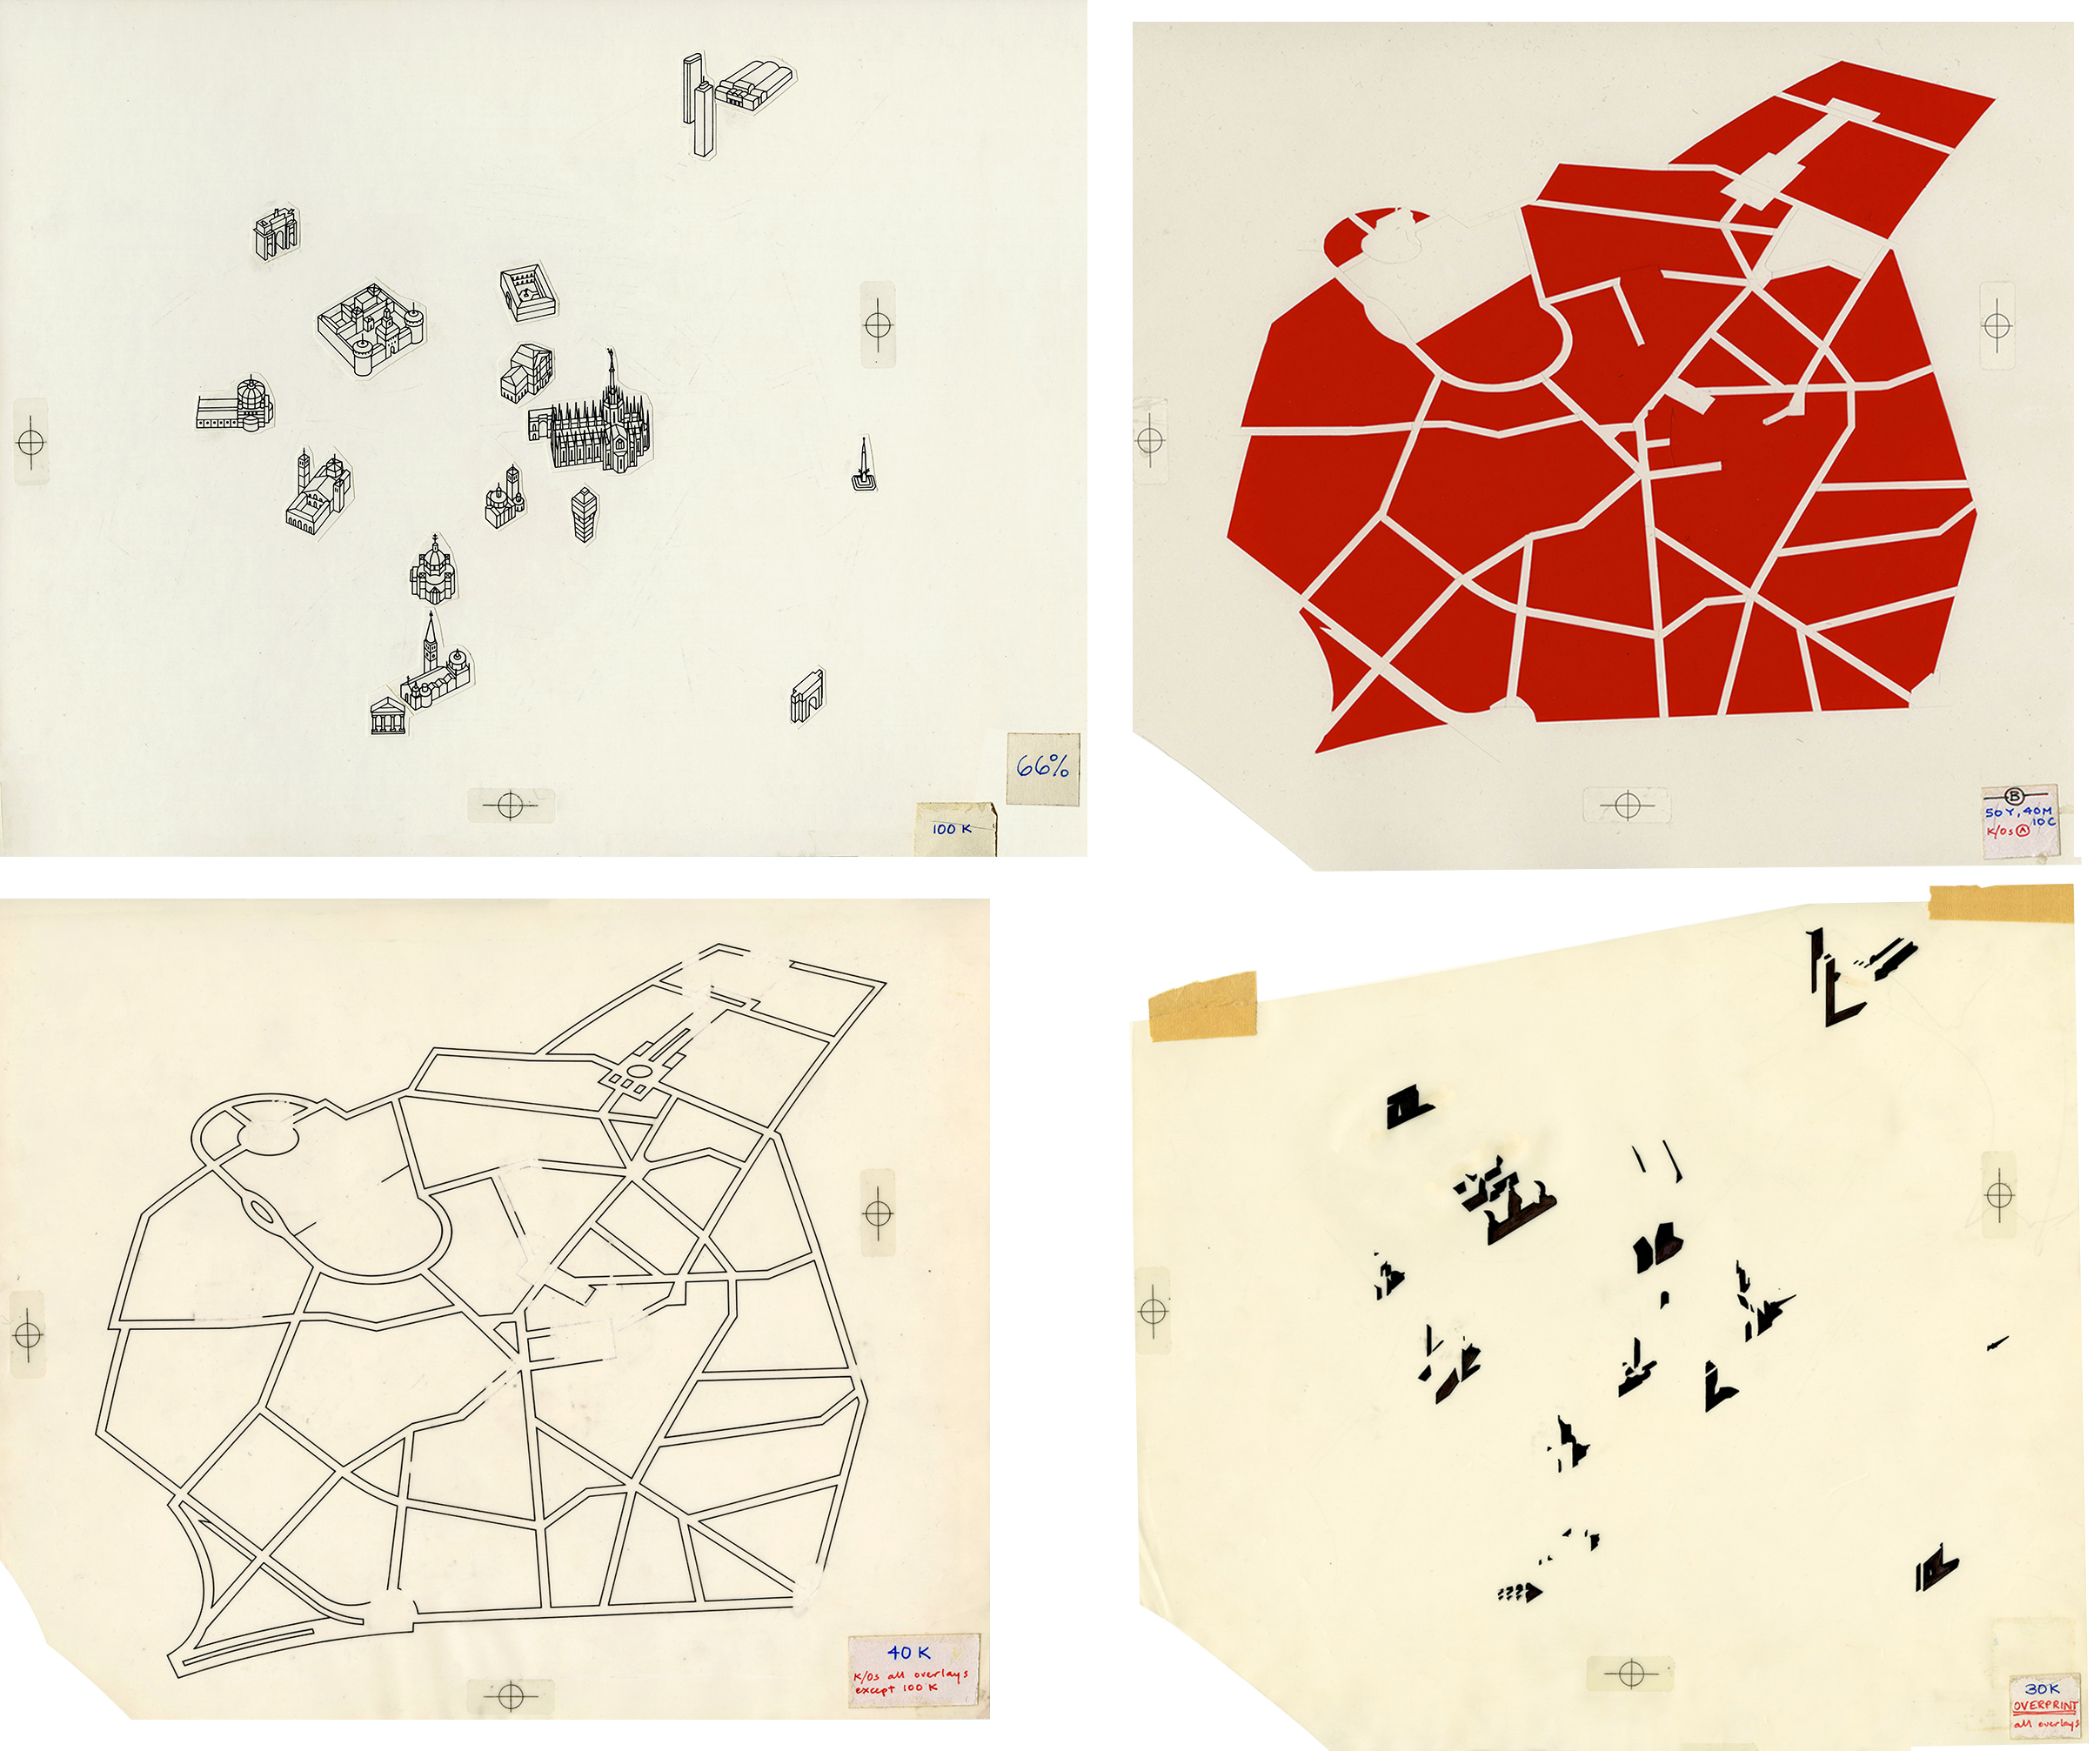
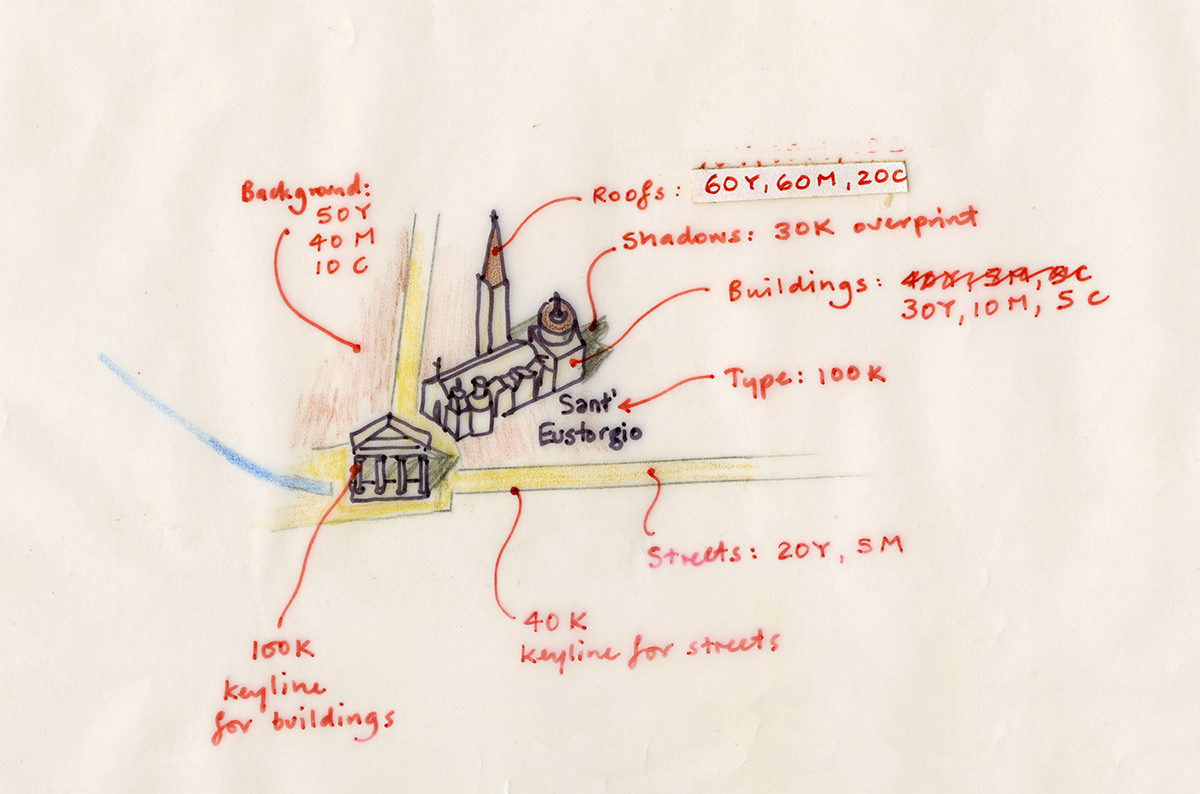
I’ve been looking at this somewhat battered (and not very attractive) Milan artwork of 1988 vintage. It’s going to be in my exhibition next month. (More about that event below.) This is what was known as a “mechanical.” An assembled piece of artwork that would be photographed and converted to a color separation. On top of the line art base, there are twelve overlays, plus a color pencil guide for the pre-press technician. Some layers are inked, some are cut from Rubylith film, with multiple knock outs and surprints. How this all came together to make four printing plates is one of the mysteries of the universe.

When I moved to the U.S in 1987, I was amazed that magazines would spend the money to go through this elaborate process. I mentioned mechanicals in a previous post: https://www.johngrimwade.com/blog/2016/09/26/when-infographic…roamed-the-earth/

Below is a composite scan of the mechanical layers, and the CMYK result after a lot of pre-press work. And I mean a lot.

Some of the layers, and the color guide.

It all worked somehow. From thirteen layers to the printed page. The presentation below might fit into the “gratuitous animation” category. If it does, apologies for that. I was just trying something.

See it in Munich A lot of my pre-computer artwork will be on show in Munich from March 9 to 11, at the EDCH and INCH conferences. I will also be giving one of the keynote presentations, and running a workshop.

Design conference: http://www.edch-conference.com

Infographics conferencehttp://www.inch-conference.com

Infographic workshop: http://www.inch-conference.com/en/workshops

The red line

FOLLOWING AN INFOGRAPHIC PATH.

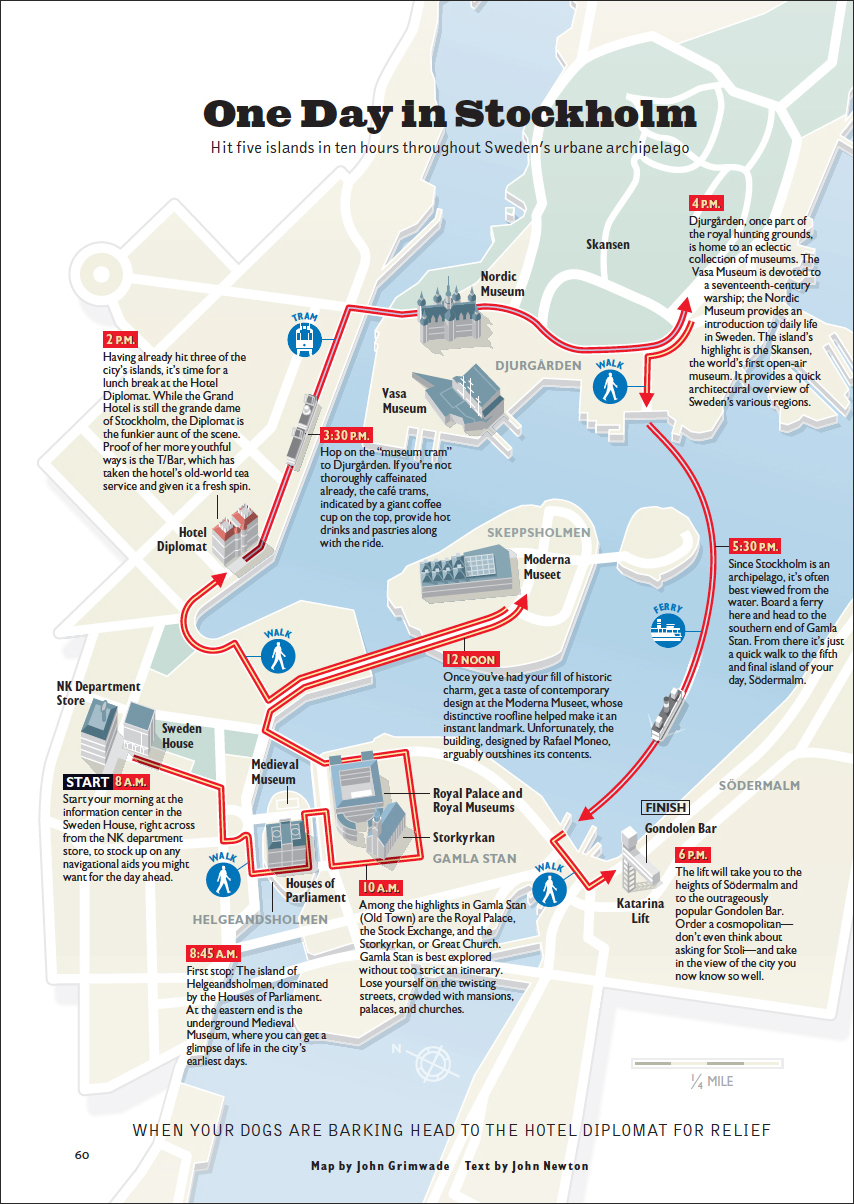
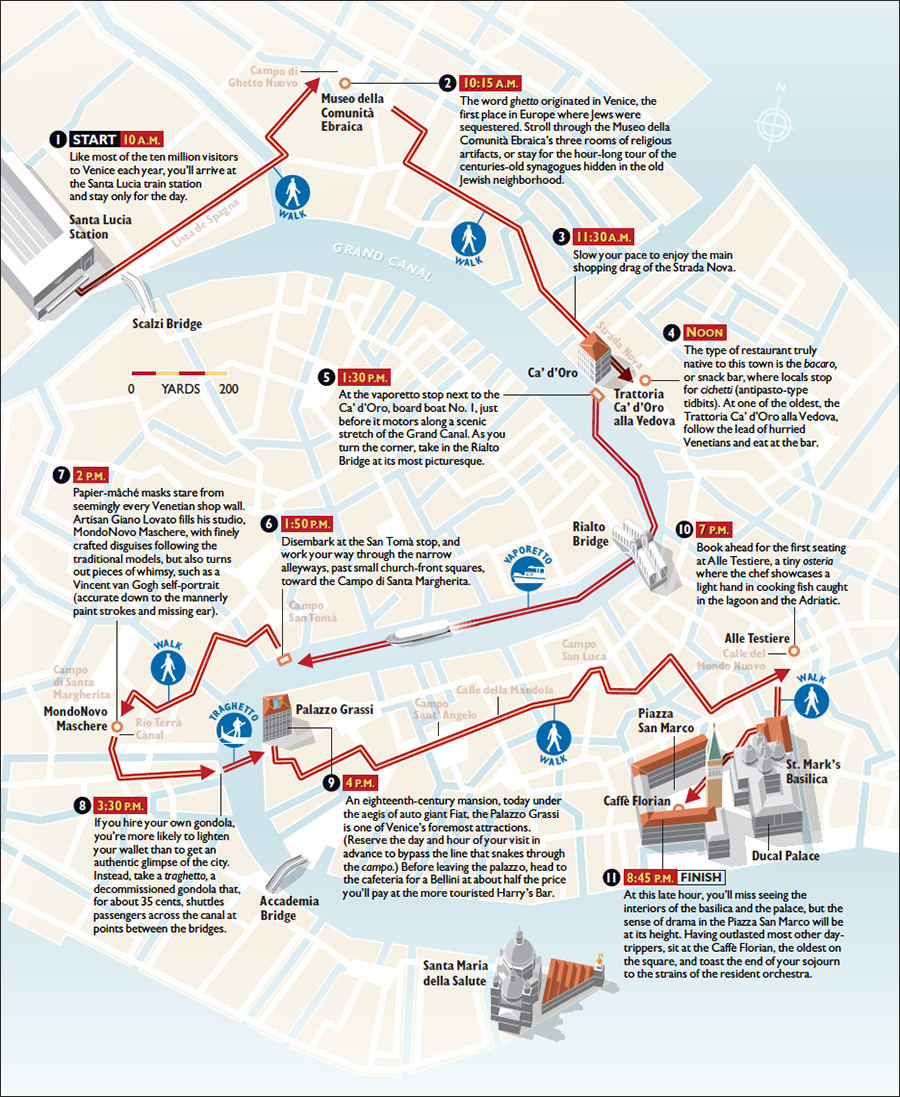
How do you make complex locations easier to navigate? At Condé Nast Traveler magazine we often gave our readers a fixed path, that was carefully chosen by our writers. The aim was to show the user, as clearly as possible, how to get to the selected highlights. Of course, this line didn’t need to be red (and often wasn’t), although red is good for grabbing attention. Remember that this was all before we could track our position accurately on smartphones. I’m not sure that location technology renders this kind of presentation obsolete, although it could definitely augment it.

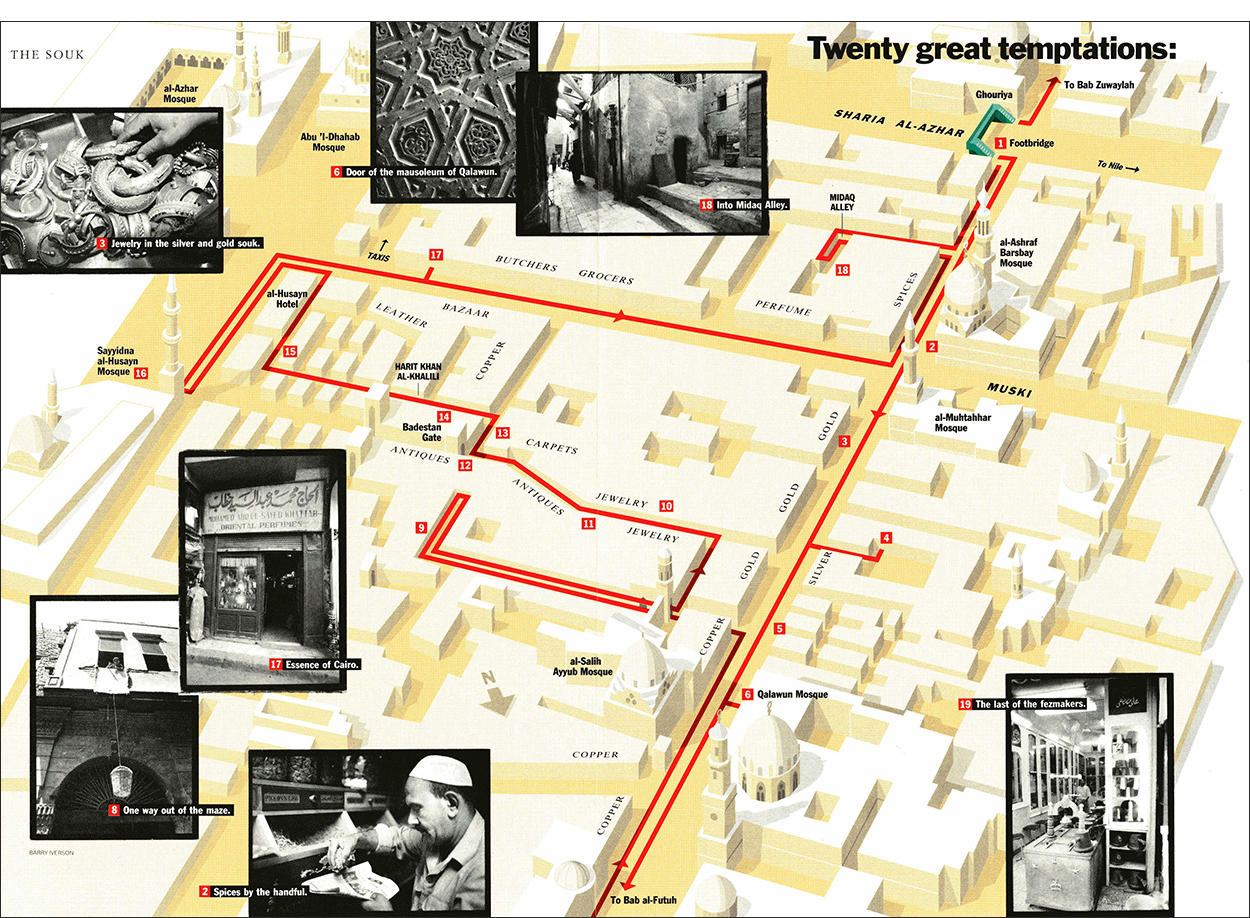
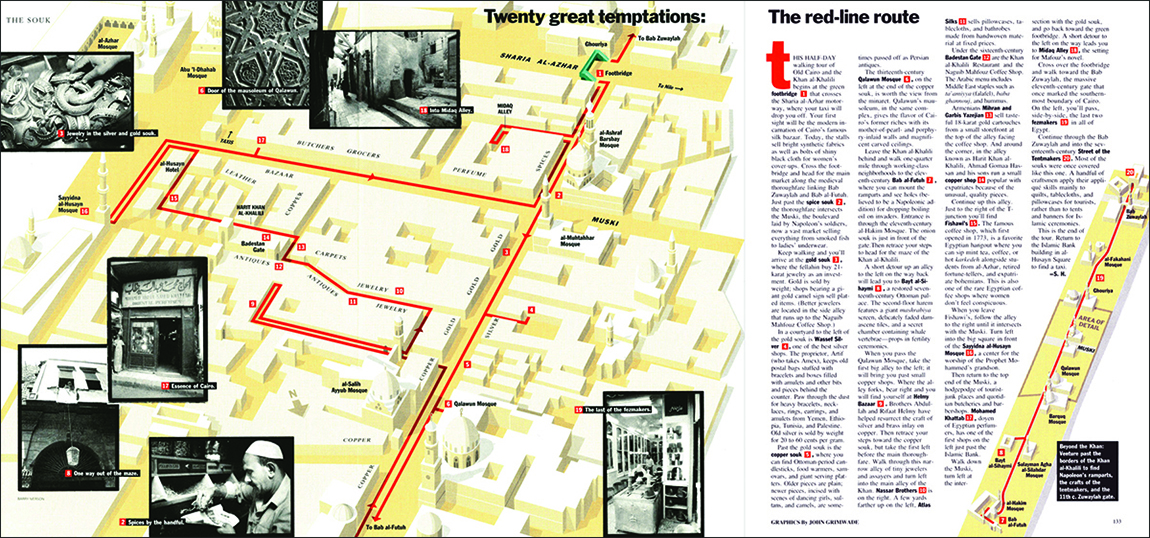
Cairo’s Khan-al-Khalili souk is a challenging, but rewarding, place to visit. Very crowded, and not easy to see where to go next. We felt that the red line could really help here. The text starts with an instruction to look for the green pedestrian bridge, so I the only place in the graphic that I used green is there. Monochrome photographs separate strongly from the color of the map.

The complete gatefold is shown below.

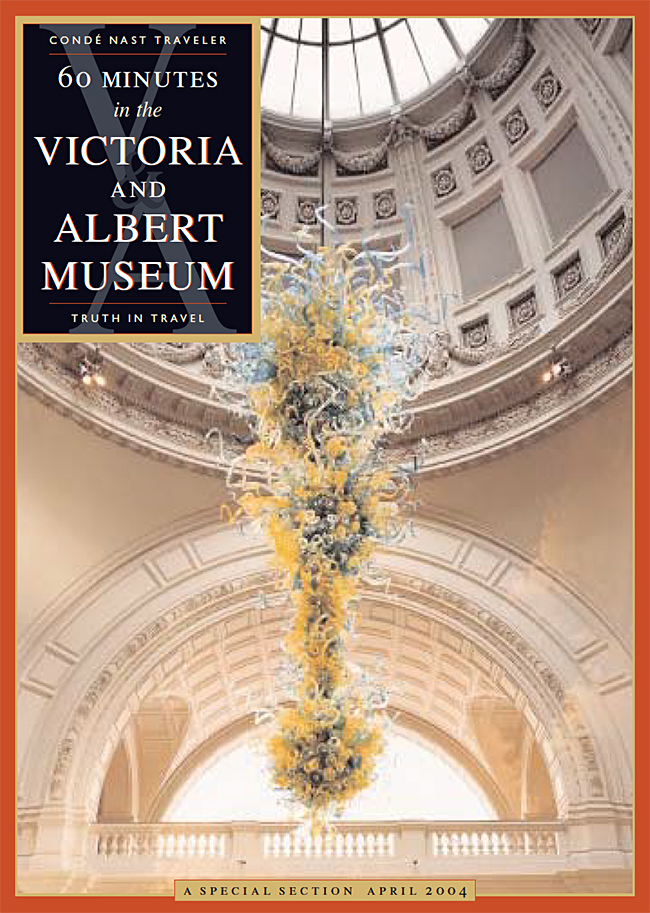
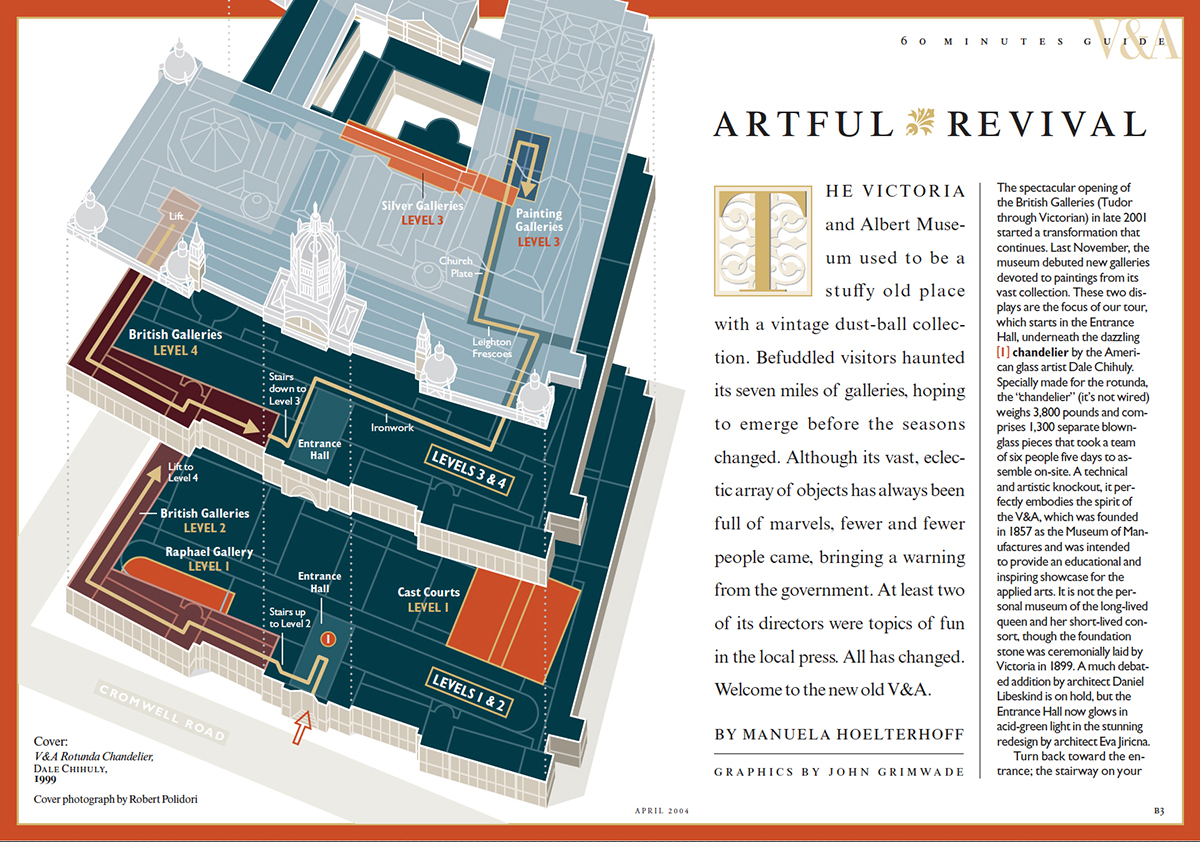
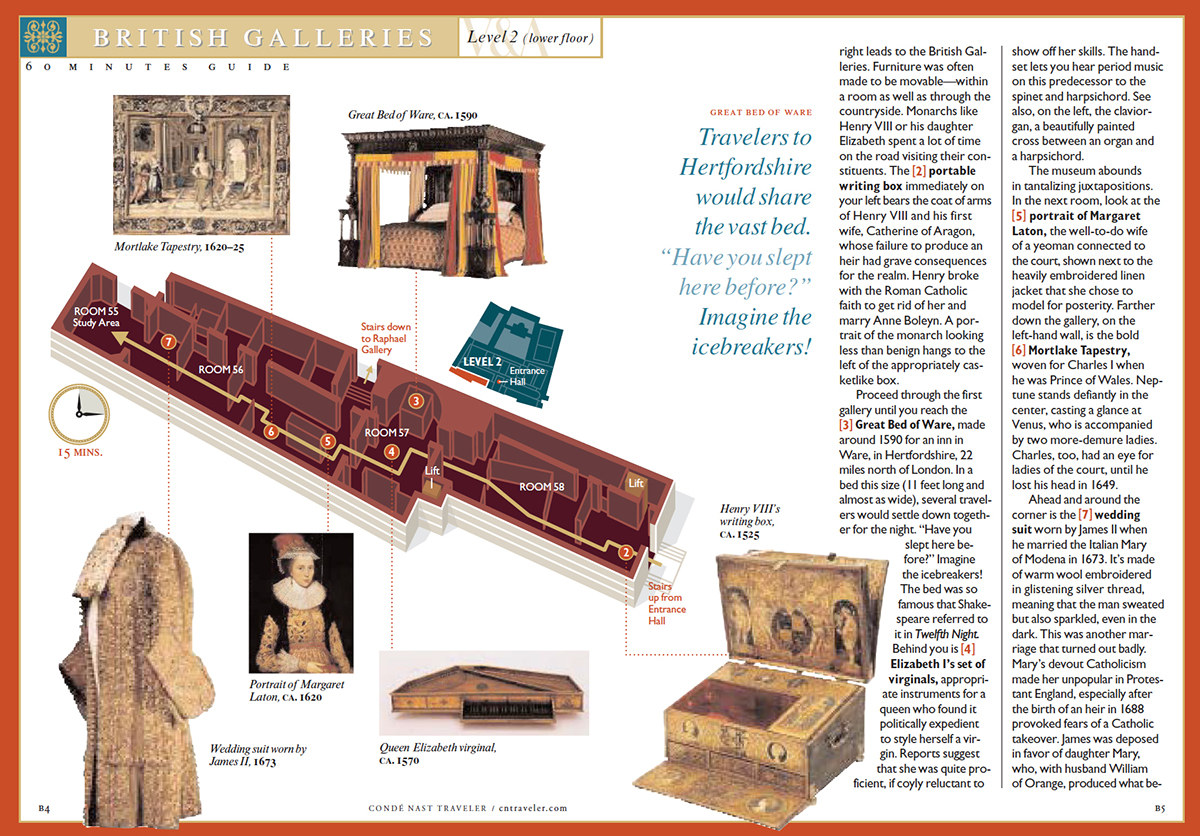
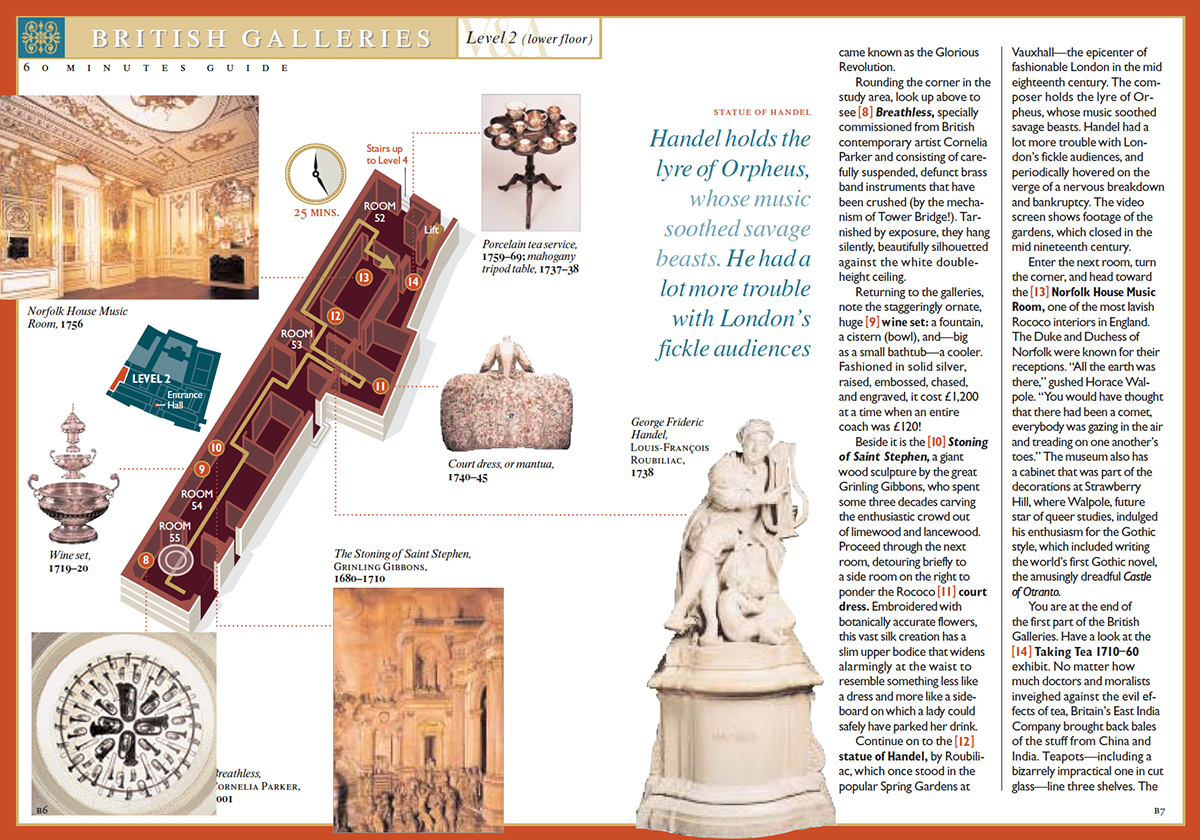
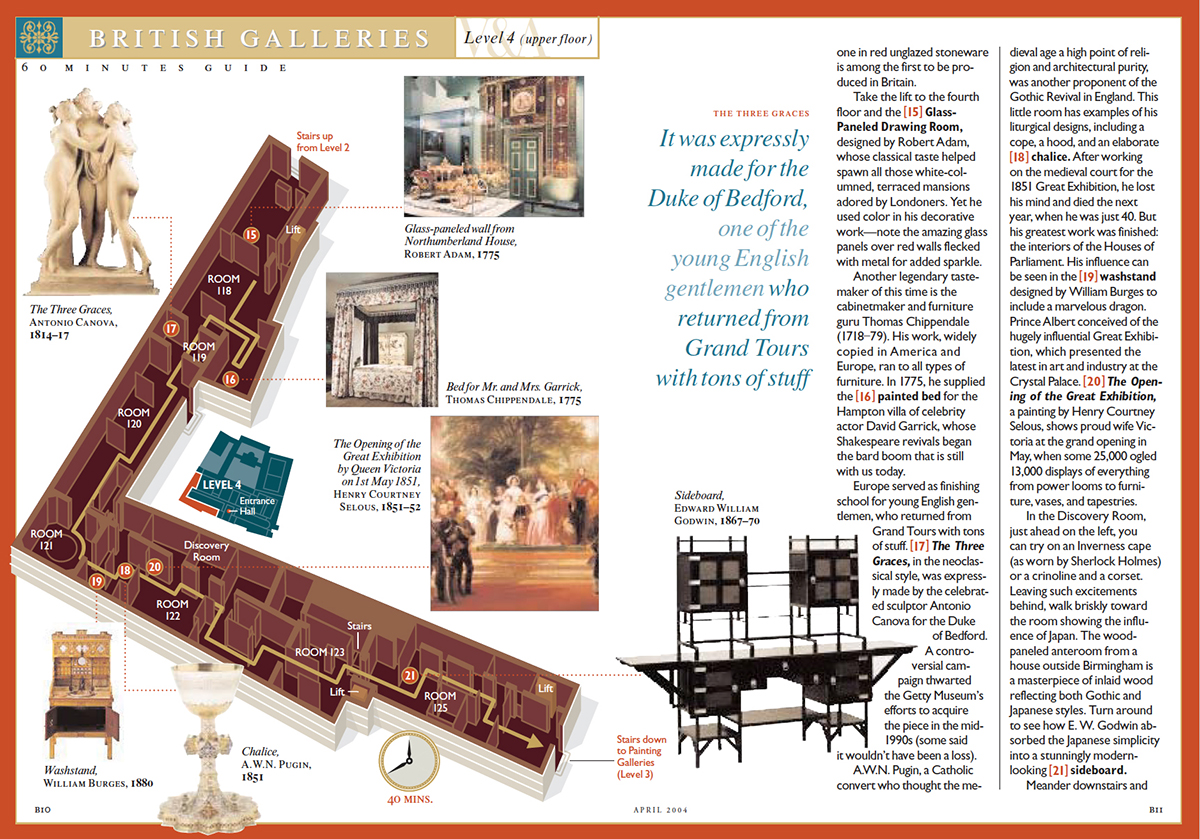
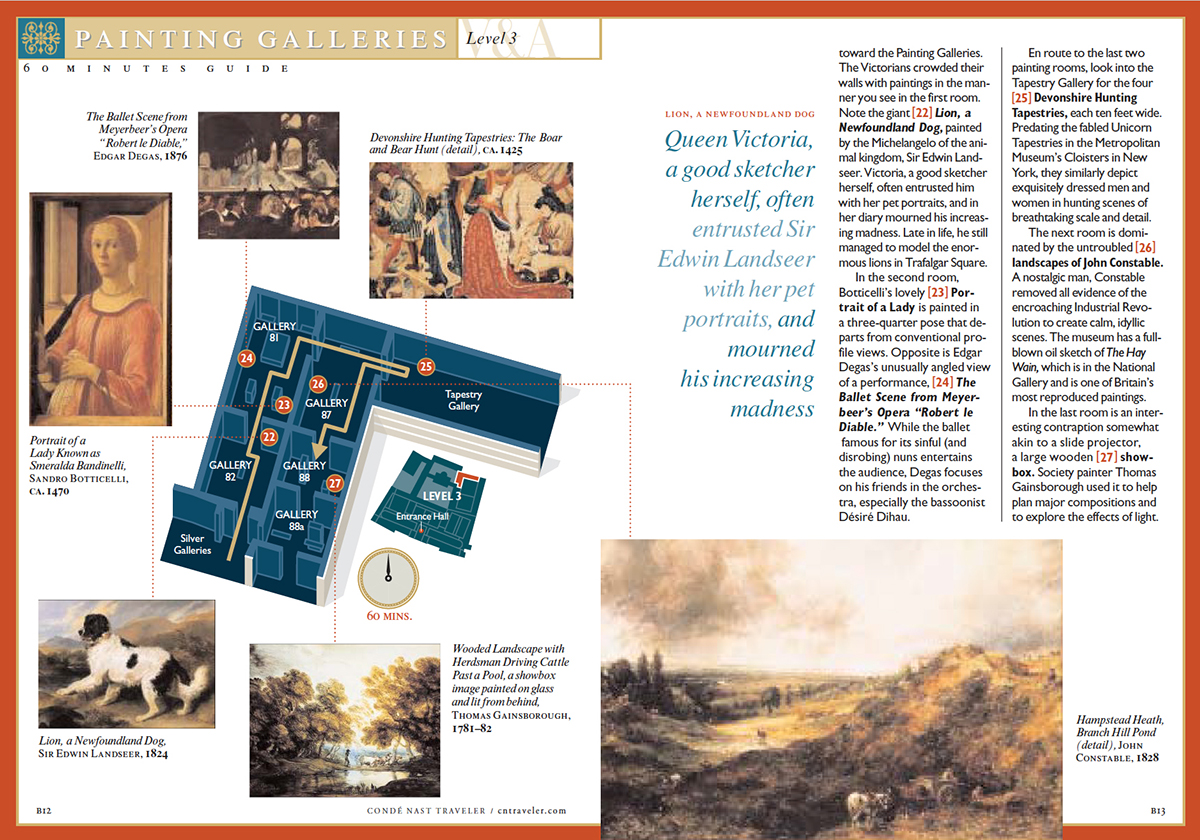
The Victoria and Albert Museum in London is a maze of levels and additions, containing millions of objects in 145 galleries, and it is consequently quite difficult to find your way around. So this little booklet was very popular. Brilliantly written by Manuela Hoelterhoff, who also selected the essential exhibits. You would have to keep up a very brisk pace to get round this track in 60 minutes, but the title is fun, like the text, and is really an attention-grabber. (It was part of a series that included the Louvre and New York’s Metropolitan Museum). The series name is more an indication of the fact that it’s possible to see the best parts of a collection in a relatively short time, and not have an exhausting, and unsatisfying, afternoon slogging around looking for the best things to see. Self-contained spreads lead the user from one location to the next. It’s not really necessary to know where you are in the entire museum, but it’s shown with a locator inset.

I produced numerous city guides using the same idea. A writer would research the locations and the path to connect them. I would make a graphic of it. Mine was the easy part, I think.

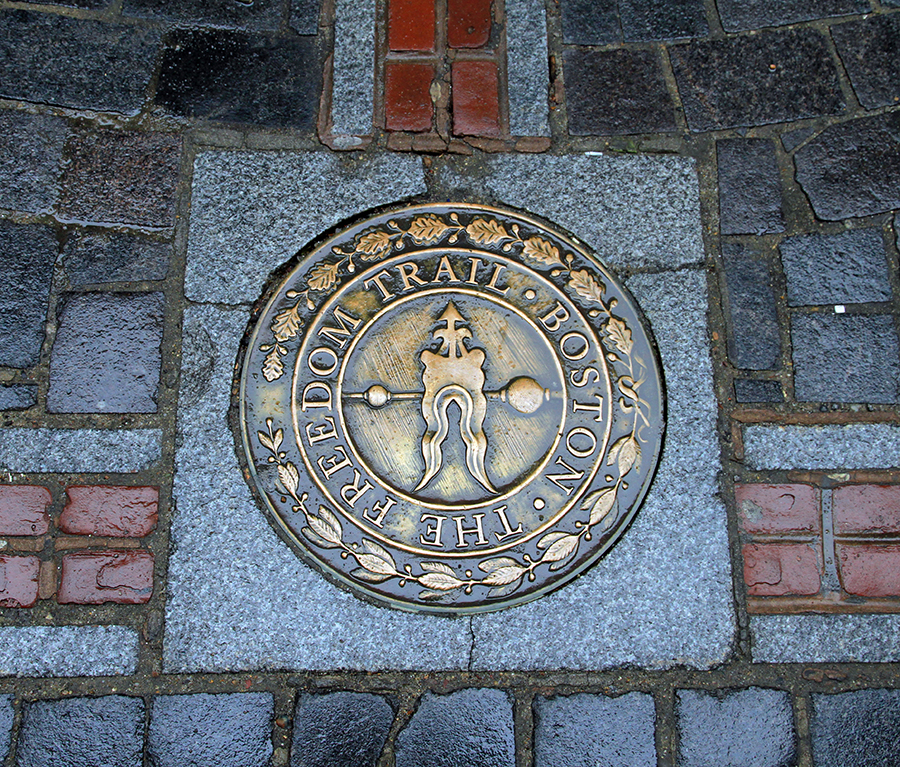
Reality It might be hard to believe, but I didn’t know about Boston’s Freedom Trail before I started using the red line approach. (Let’s face it, it wasn’t likely to be an idea that no one had thought of before.) I soon discovered that the idea had been made reality way back in 1951. There’s a red brick line that runs through downtown Boston for 2.5 miles (4 km), and leads visitors past 16 significant historical sites. I’d somehow always imagined that there really was a red line in the places that I was drawing, so this just confirmed my delusion.

(Photograph © sam74100/123rf)

(Photograph by Ingfbruno)


Bayer’s masterpiece

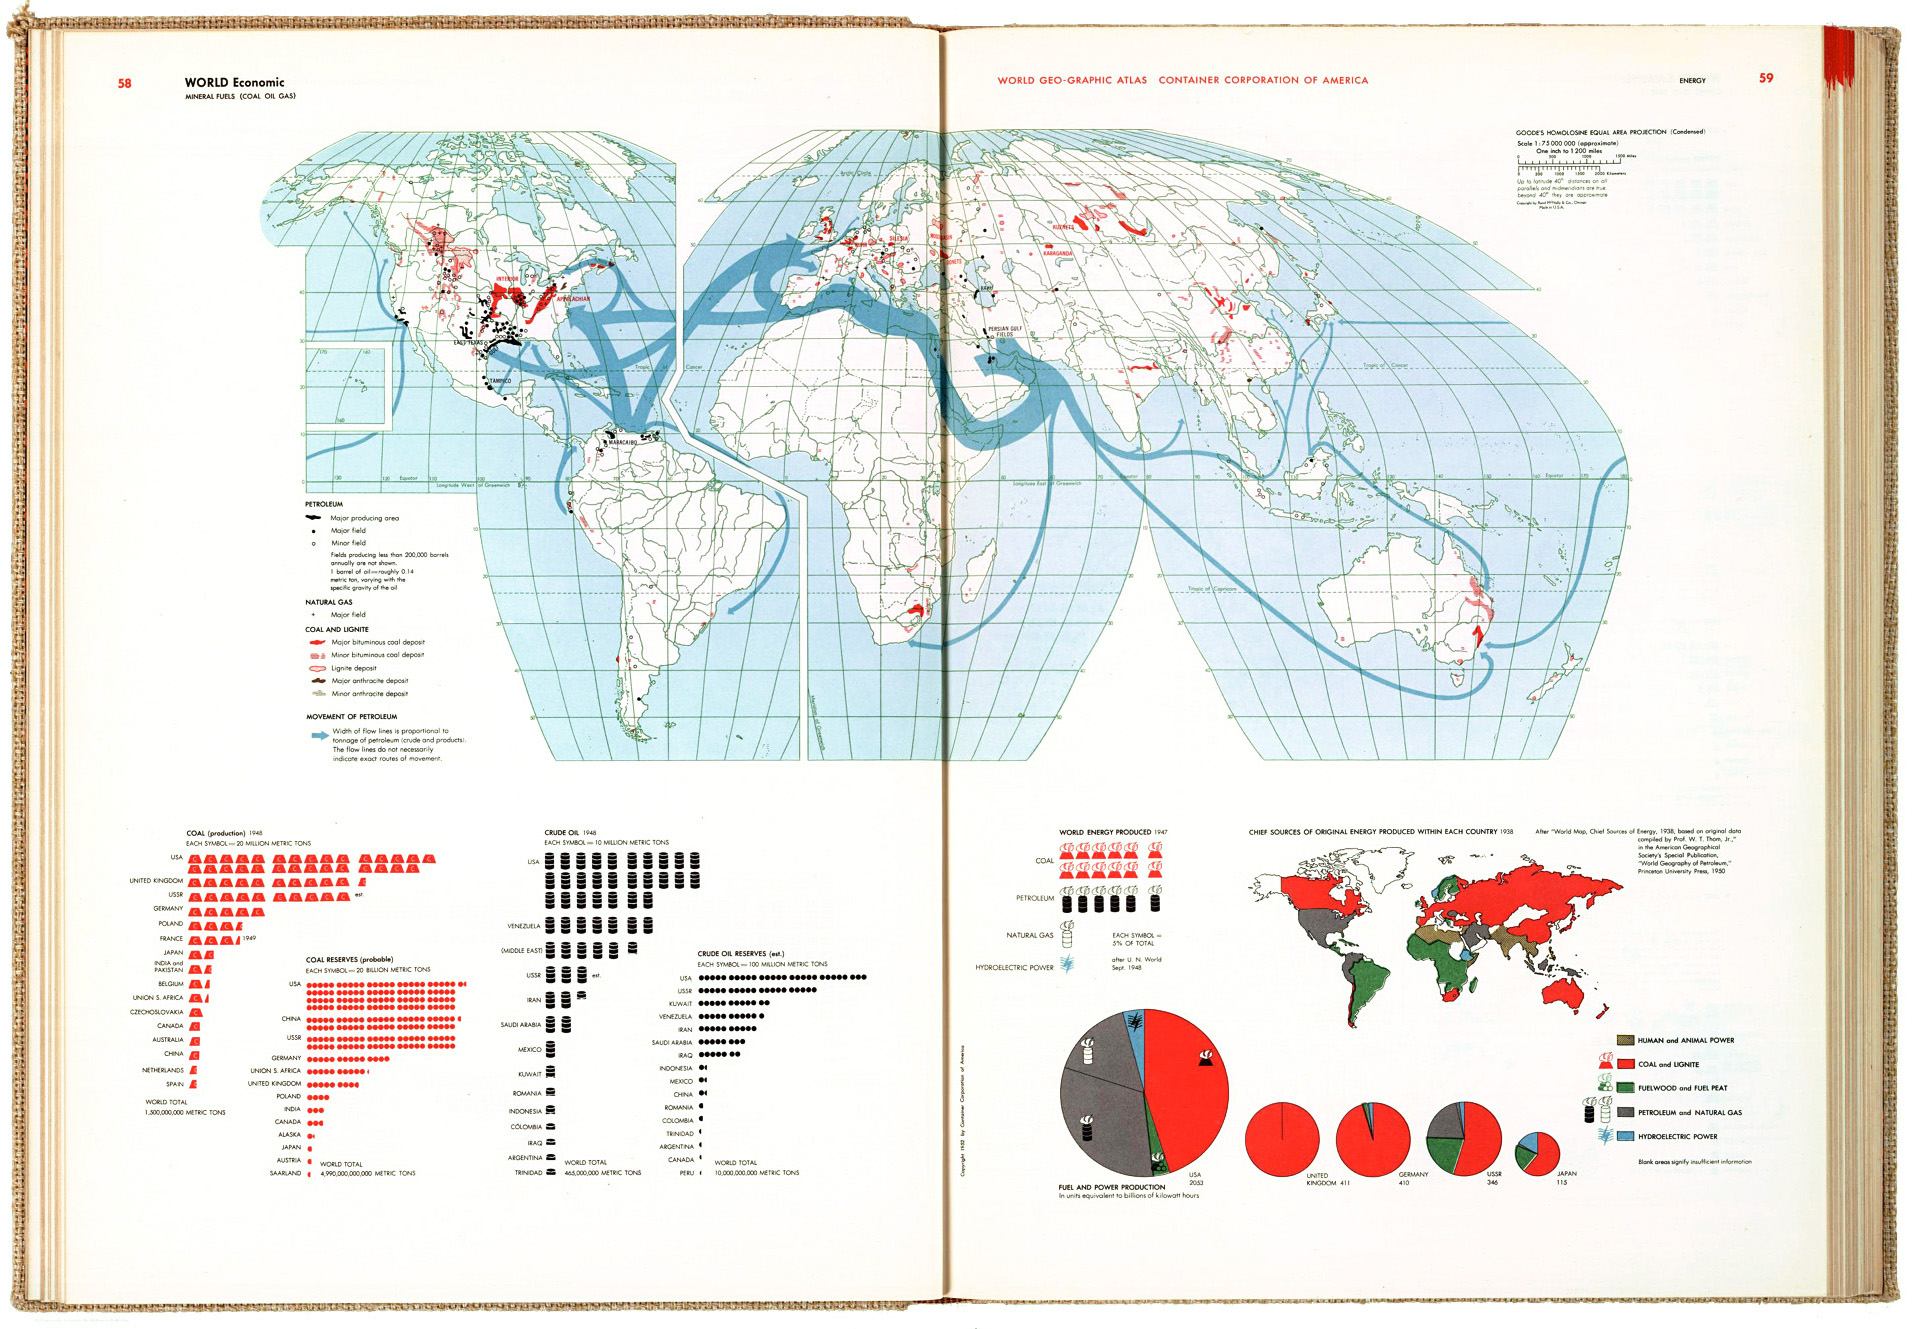
THE 1953 WORLD GEO-GRAPHIC ATLAS.

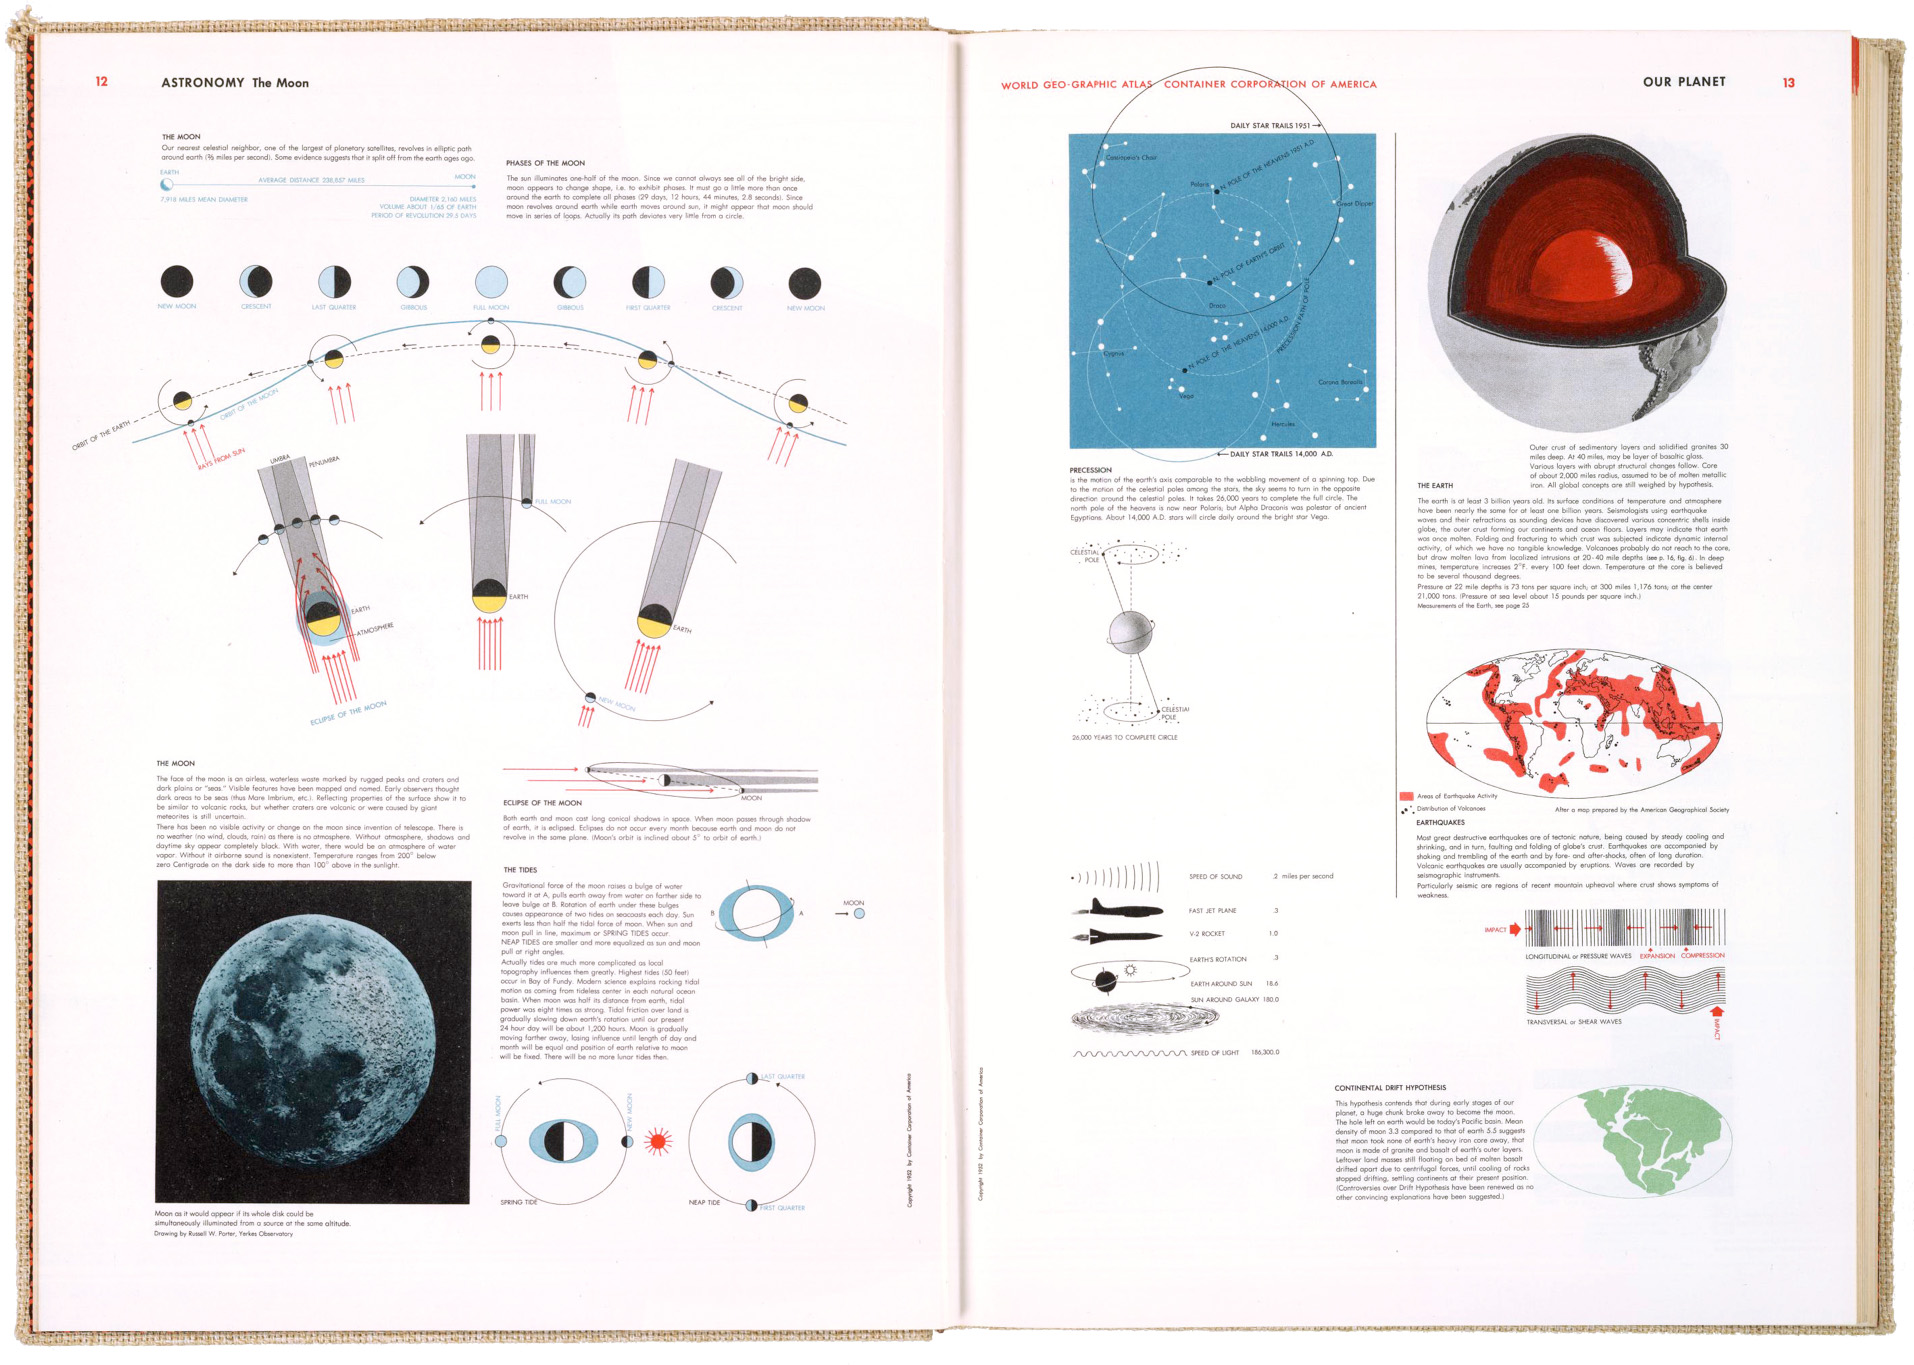
astronomy_hb1

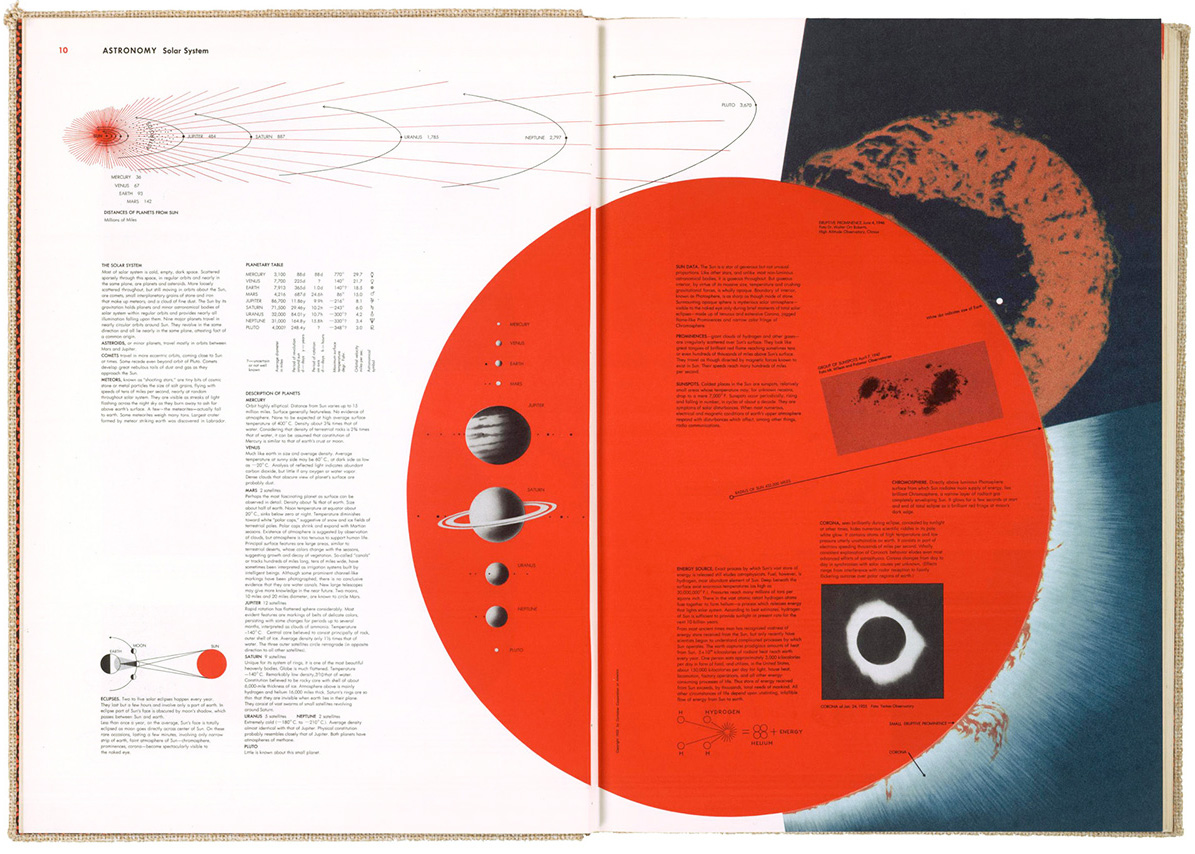
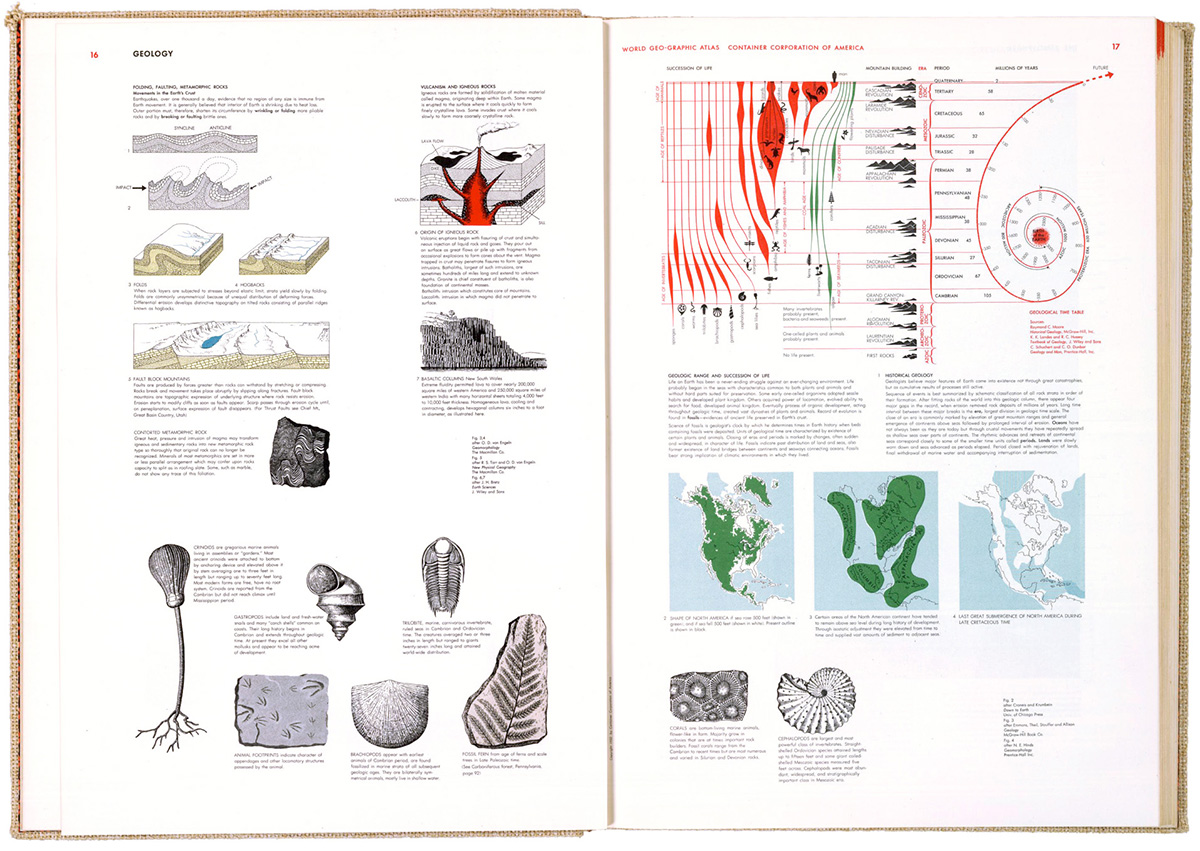
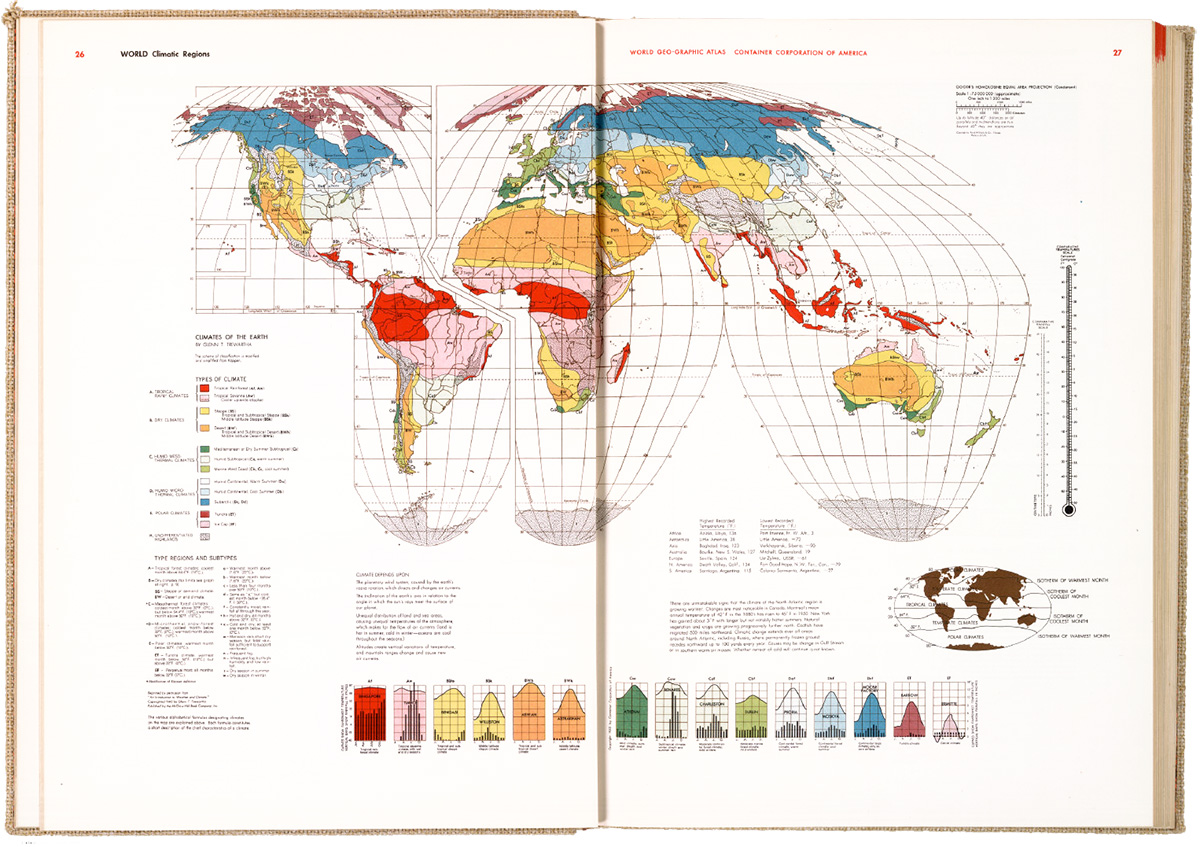
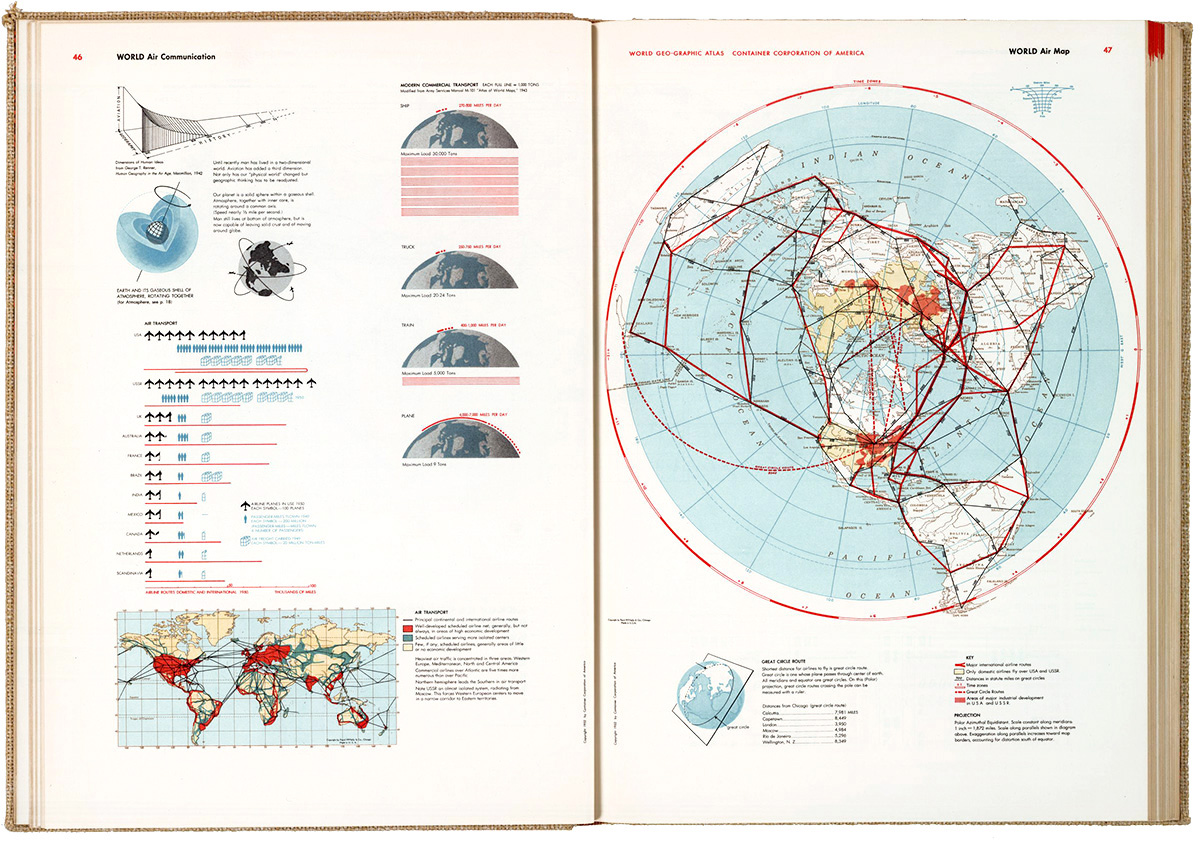
This informational gem took five years to produce and contains a few thousand infographic items. I don’t own a copy, but Michael Stoll, who I mentioned in an earlier post (https://www.johngrimwade.com/blog/2016/10/06/atlas-heaven/ ), has one (naturally) in his superb collection of historical information design. I was in Augsburg two weeks ago, and was able to examine the real thing, instead of looking at digital images. Seeing design in it’s original format, as opposed to looking at different sizes and variable image quality online (or in this blog, for that matter) is a vastly different experience. Often difficult to achieve, but worth the effort.

themoon_hb

The atlas was produced for the Container Corporation of America to commemorate their twenty-fifth anniversary. 30,000 copies were printed. They were distributed to customers as a gift, and given to numerous colleges and universities. It was never produced commercially, or reprinted, so original atlases in good condition are quite rare, and thus expensive to acquire.

A team of three designers worked under Bayer to develop a graphic language for the book, using the color system that had been developed for CCA by Egbert Jacobsen. Bayer did his own research, traveling widely to assemble the information. There are many design influences to be seen in the pages, like the Isotype system of pictograms. I’m struck by how it looks so modern, sixty-three years after publication. It shows the staying power of precise, clear information design.

geology_hb

Herbert Bayer was a Renaissance Man. A graphic designer, typographer, photographer, artist, interior designer and architect who studied and taught at the legendary Bauhaus school. He emigrated to the U.S. before the Second World War, and produced all kinds of impressive design across many fields.

climate_hb

airconnections_hb4

economic_hb3

These images are from the David Rumsey Map Collection. See the full atlas in high-res there: goo.gl/gpd8nV
The globemaker

CUSTOM HANDMADE GLOBES OF THE HIGHEST QUALITY.


paints

Quotemark1  When you can’t find it, why not make it yourself? QuoteMark2

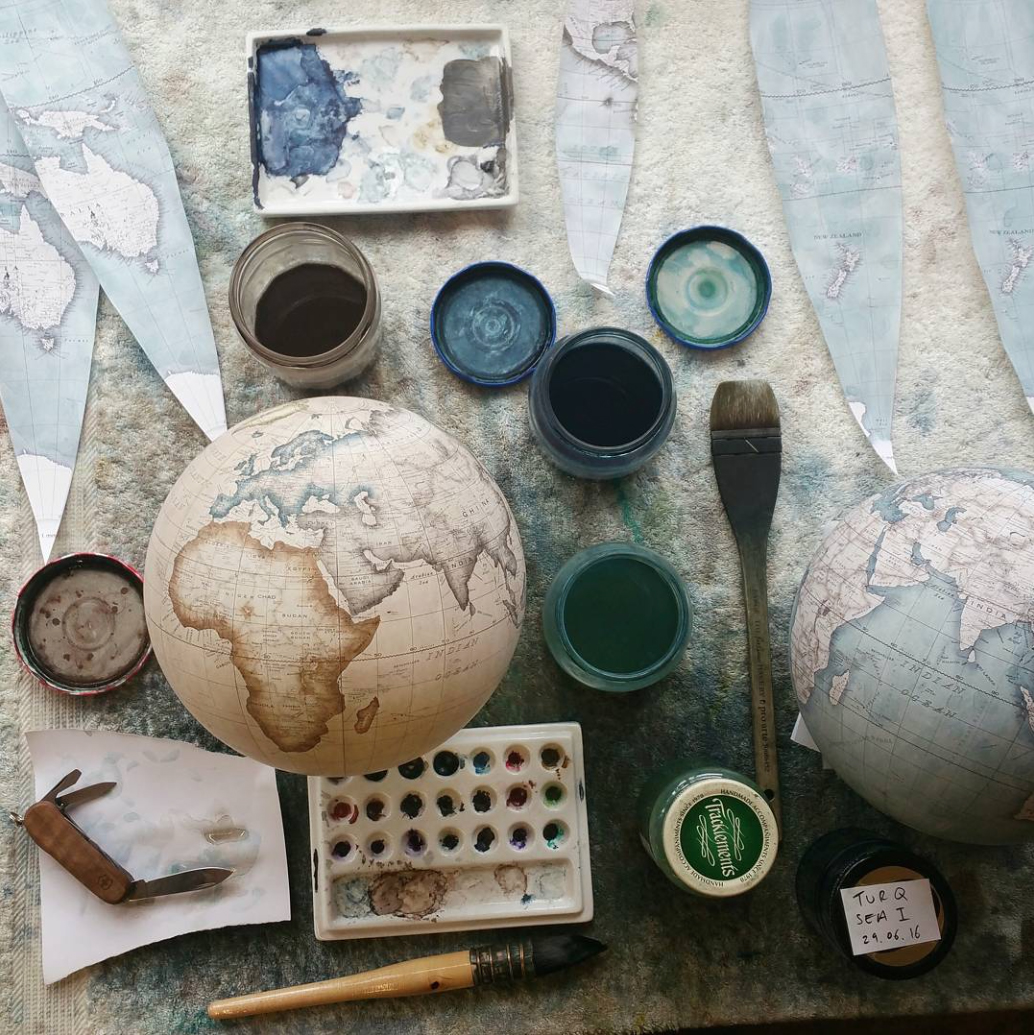
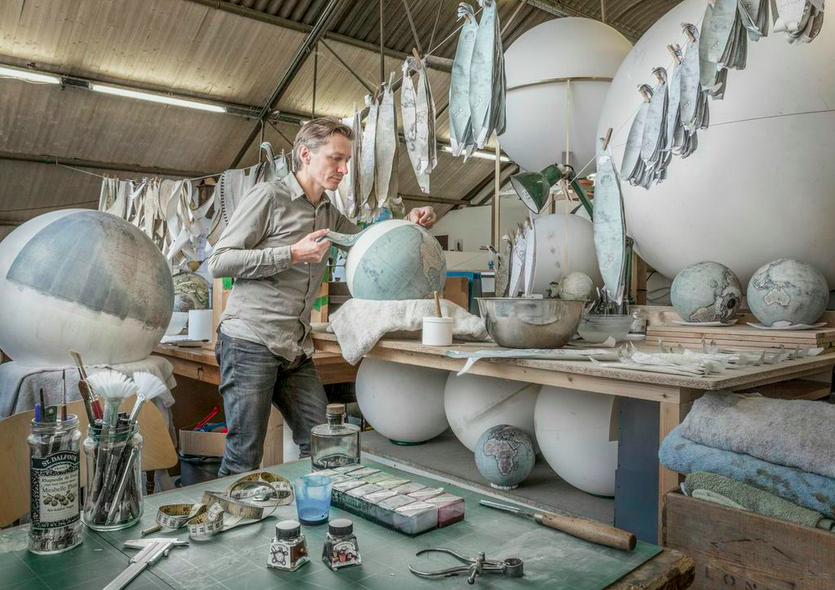
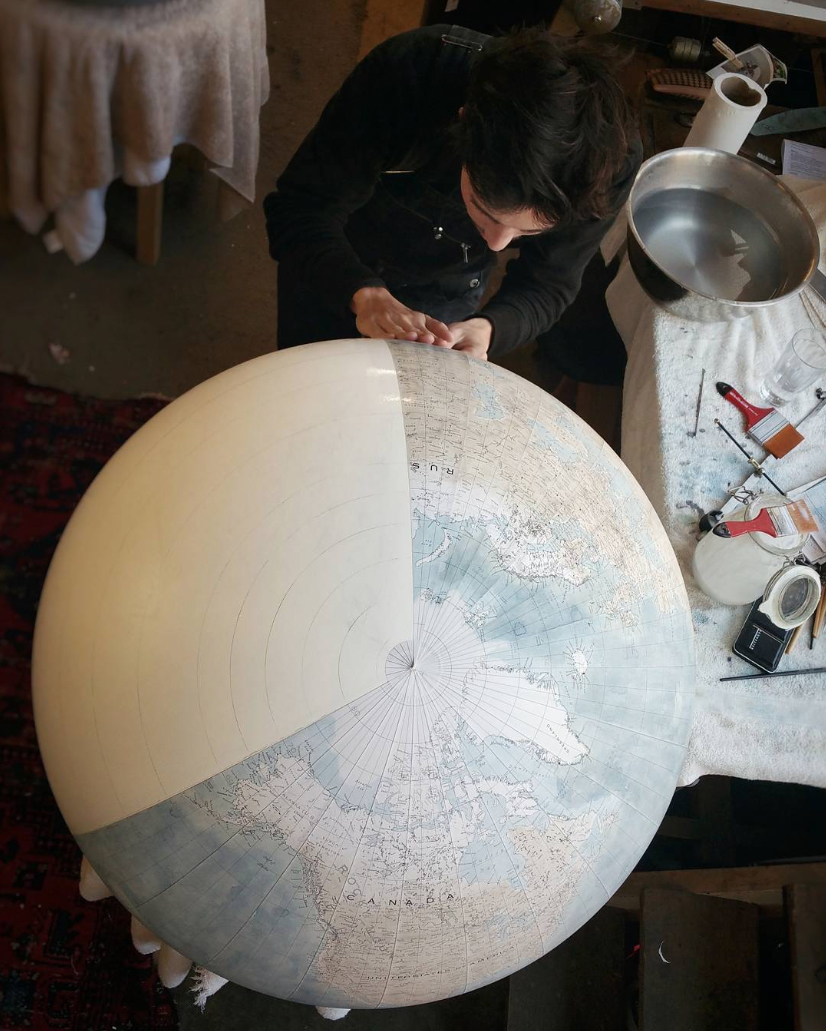
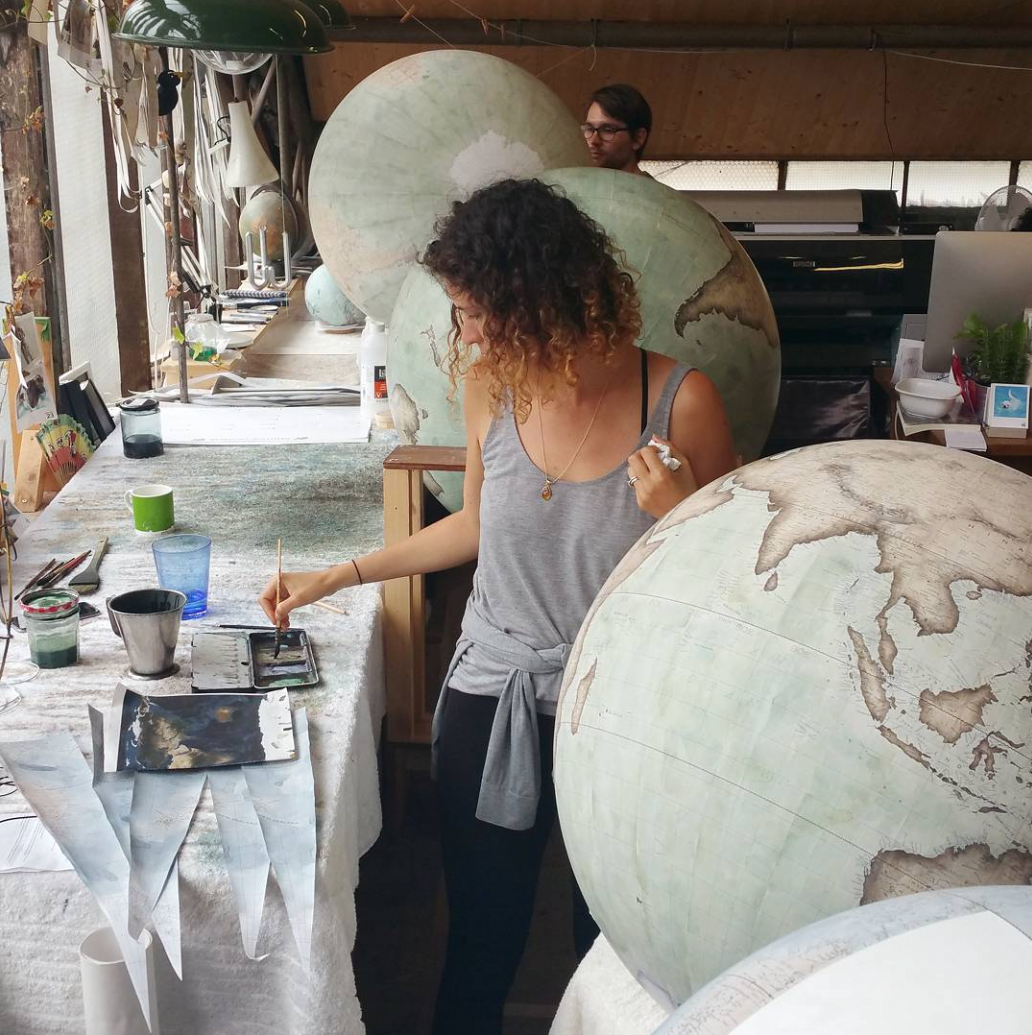
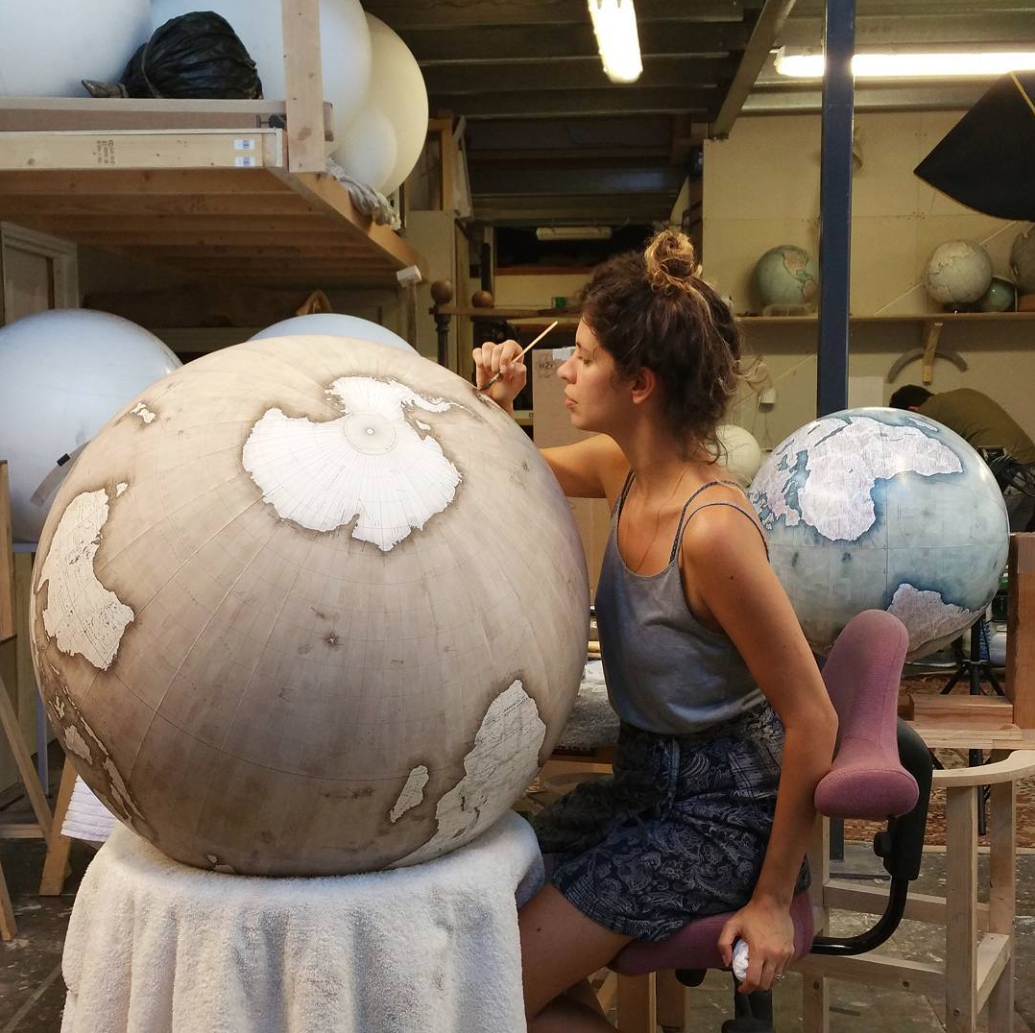
Peter Bellerby was looking for a globe to give as a gift for his father’s 80th birthday, but couldn’t find the right one. So he decided to try and make a globe for his dad, and perhaps another one for himself, and that would be it. But from that limited beginning, he expanded to a small business that was based in his house. Now, he and his team create the globes in a north London studio. (http://www.bellerbyandco.com)

I met Peter at the IC15 conference in Zeist (the Netherlands) and, like everyone else there, I was captivated by the beauty of these hand-crafted globes. Apparently there are only two businesses in the world that make globes by hand. (All photographs courtesy of Bellerby & Co.)

logo

bellerby_a

Peter in the studio. (Photograph by Julian Love.)

largesphere

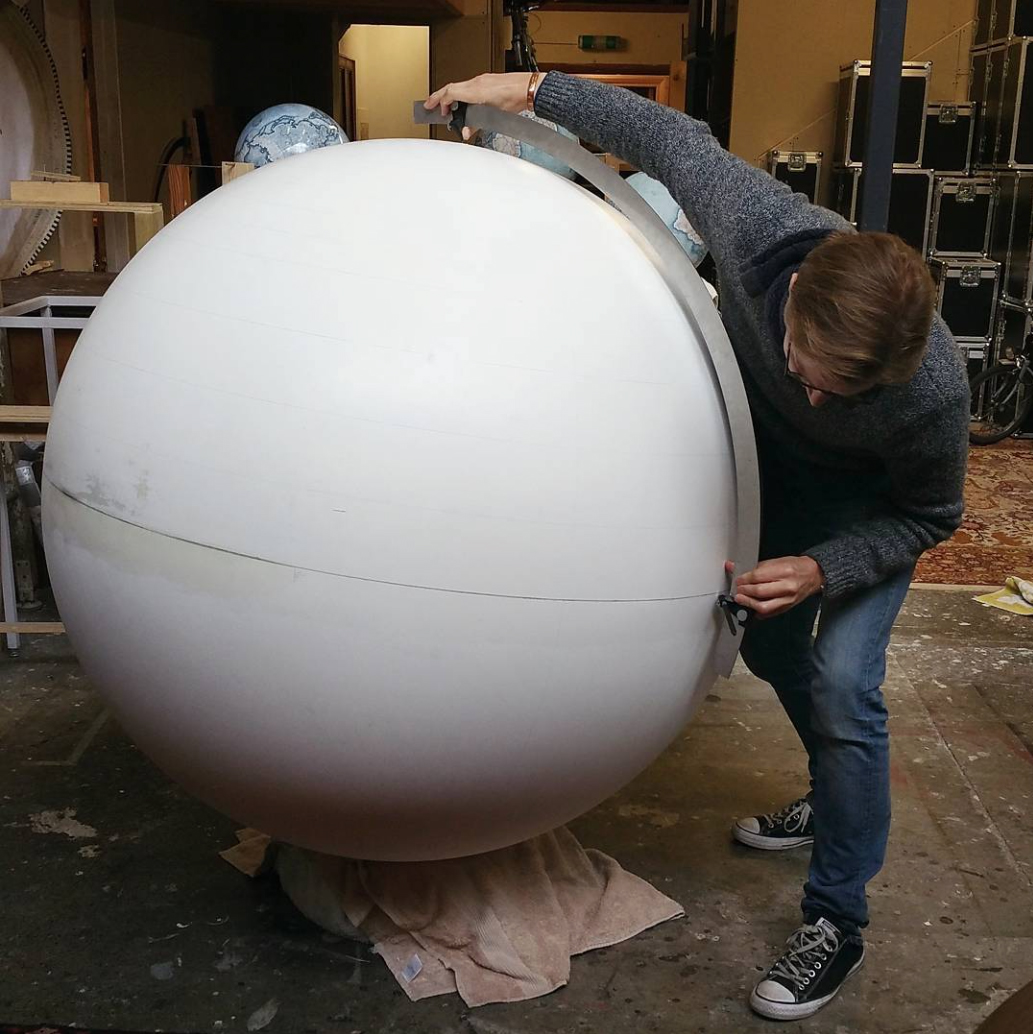
At work on a plaster of paris sphere (above). Below, the process of applying the gores.

gores

Painting the globes.

spheres2

painting2

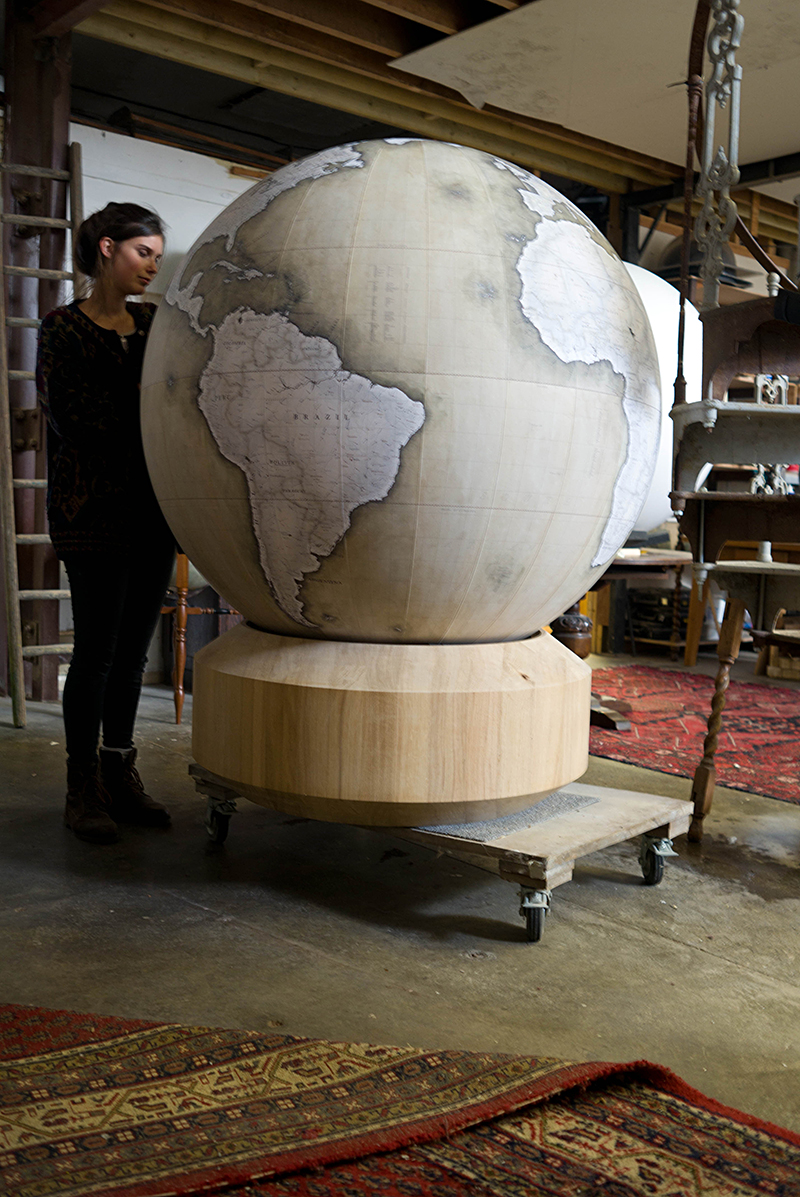
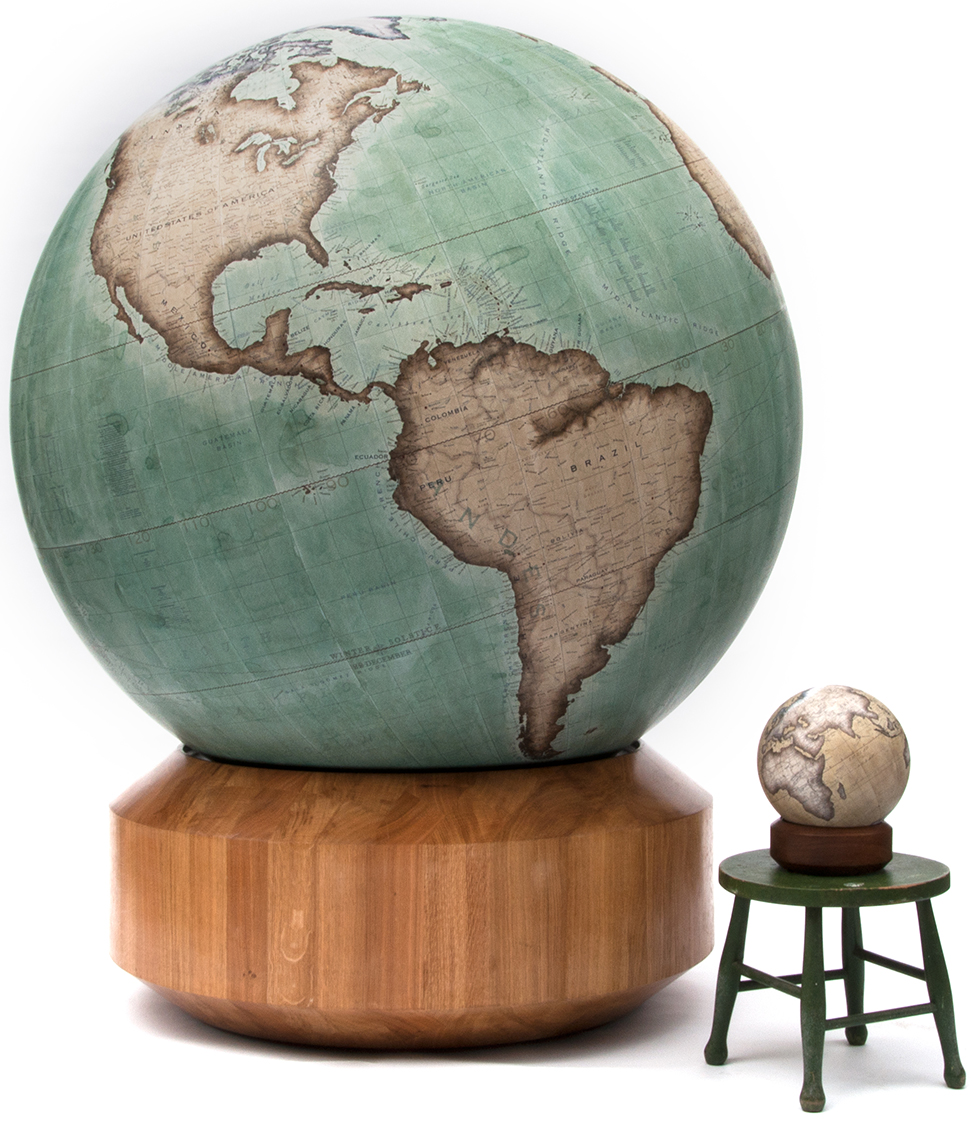
The biggest Bellerby globe.

churchill

churchill

The sizes range from small desk models, which are 9 inches in diameter, to the biggest one in the catalogue, The Churchill, a 50-inch giant that costs £59,000 ($72,000). They plan to make only one of these per year. All the globes have bases with roller bearings for completely free movement.

A really well-made video about the company and their work: https://vimeo.com/63511505