TWENTY YEARS AGO, I SAW THIS MAP AND I KNEW THAT INFOGRAPHICS WERE ENTERING A RICHER PHASE.
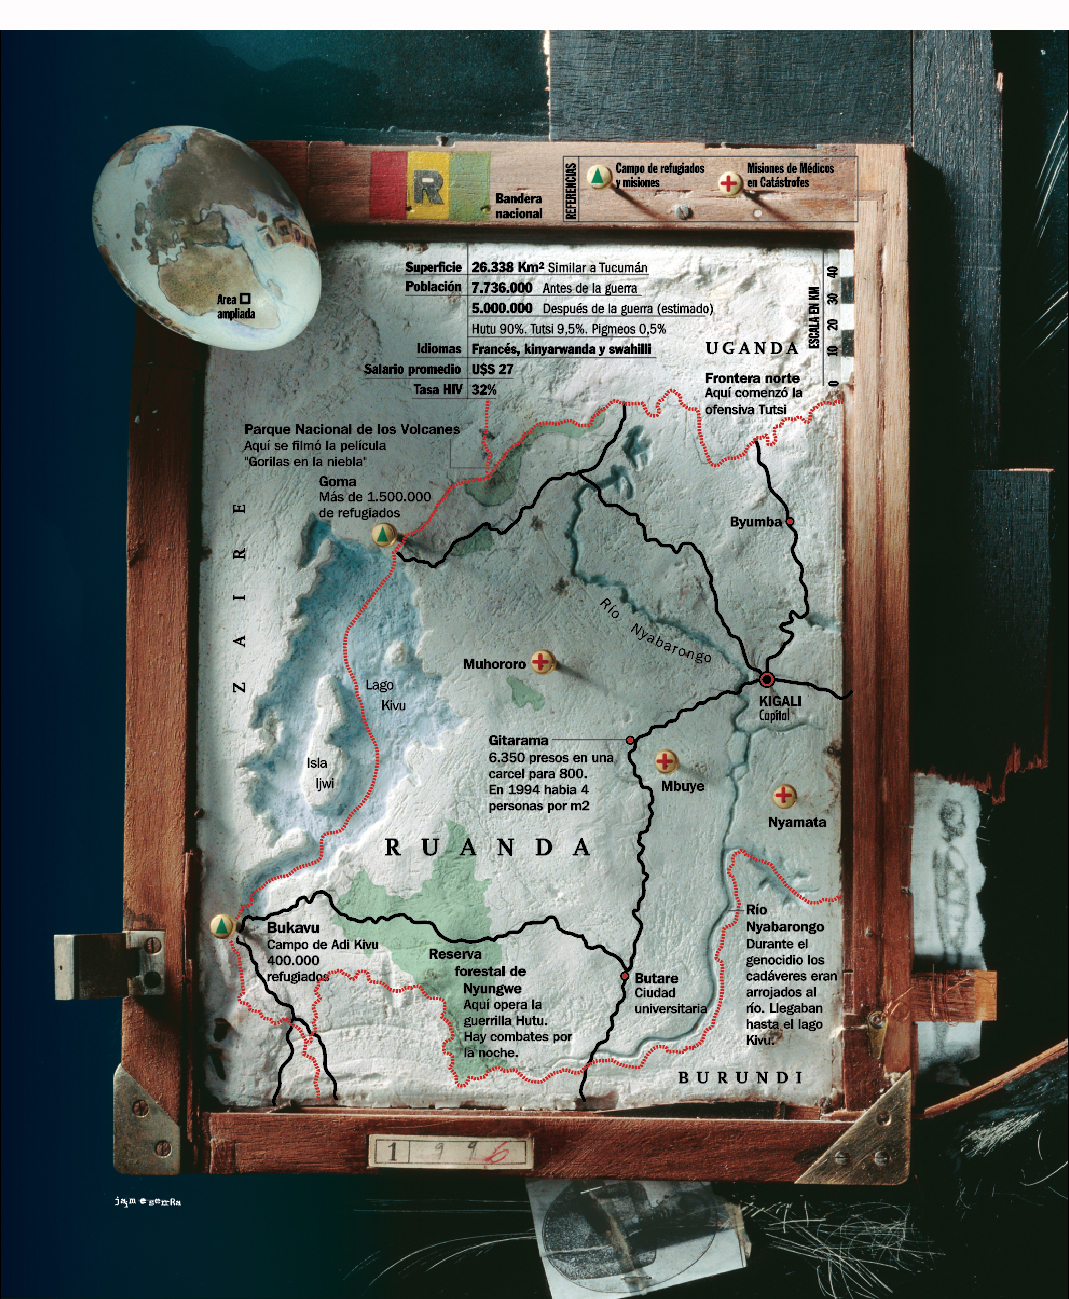
Genocide in Rwanda. (Click on the image for a larger version.)
Back in 1996, when Jaime put this graphic on my desk, I could see that the gap had been bridged from the computer-generated graphics of that time back to our rich, artistic infographic heritage. Art and information were brought together in a beautiful form, with function intact. As far as I’m concerned, this is one of the milestones of late twentieth-century information design. Jaime went on to produce numerous award-winning graphics at Clarín (see below), and many of you know them very well, but this one is really where it started.
Here are Jaime’s thoughts about the graphic. Written a few weeks ago, with the hindsight of the years in-between.
“Some background to the subject: In 1994 the Rwandan government, controlled by the Hutu community, were responsible for the murder of between 500,000 and one million Tutsis, equivalent to 75% of the population of that ethnic group.
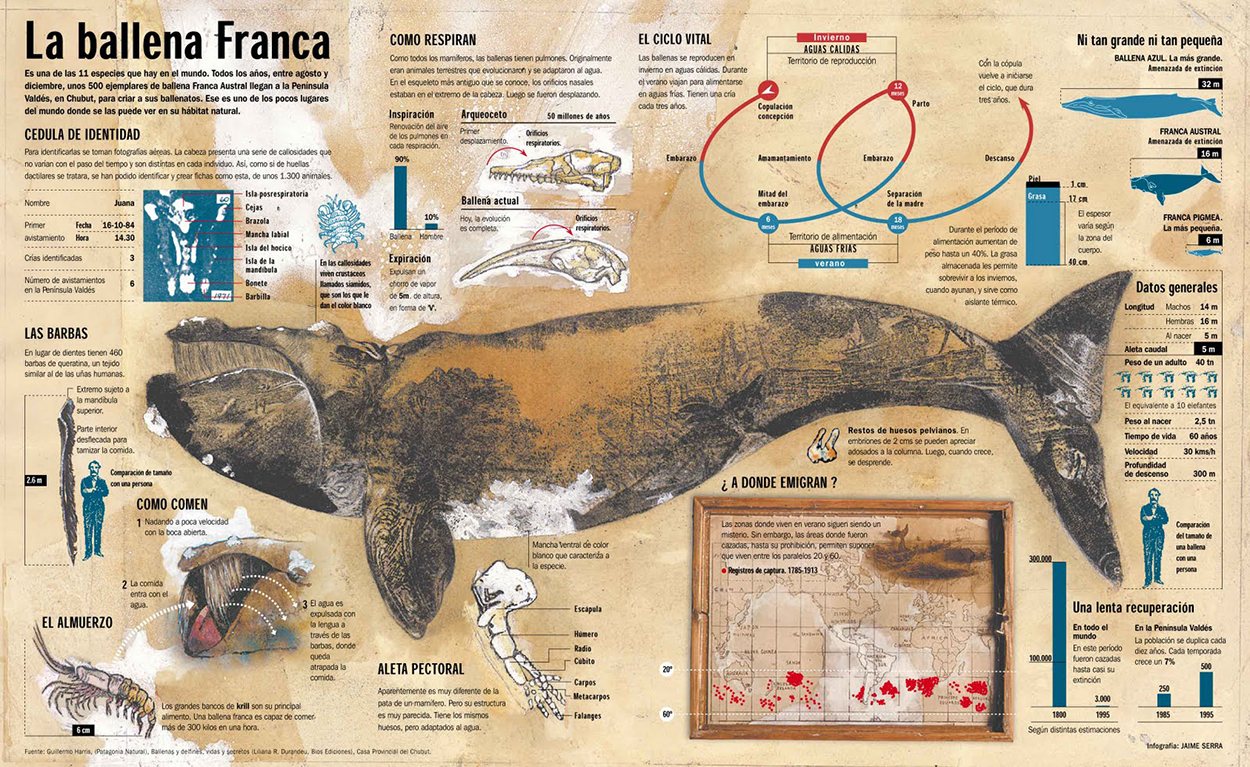
A year after the genocide, a Clarín team traveled to the refugee camps in the area. The infographic contribution to the coverage was just a small locator map. But it grew into a page in the Sunday magazine, mainly because of the graphic treatment. Pre-dating my better-known works such as “La Balena Franca” (Editor’s note: Gold medal winner at the Malofiej Awards.), this map was one of the first examples where I was able to capture my personal graphic style in a complete and radical way.
ARGENTINA
A year earlier, I had arrived in Argentina to create a graphics department at Clarín, a daily newspaper with the most readers in the Spanish-speaking world. At that time, there were no infographics in Argentine journalism, and although that was on the one hand a serious handicap, it also meant that I had the freedom to rethink the foundations on which we had built the profession in recent years.
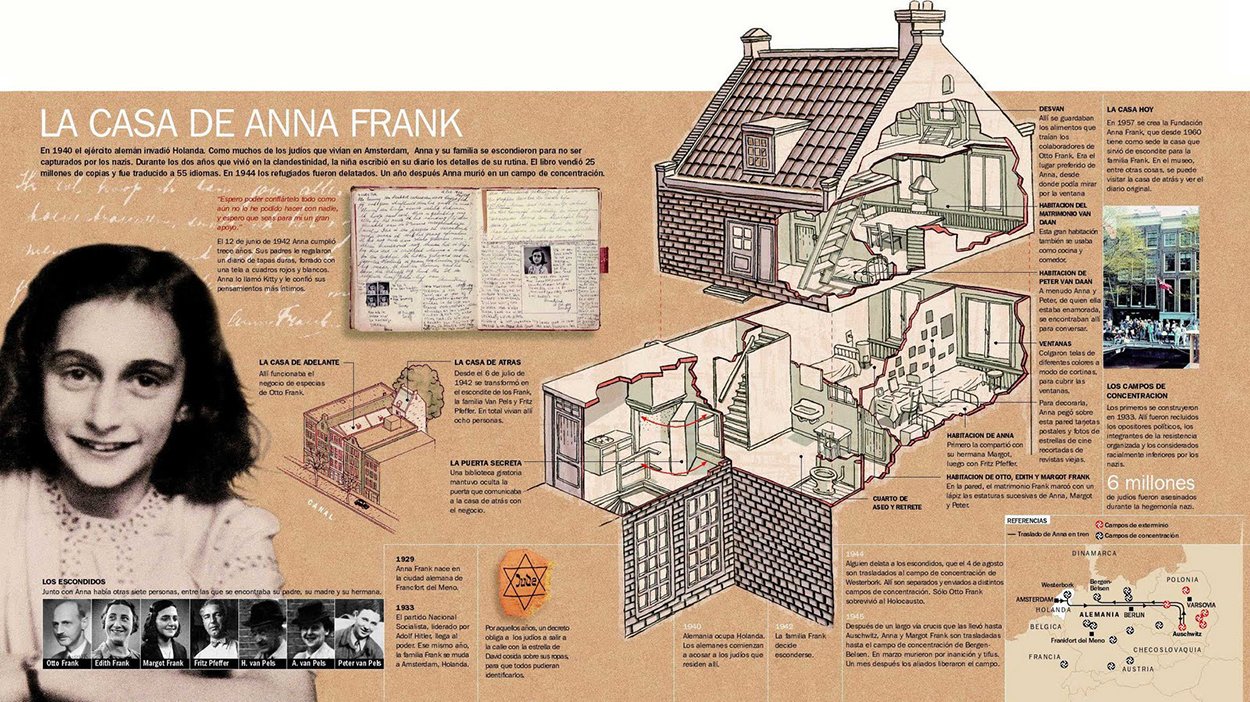
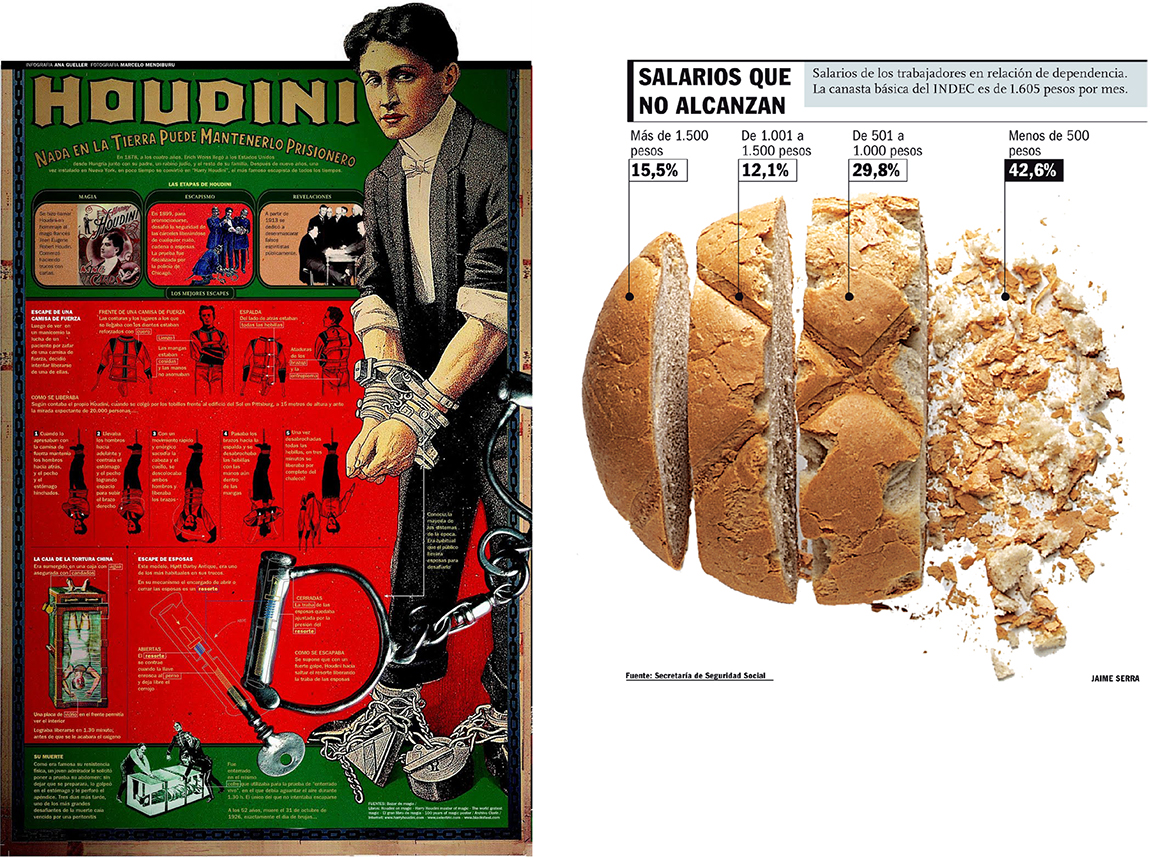
Back then, the general style of infographics was always the same, regardless of the subject. A somewhat cold, sterile style created with vector software. I was convinced that we were wasting a primary way to attract readers—aesthetics. So ready to take some risks, I gave Clarín a complete style manual that would be rigidly applied, while also starting a concept which I called “aesthetics and ethics” for the numerous exceptions where the graphic style manual would not be used. This idea was not a style, but rather the absence of it. Each infographic would be treated according to it’s subject matter. Using this approach, the Clarín team created, more or less successfully, each individual infographic, whether it was about rubber, Houdini, or the Anne Frank House.
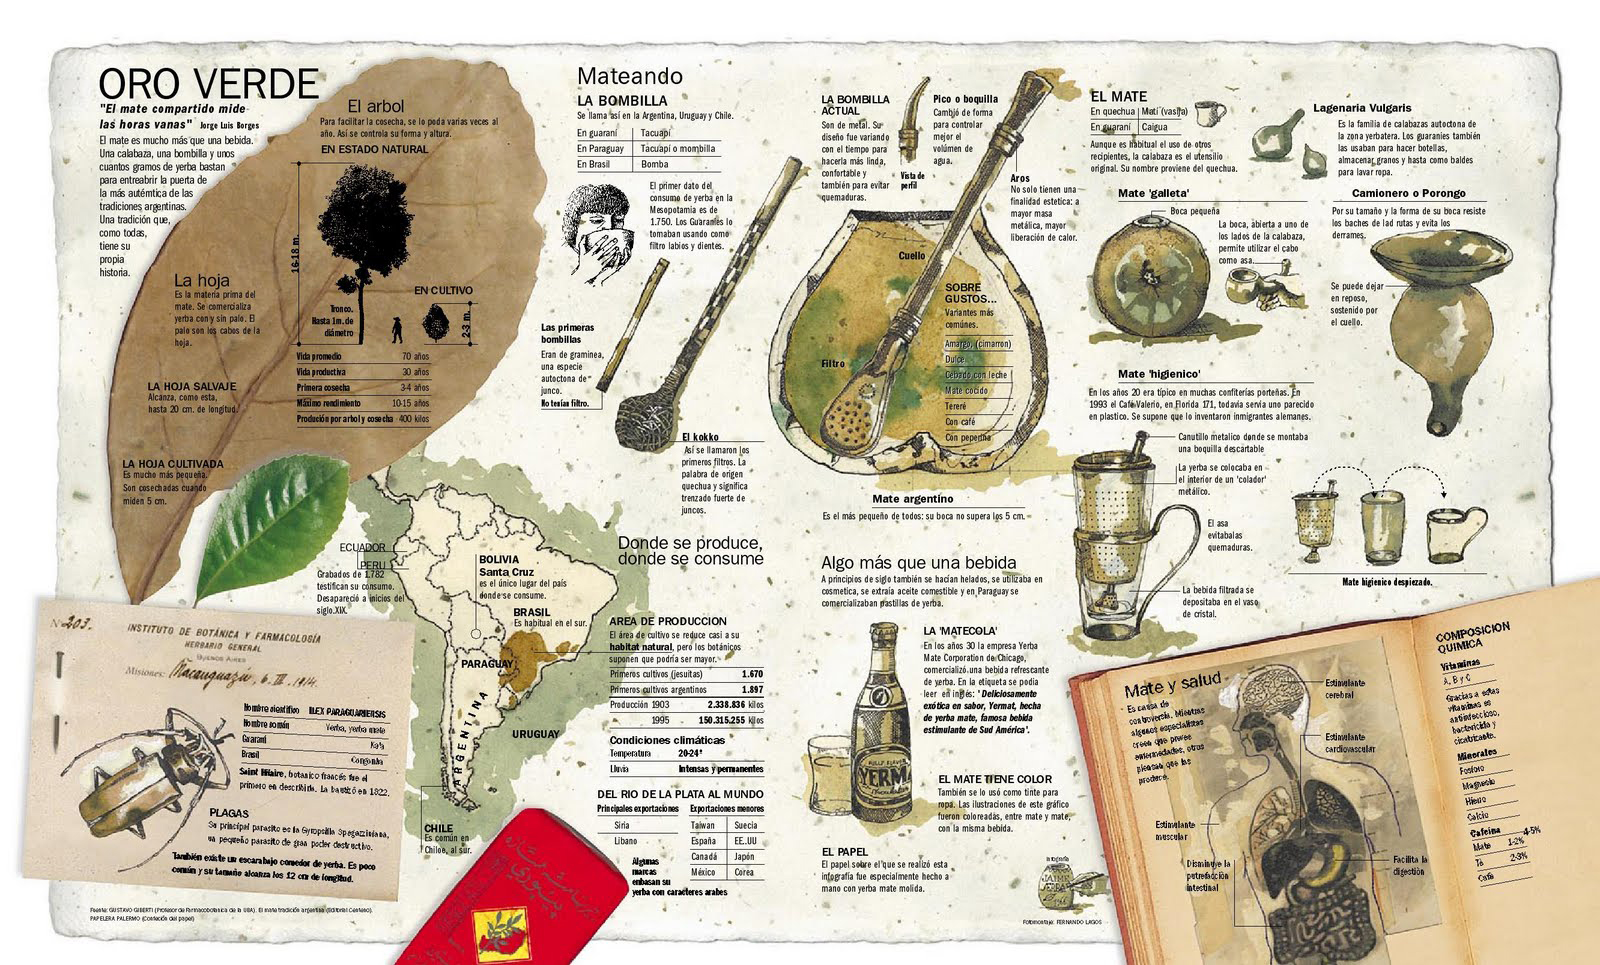
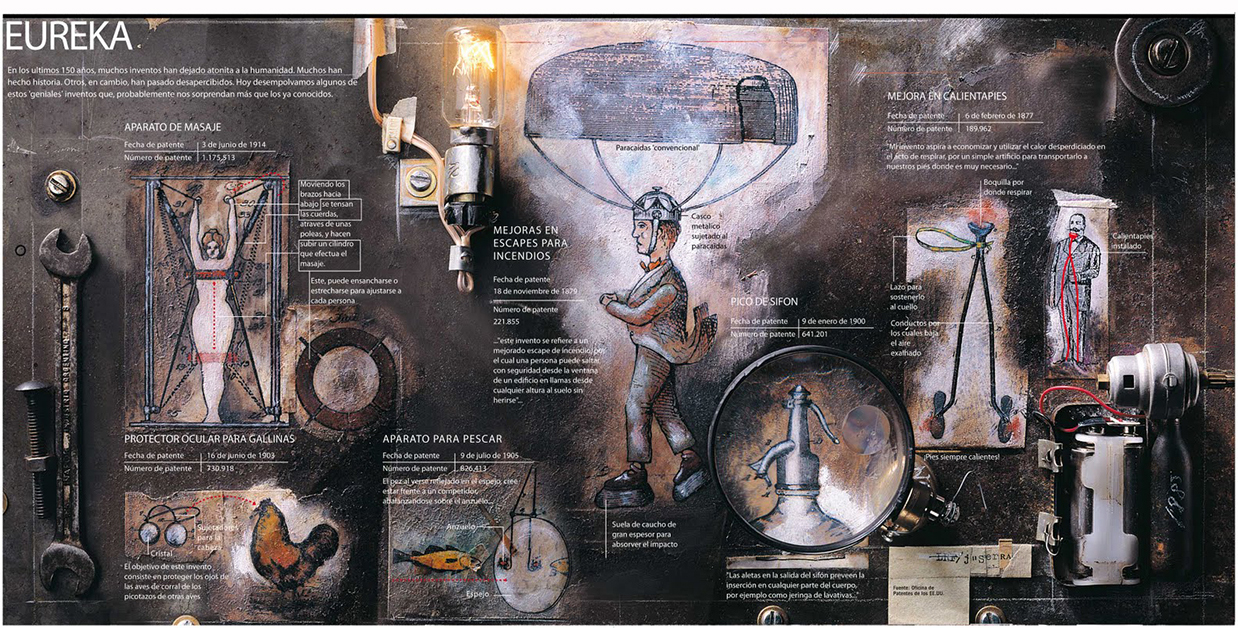
Looking back, I think that this was the natural evolution of my understanding of the components of infographics (illustration, information and design). Clarín was the place where my previous work and the new path came together. (Click on the infographics for larger versions.)
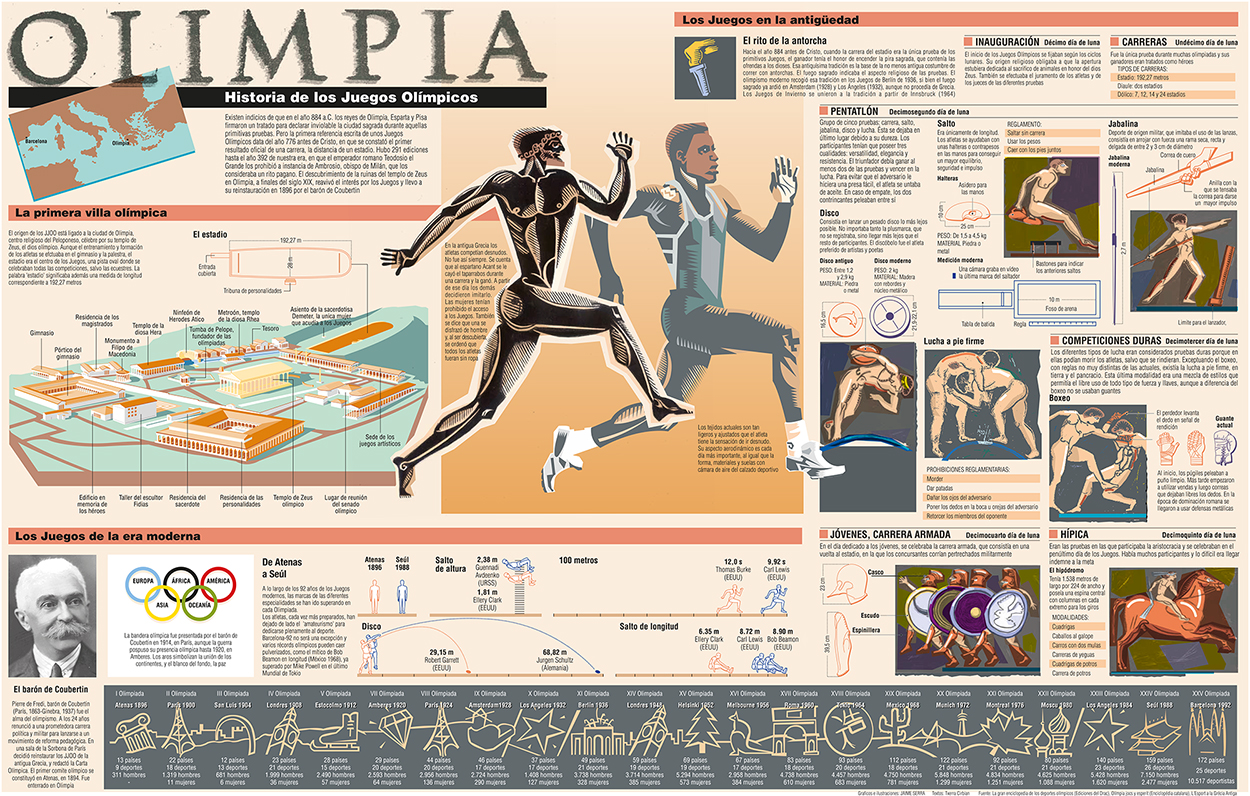
A clear precursor is the double-page spread (below) on the 1992 Olympic Games for El Periódico de Catalunya (where I had worked before moving to Clarín). It won my first Gold Malofiej medal. The illustrations that explain the sports of the ancient Olympic Games are hand-drawn with a scratchboard technique, using a stroke and color inspired by images of ceramics from ancient Greece. Peter Sullivan had made the point about hand-drawn elements in his book “Information Graphics in Colour” (published by IFRA in 1993), but I don’t think that many people followed the path he was suggesting.
While I was using the idea of a stylebook and the option to go outside it, I had another thought that would take me further: Could I use my own style in infographics, the same as I used in my most personal work, without compromising the information, and perhaps even improve it?
So with a graphic style influenced by illustrators like Henrik Drescher (http://www.hdrescher.com/), designer David Carson’s work in the magazine Ray Gun (http://www.davidcarsondesign.com/), and Anselm Kiefer (an artist who still fascinates me today), the strong content of the Rwanda map was an opportunity to explore the answers.
NEW YORK
John remembers the time we met in his office in Manhattan. I took a trip there to get a reaction to the work I had done in my first year of Clarín. That was how I met, among others, Charles Blow, graphics director of the New York Times; Joe Zeff, graphics director at Time Magazine and John, graphics director at Conde Nast Traveler magazine.
To be honest, I had never heard of Blow or Zeff. It was how they worked that interested me. But I knew John’s work very well, although I did not really know Condé Nast Traveler, apart from the infographics. If Carson, Dresher and Kiefer were the role models for my style, Grimwade was my main reference for infographics. My objective was to apply my personal aesthetic to the communication skills that I had learned from observing how these graphics directors worked.
STILL RELEVANT TODAY
At the bottom of the Rwanda map is a hand-drawn date. It’s the year that I made it: 1996. Twenty years later, I wonder (and I asked John this recently), who would be interested in it? His answer: many people, and for me it is more than enough that he thinks it still seems relevant.
(Another editor’s note: I called this blog “Infographics for the People” to draw our attention to the need to add warmth to information presentations, and generally engage the public. Jaime was doing that decades ago.)
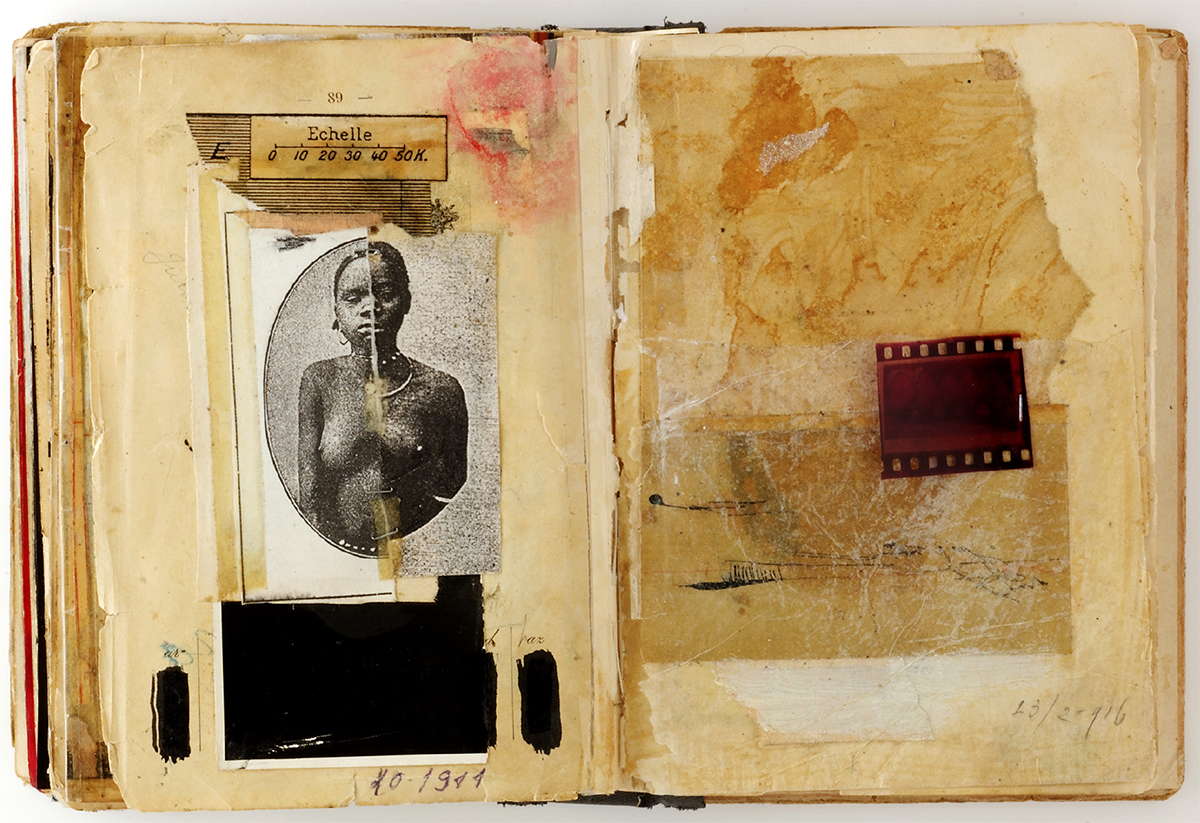
STYLE SKETCH
In addition to making sketches to plan the layout and content of the infographic, I also made drawings to find the right tone. In my sketchbook, I made this montage with photocopies of two very similar black women. There was no racial difference between Tutsi and Hutu. They are two divisions within the Banyarwanda ethnic group. After the genocide, they were eliminated from a national document which was cut and re-joined with staples. Most of the countless murders that were documented were carried out with machetes. The geographical scale is in French: Rwanda had been a Belgian colony, and this seems to suggest the dimension of human and social costs.”
See more of Jaime’s brilliant work, and the process behind it, here: http://jaimeserra-archivos.blogspot.com.es

