Video dreams

ALTERNATE REALITY FROM BLACK SHEEP FILMS.

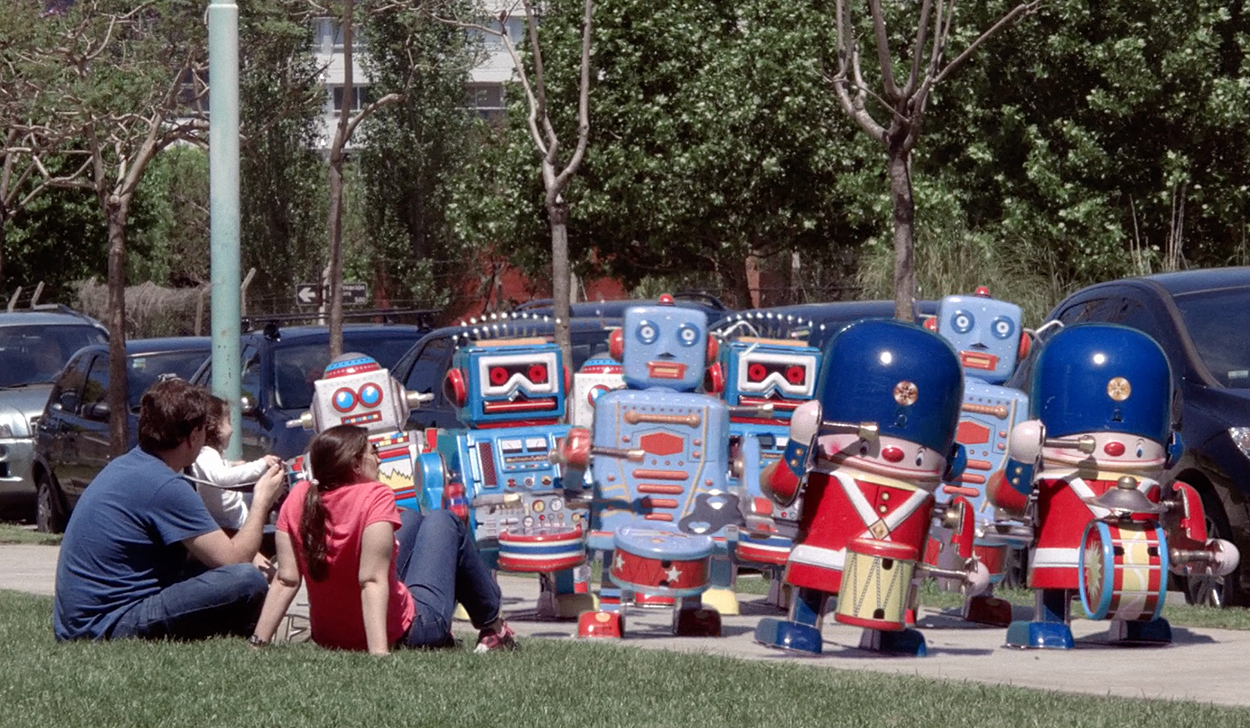
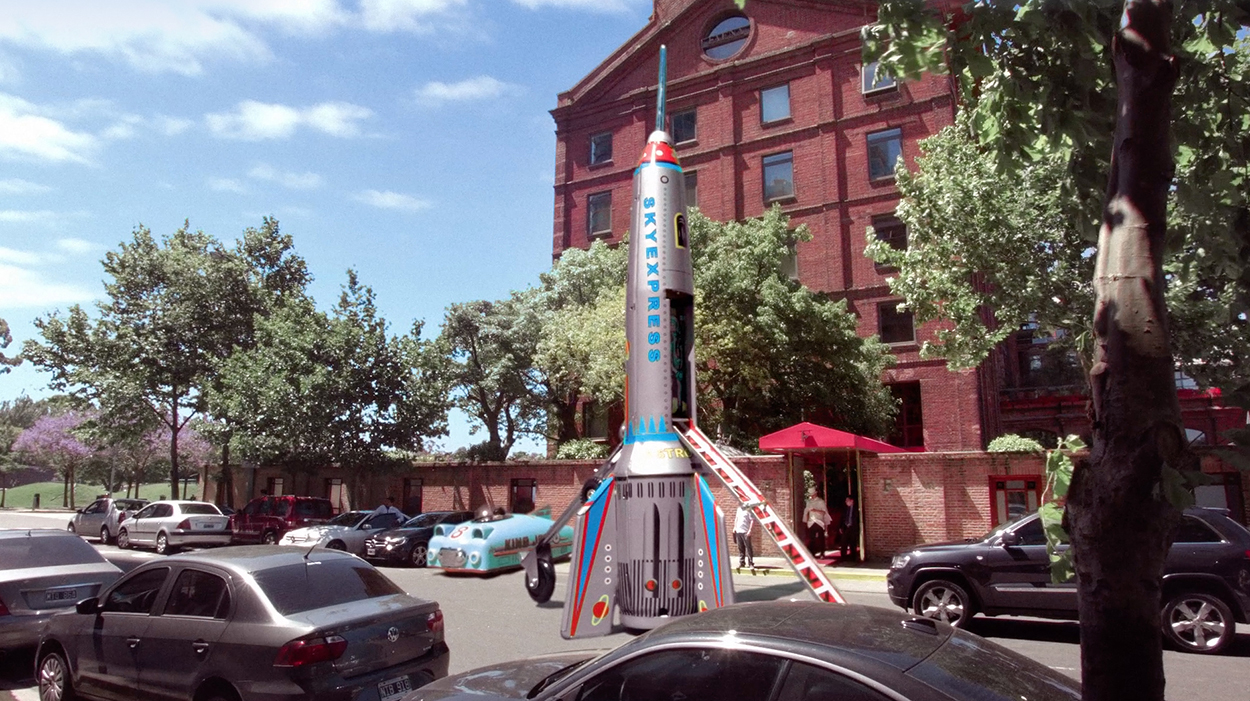
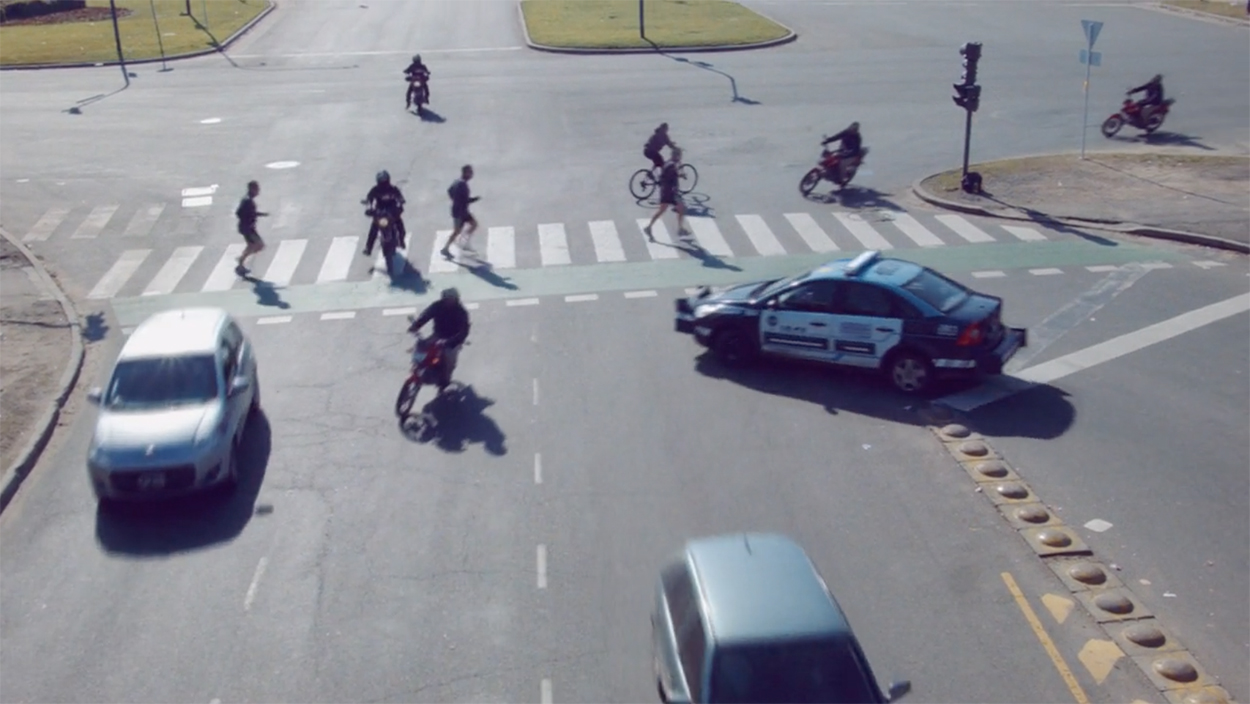
This week’s posts both feature creative video. Fernando Livschitz, who is based in Buenos Aires, uses special effects to create these dream-like videos. The fantasy elements are set against everyday urban backgrounds.

These are three of my favorites.

Giant tin toys (above and below)
Wind up Bots: https://vimeo.com/86907417

Warped transport
Perspective: https://vimeo.com/224876461

Traffic nightmare
Rush Hour: https://vimeo.com/106226560

Fernando’s website: https://www.bsfilms.me

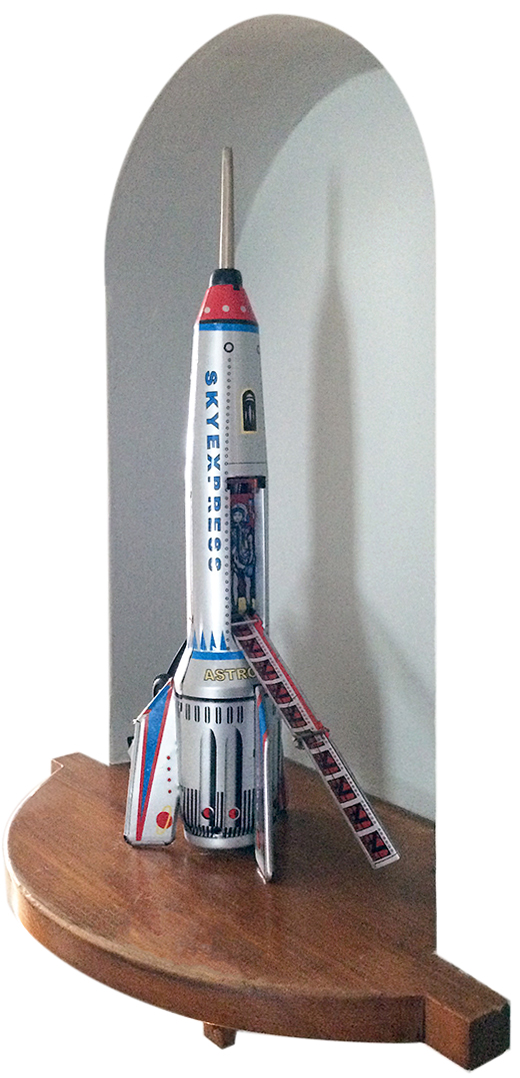
As a footnote, I just happen to have one of those rockets (in the tin toys video) on a shelf in my house.

Malofiej 26

TIME FOR AN INFOGRAPHIC RECHARGE.

Soon people who love infographics and data visualization will converge on Pamplona (Spain) to find out what’s happening in the industry, and set themselves up for a great year of graphics. The M26 conference is from March 14 to March 16. A list of speakers is here: https://goo.gl/CG3Jf5
And registration is here: https://goo.gl/GfNmwZ

For six days, the University of Navarra is the center of our infographic universe. M26 starts with a long-established (and widely recognized) workshop for professionals, which I was involved in for many years. That runs from March 11 to 14. This year, the instructors are Fernando Baptista (National Geographic), Larry Buchanan (New York Times) and Javier Zarracina (Vox): https://goo.gl/AUNFmc

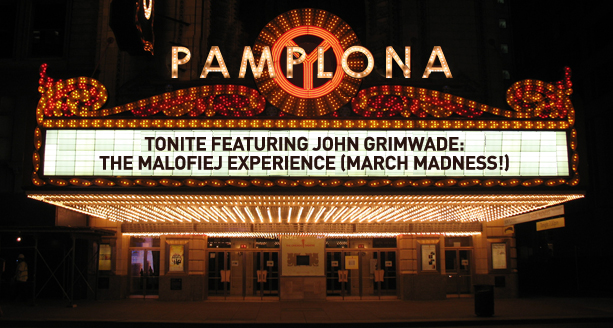
I’m running an international student workshop, along with Lisa Borgenheimer who is a professor at the Free University of Bolzano in Italy. Nine of our School of Visual Communication students are taking part. Which has nothing to do with the image below from 2012, when I was making a presentation celebrating the twentieth-anniversary of the Malofiej event. I’ve put it in here just because I like it.


Photo illustration by Neria Armendáriz.

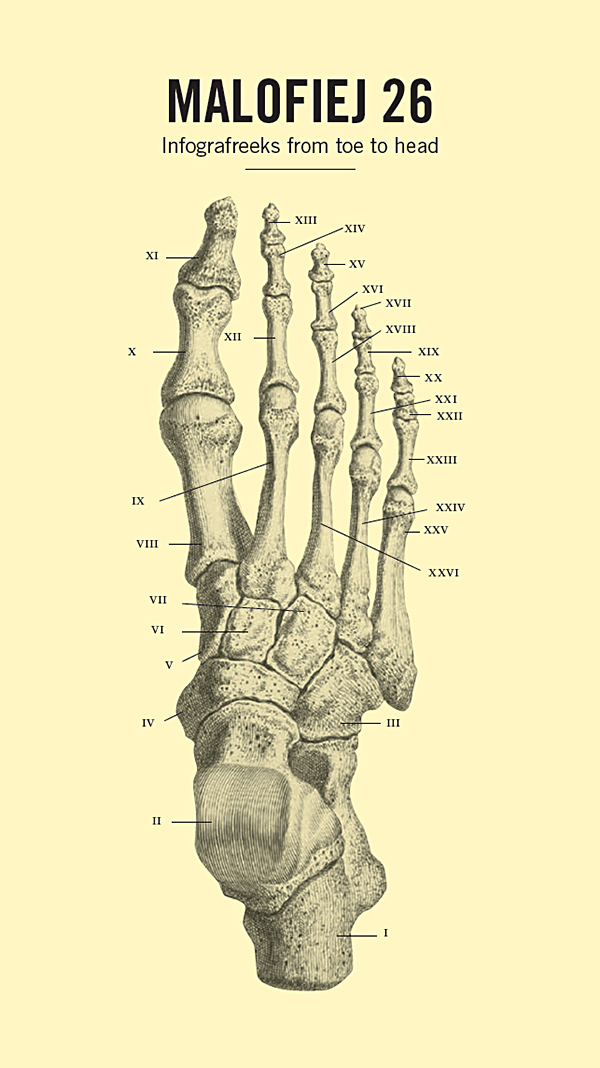
And now… some other M26 examples.
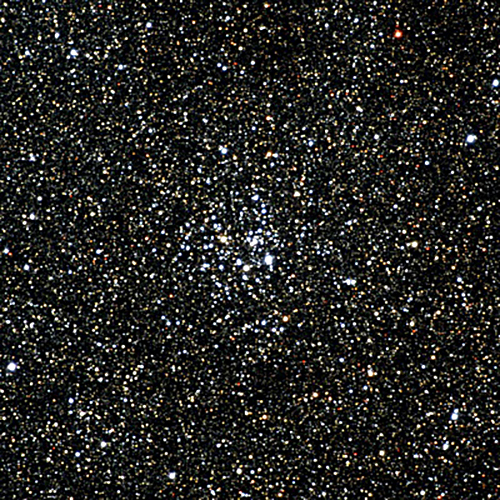
The M26 constellation is about 5,000 light-years away. There’s probably several planets with infographics in amongst these stars. Do they use script fonts? Have they discovered pie charts?

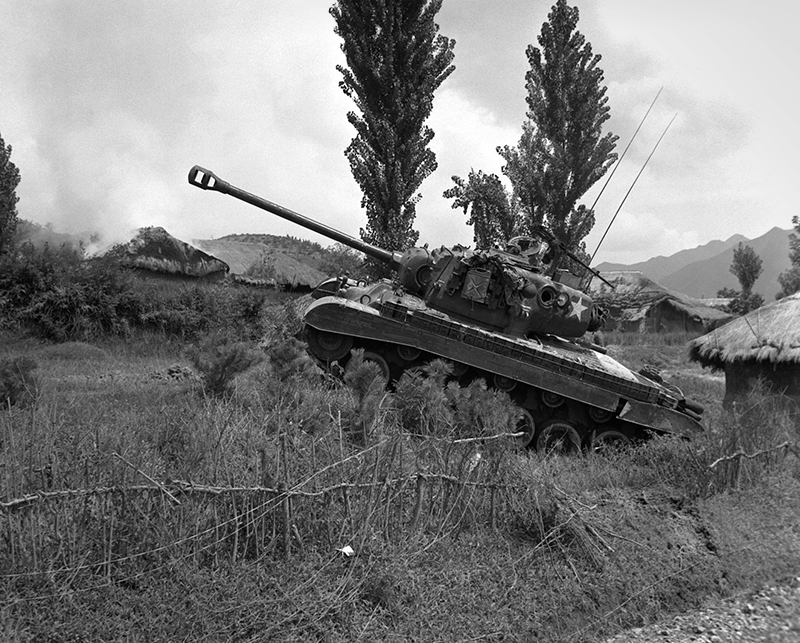
A vintage tank. We all like making graphics about military equipment…


Photograph by Sgt. Frank C. Kerr.

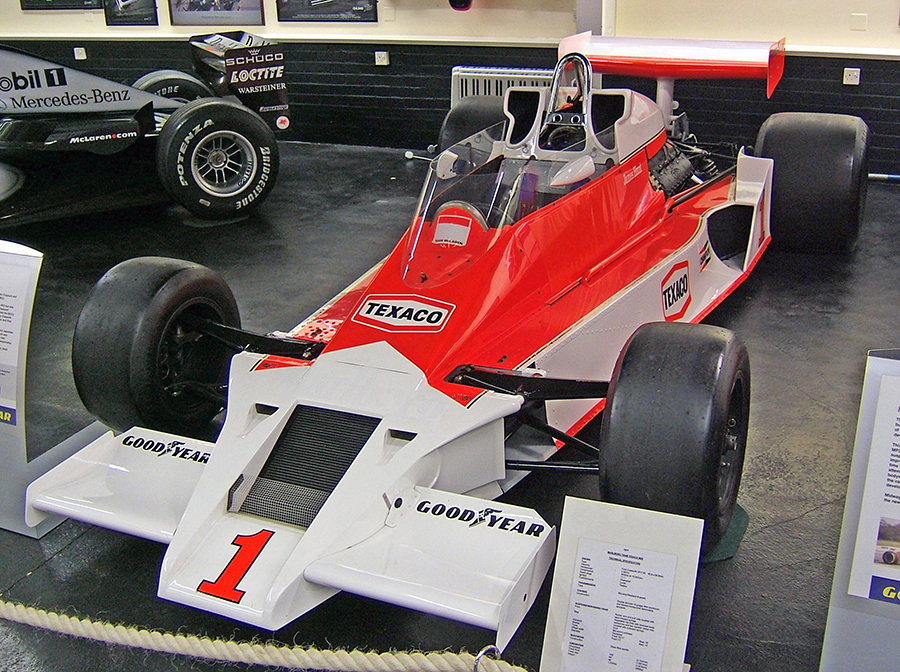
…and racing cars. This is a 1976 M26 McLaren.


Photograph by John Chapman.

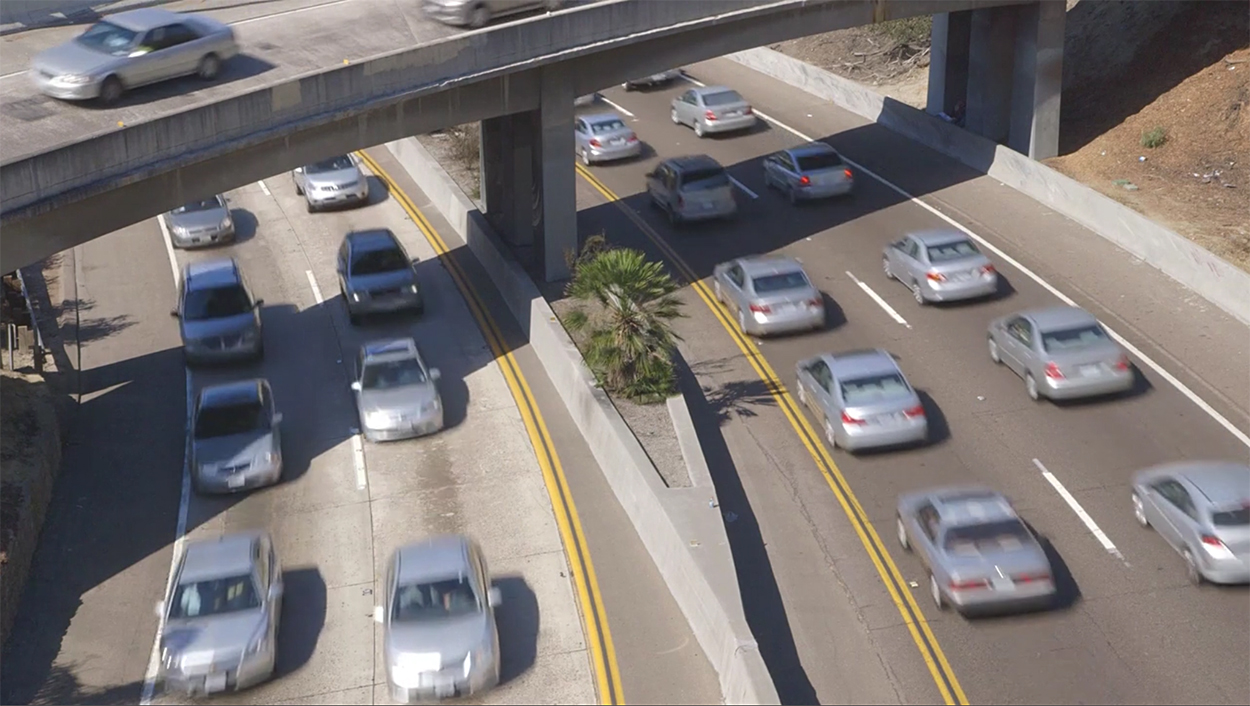
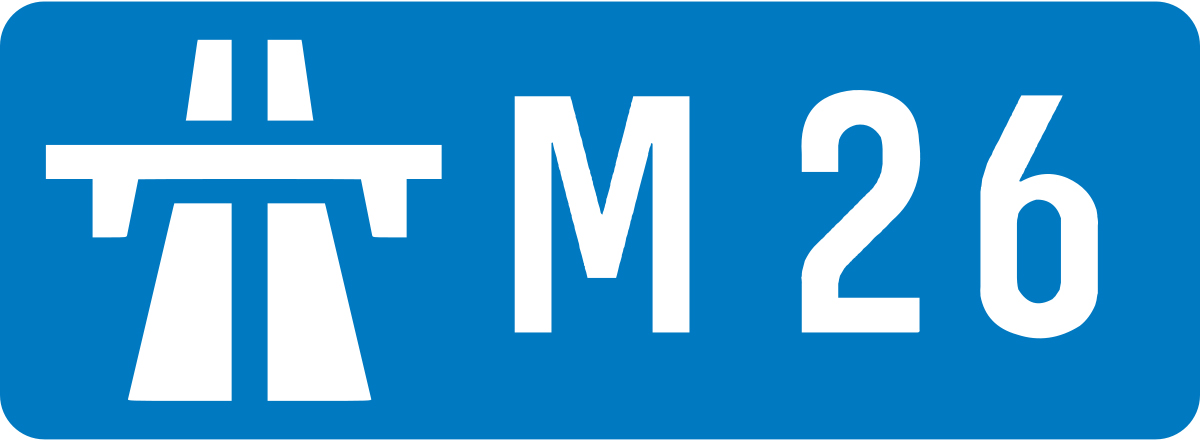
An motorway in my home county, Kent (U.K.)


Camouflage

DESIGNED TO CONFUSE.

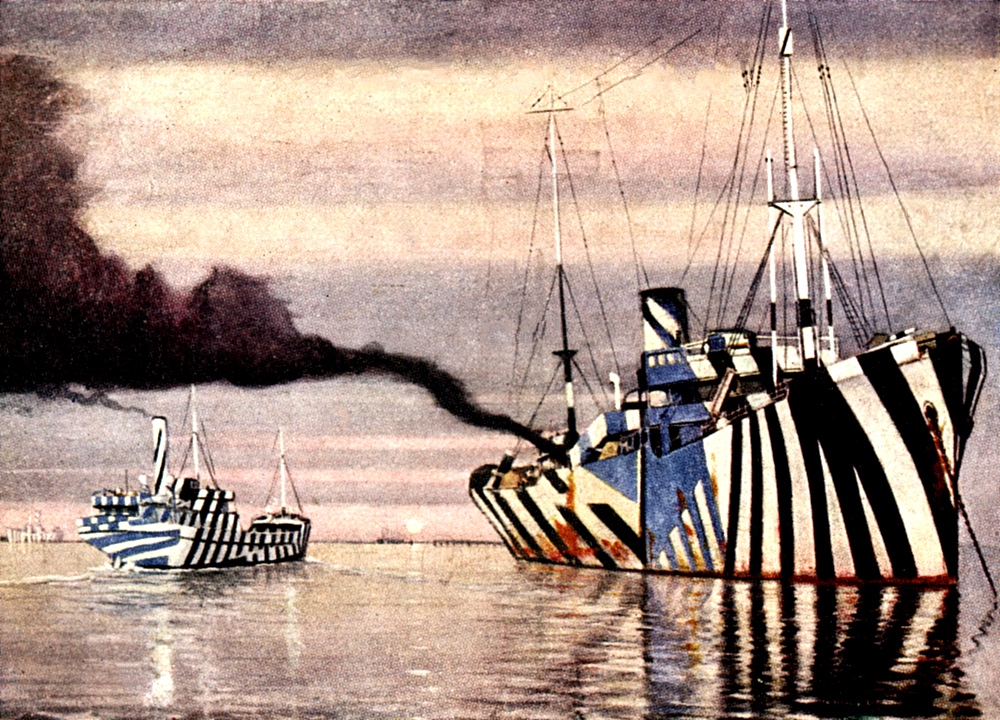
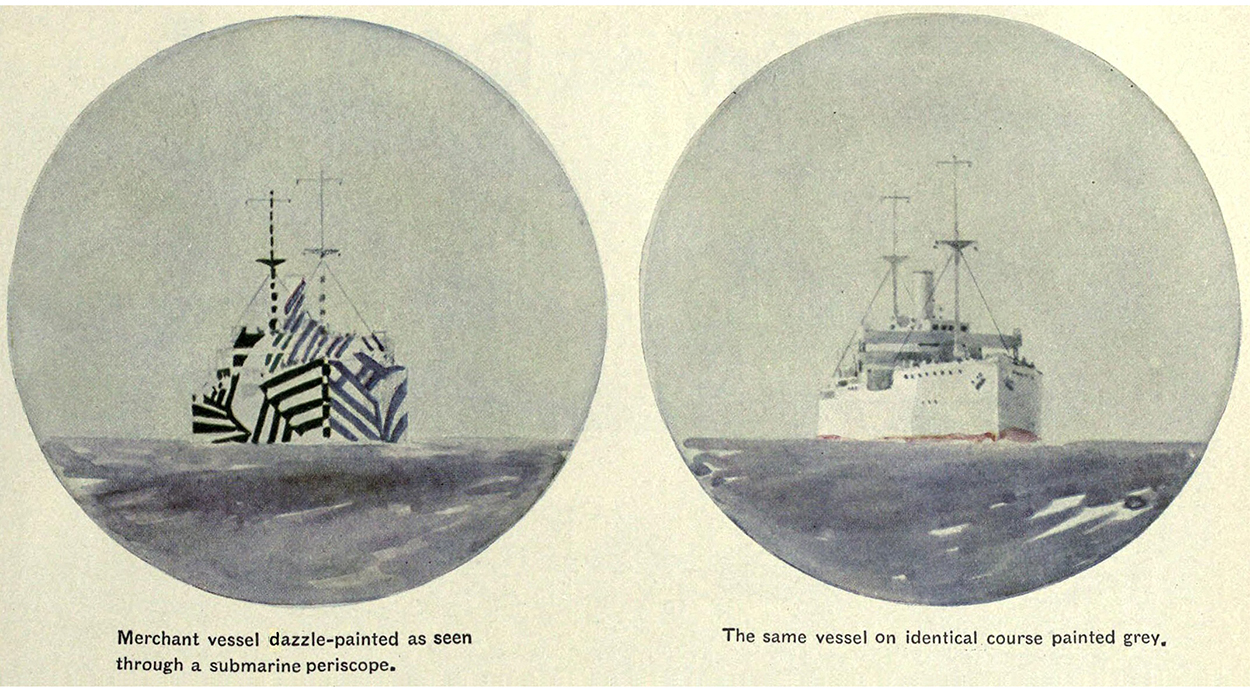
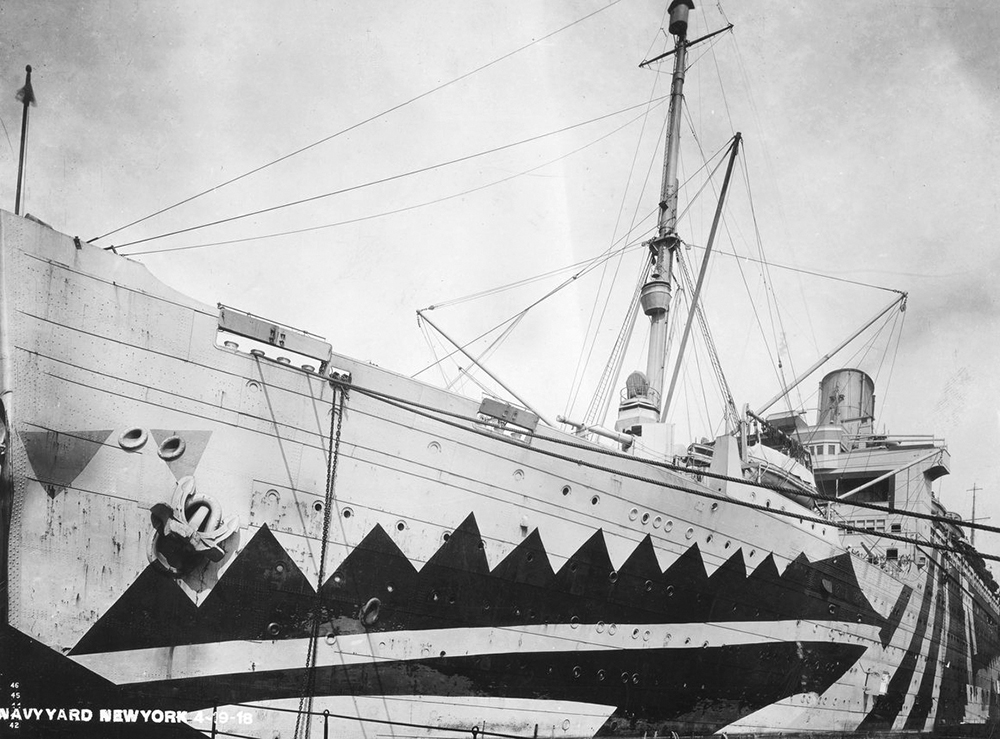
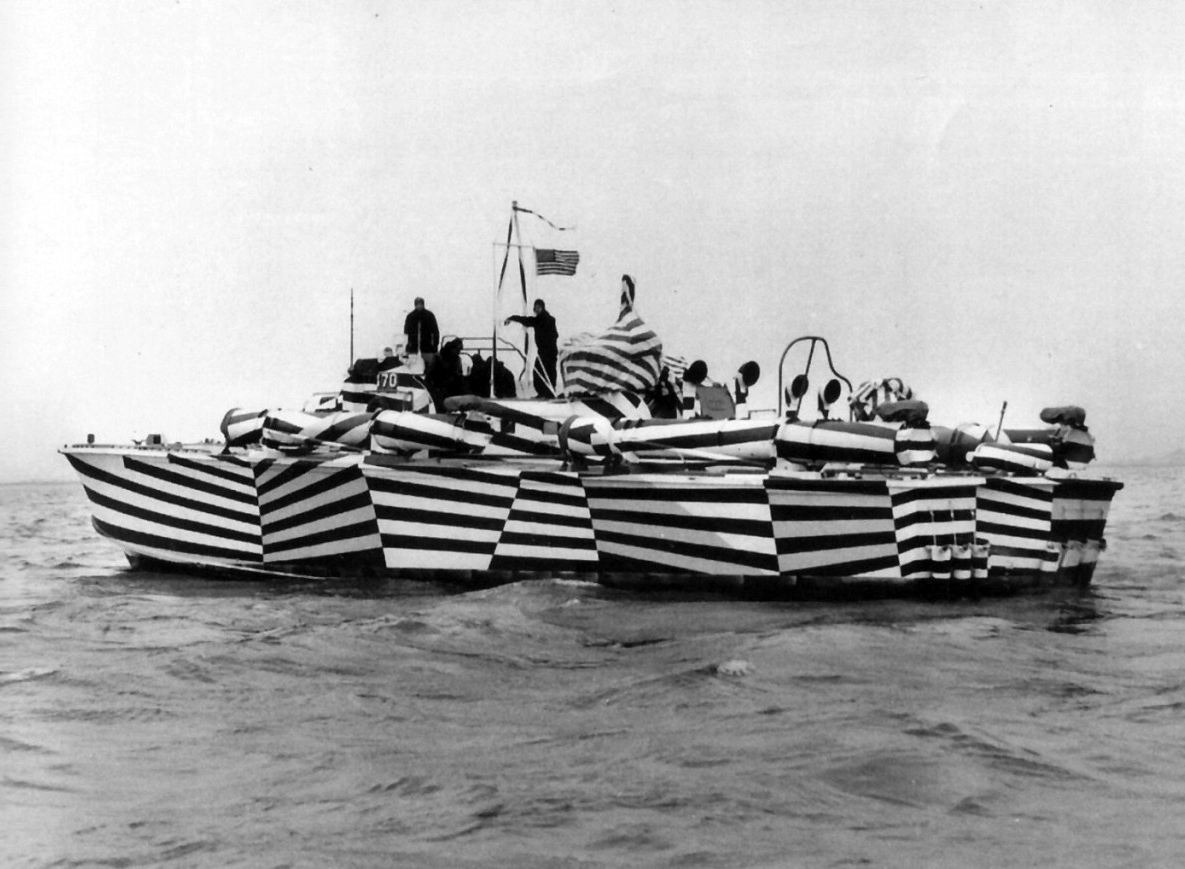
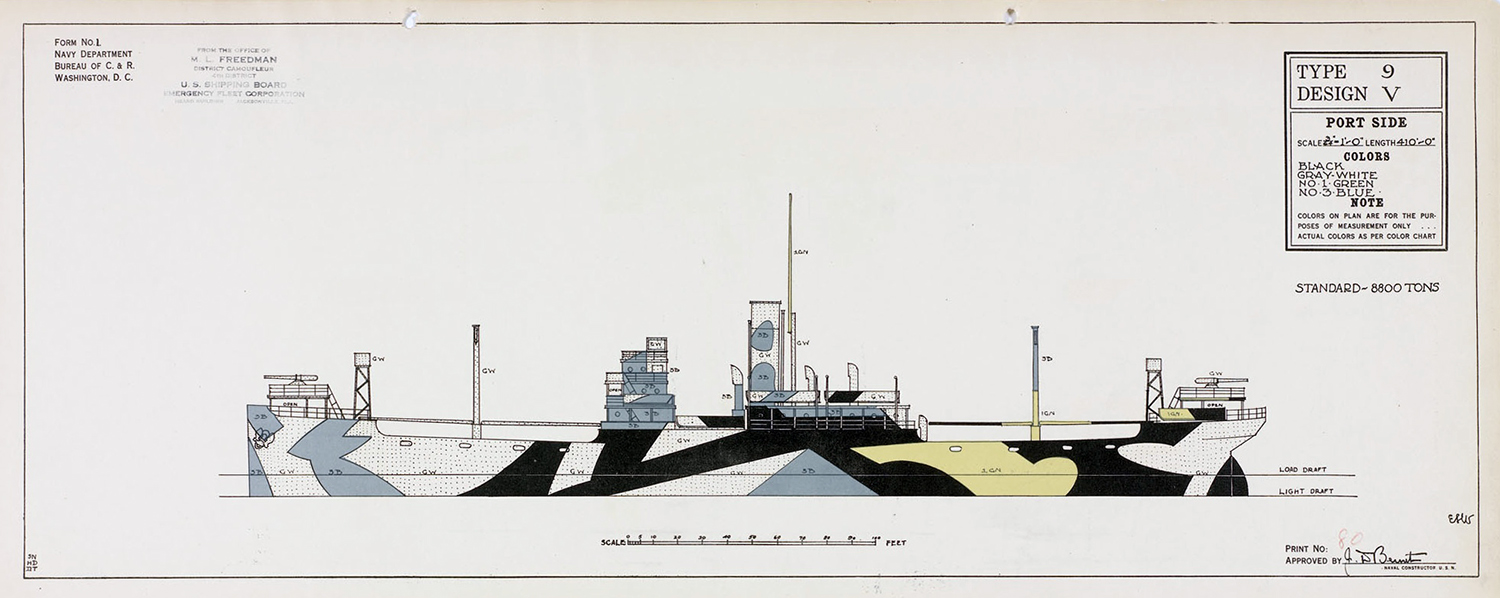
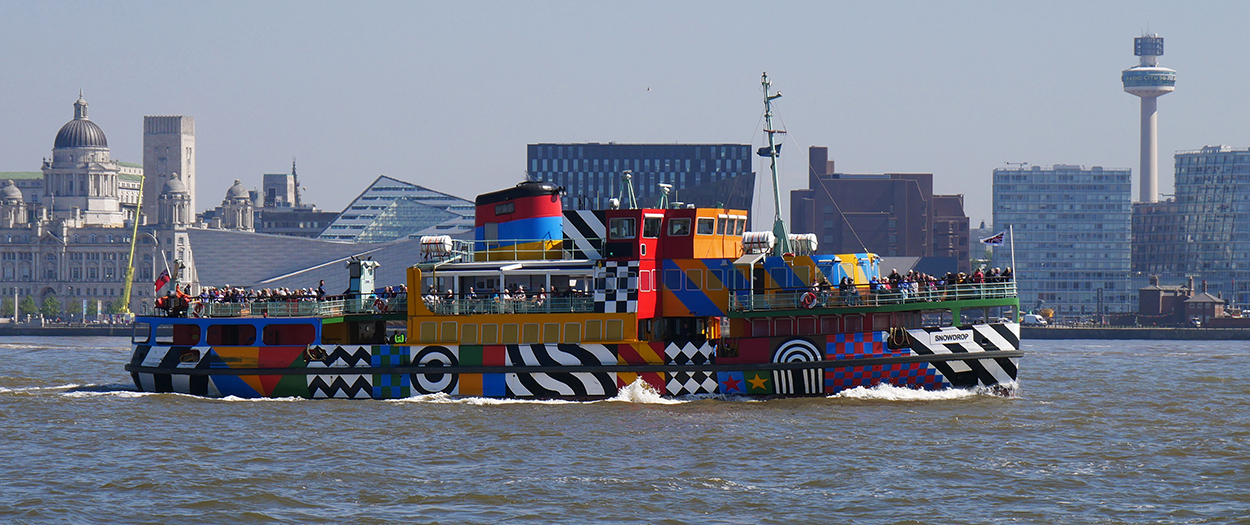
Dazzle painting (or razzle dazzle) was a World War I invention that was all about visual deception. Colors, patterns, lines and curved shapes were painted on ships to confuse enemy submarines. The effects were tested using models which where viewed from every angle, including through a periscope, to get an idea of how submarines would see them. The intention was to confuse attackers enough to make them miss, or to not even fire a torpedo at all. The 1918 painting above is by Burnell Poole. Picasso claimed that Cubists had invented dazzle camouflage, but the credit belongs to Norman Wilkinson, a British marine artist.

The photographs of these designs are all, of course, in black and white, but some strong color was often used.

Each ship had a unique scheme so that the enemy could not identify it by type.

I just had an idea. (Editor’s note: This doesn’t happen often.) Today, we might consider painting ships with some of those multi-colored pie charts from business presentations. They can confuse anyone.

Dazzle ferry
“Everybody Razzle Dazzle, 2015,” a design created by Peter Blake as part of a program to mark the centenary of World War I. A bold new look for the Mersey ferry “Snowdrop.”

Photograph: iStock.com/Alan Morris

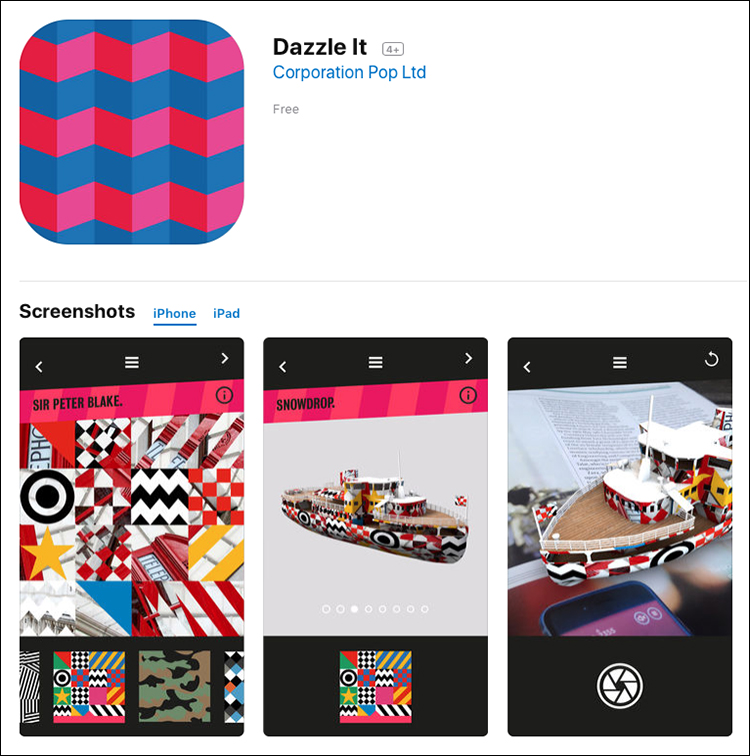
The project includes an app so that we can make our own dazzle patterns.

Pixelated
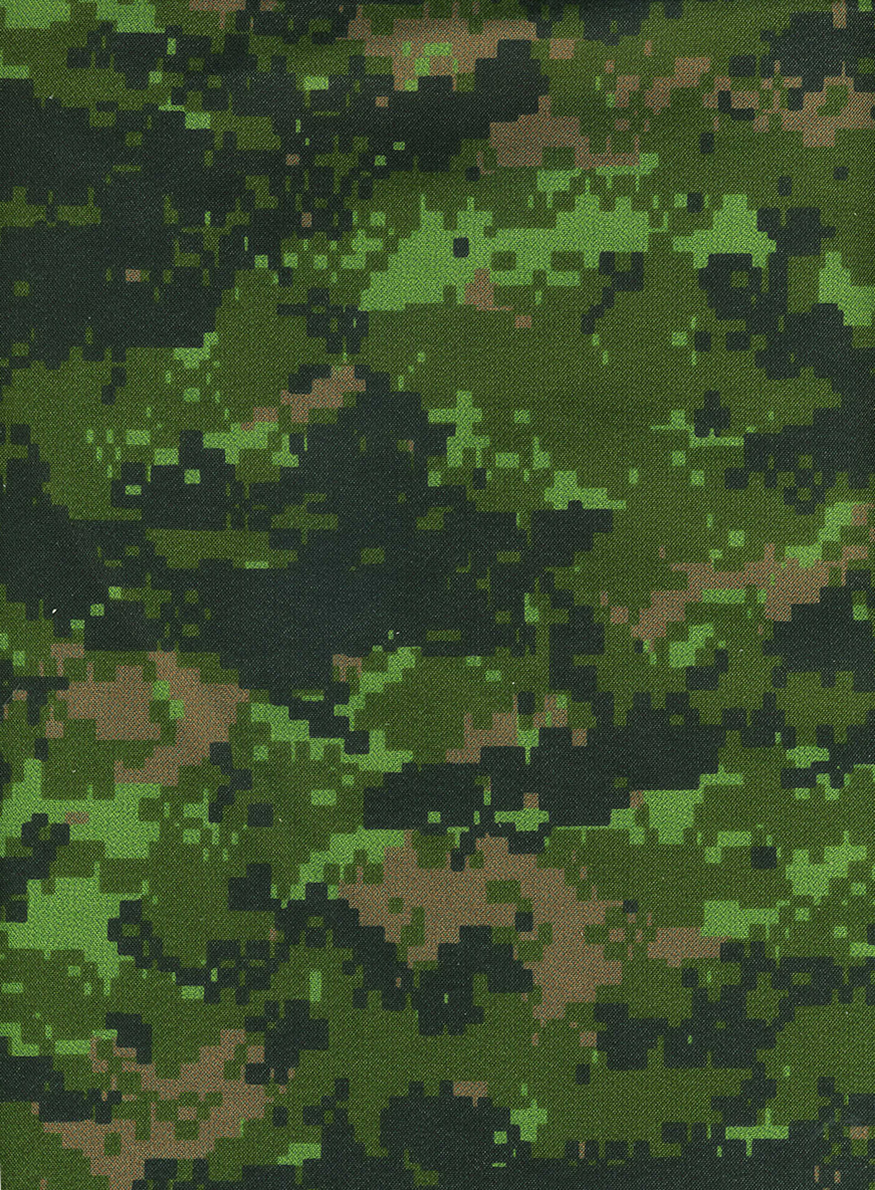
The Canadian armed forces were the first to use computer-generated camouflage, the Canadian Disruptive Pattern or CADPAT, which works well at different distances. There are three types: Temperate Woodland (TW) which is shown below, Arid Region (AR) and Winter/Arctic (WA).

OCP
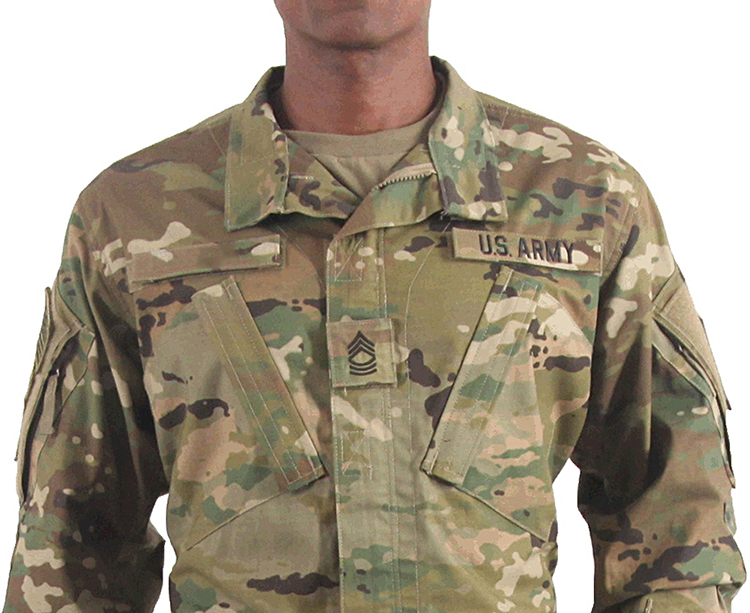
The Operational Camouflage Pattern is now the official combat design for U.S. soldiers.


Photograph: U.S. Army

If you want to know more about this subject, try the encyclopedia of camouflage (yes, there is one): http://camopedia.org/

Money

THE DESIGN OF CURRENCY.

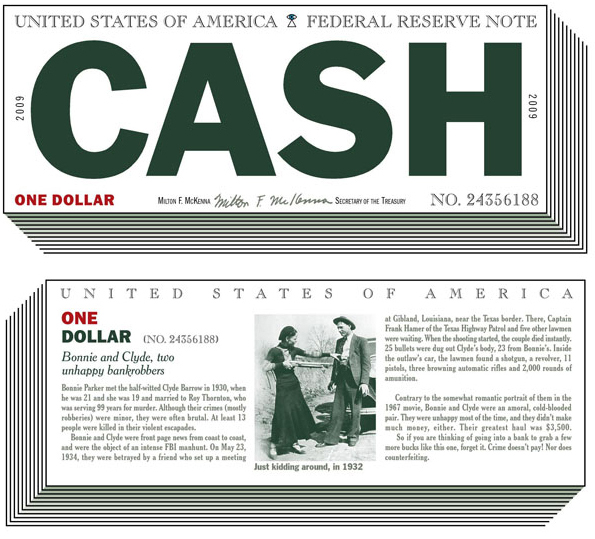
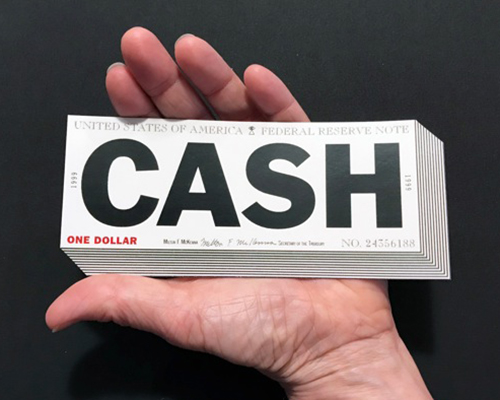
Cash illusion
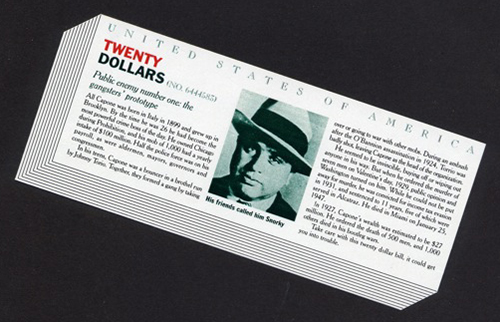
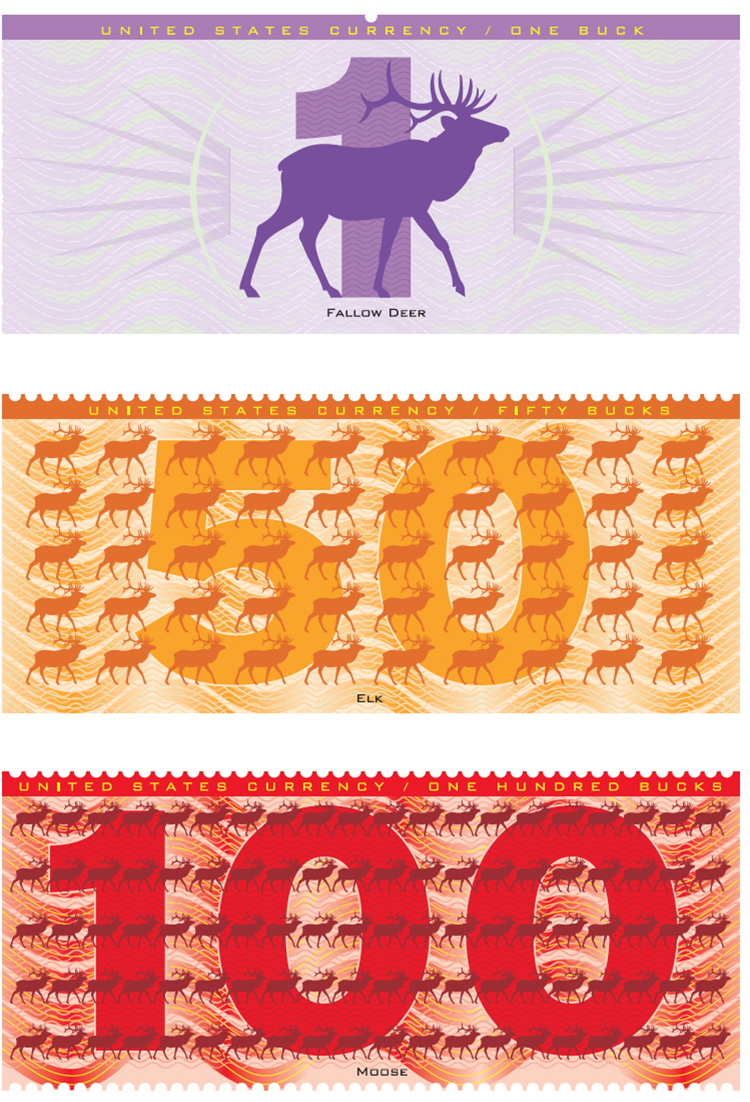
Nigel Holmes’ radical redesign of U.S. banknotes makes our money look like more than it is.
And instead of presidents, we have people who robbed banks.

Coin mania
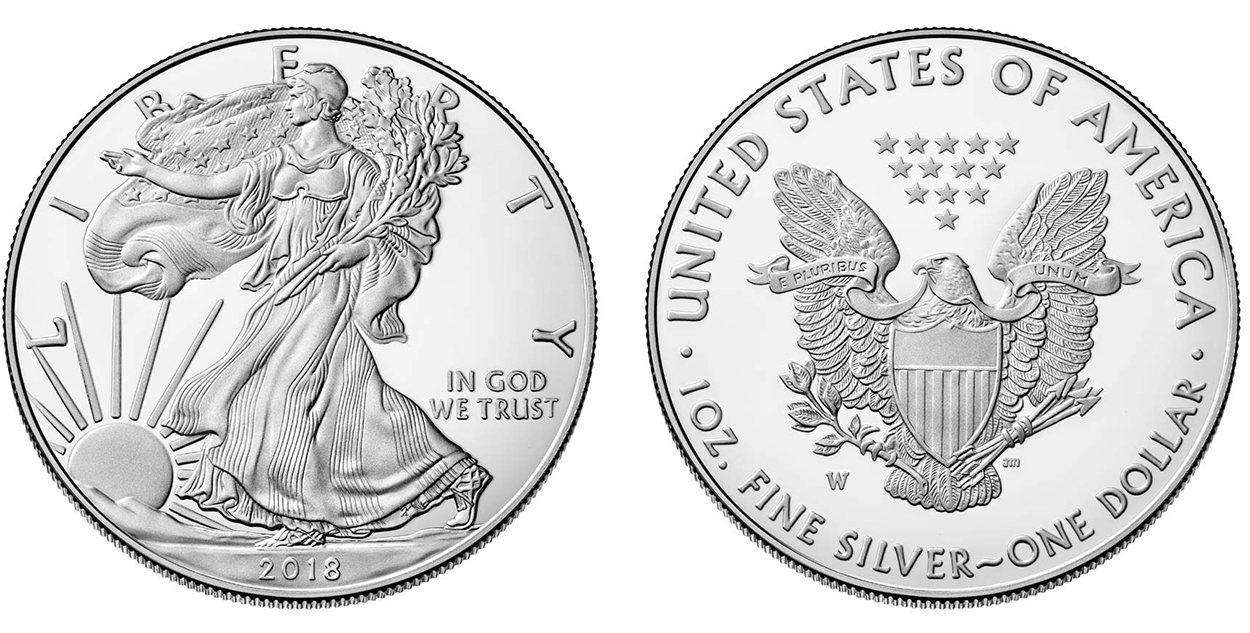
There are millions of coin collectors in the U.S., and consequently several cable T.V. shows that just sell coins. This is a 2018 Proof Silver American Eagle that uses the classic 1916 “Walking Liberty” design by Adolf Weinman.

Infographic coins
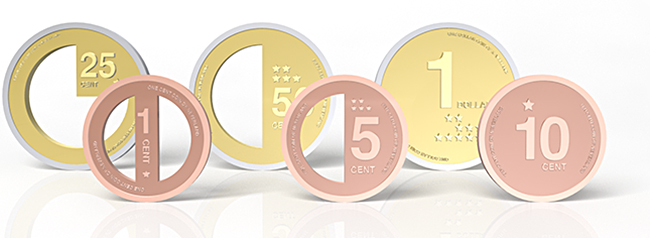
Mac Funamizu explored the idea of coins being designed to be more informational and represent their relative value.

More bang for your buck
Another rethink of US currency by Nigel Holmes.

Euro architecture
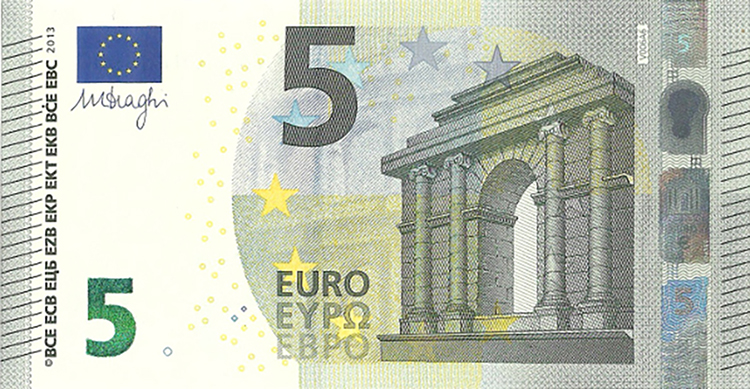
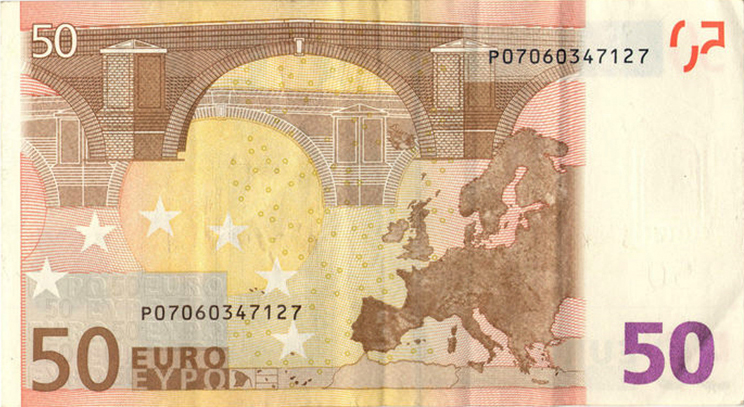
The buildings on Euro notes are generic so that they are not specific to any country in the European Union. There are seven fictional bridges used on various notes. Robin Stam had the idea of creating real versions, and a housing development in Spijkenisse, which is near Rotterdam, offered to build all of them.

Big money
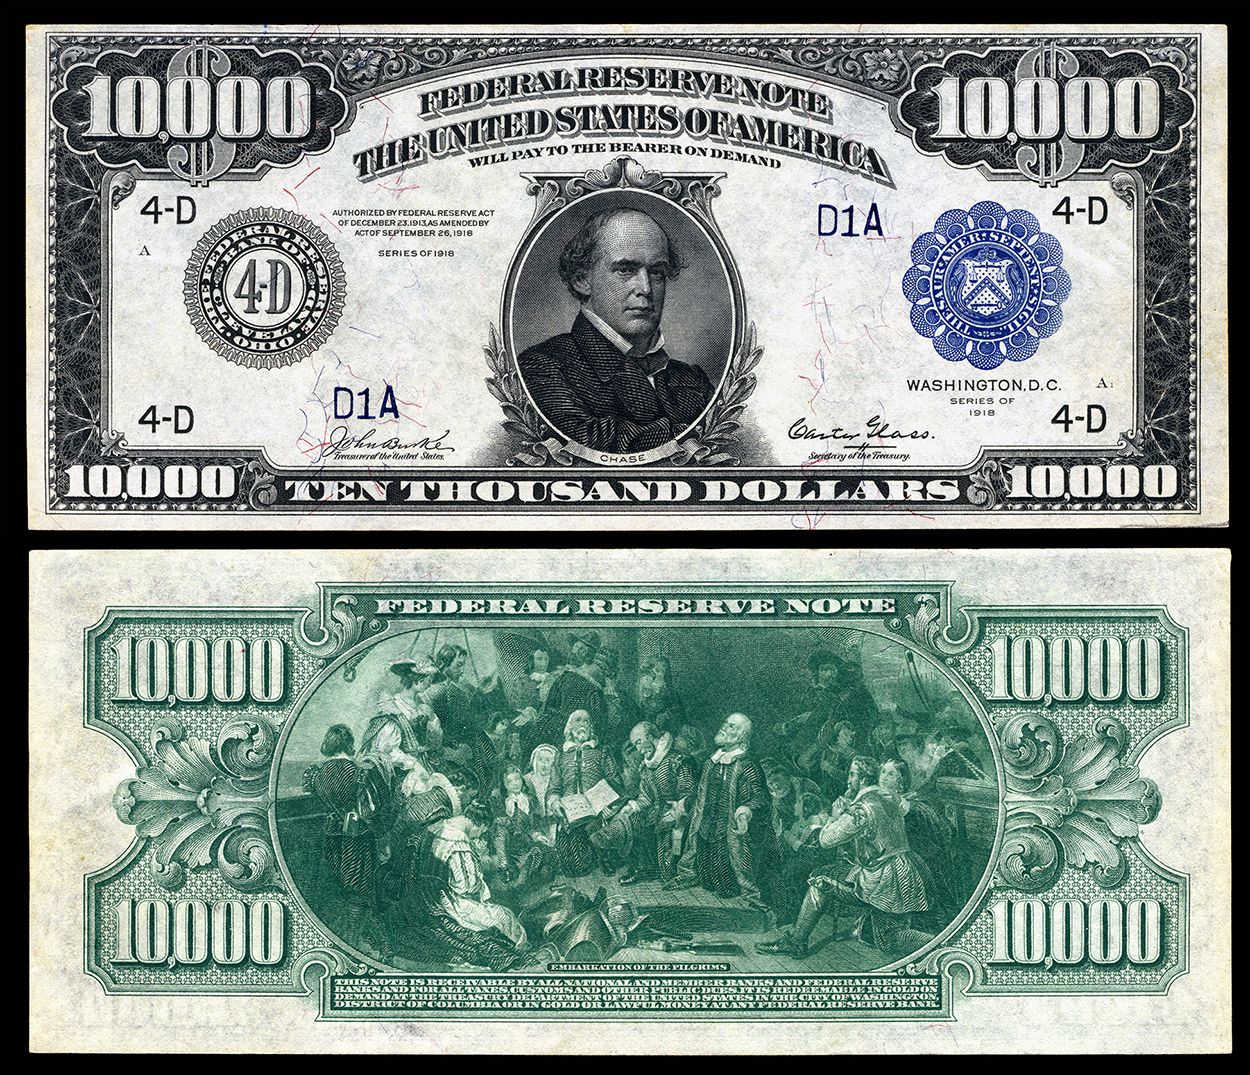
High-denomination U.S. notes have not been printed since 1947. The low number still in existence are owned by collectors and museums.

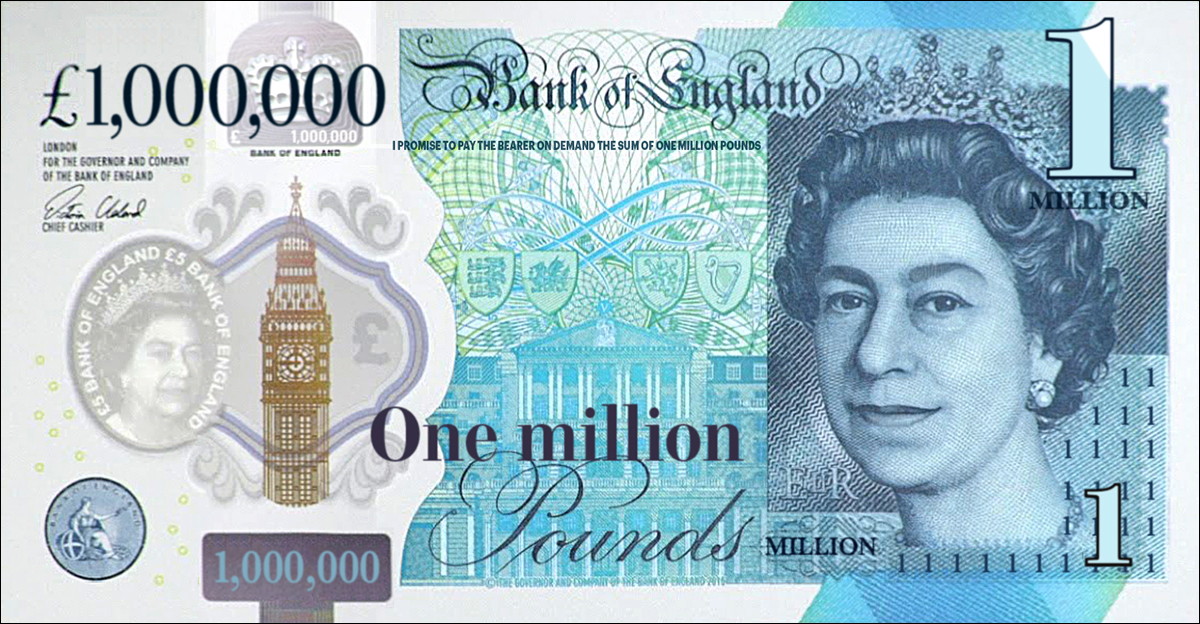
This valuable item appeared in a previous post about Eight by Eight magazine. I adapted it from the polymer £5 note. (Australia had the first plastic money back in 1988.) The largest U.K. note is £100, issued in Scotland and Northern Ireland only.

Hyperinflation
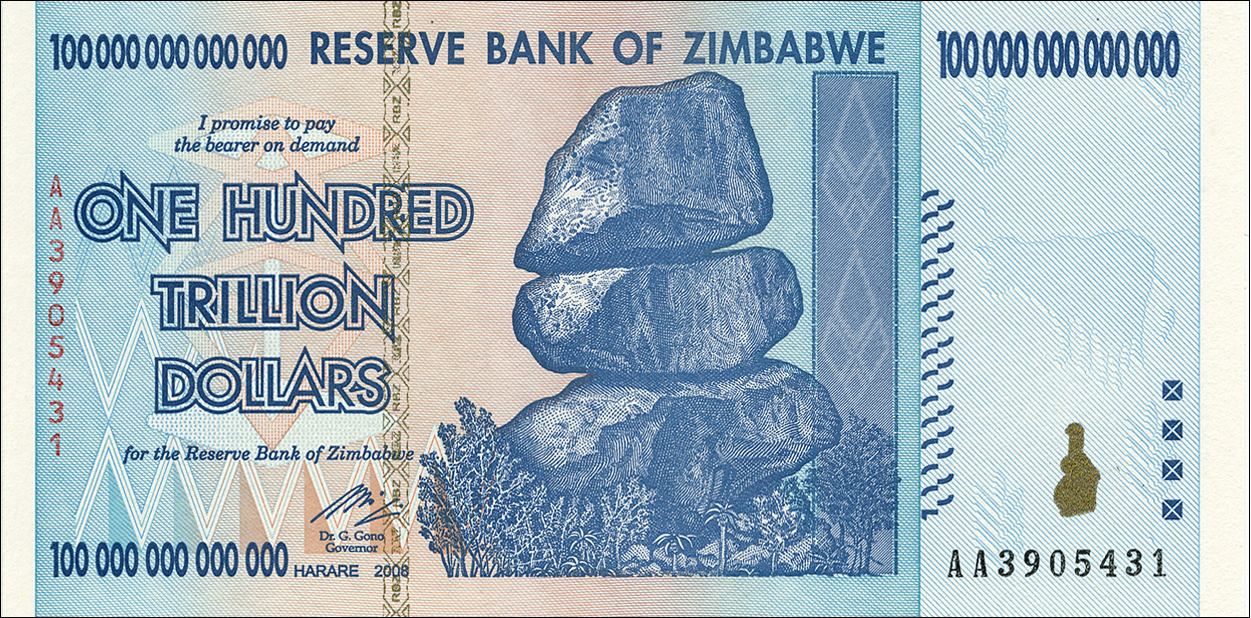
During November 2008, inflation in Zimbabwe is estimated to have hit 80 billion percent. By 2009, all printing of currency was stopped.

The Queen

HER MAJESTY’S INFOGRAPHICS.

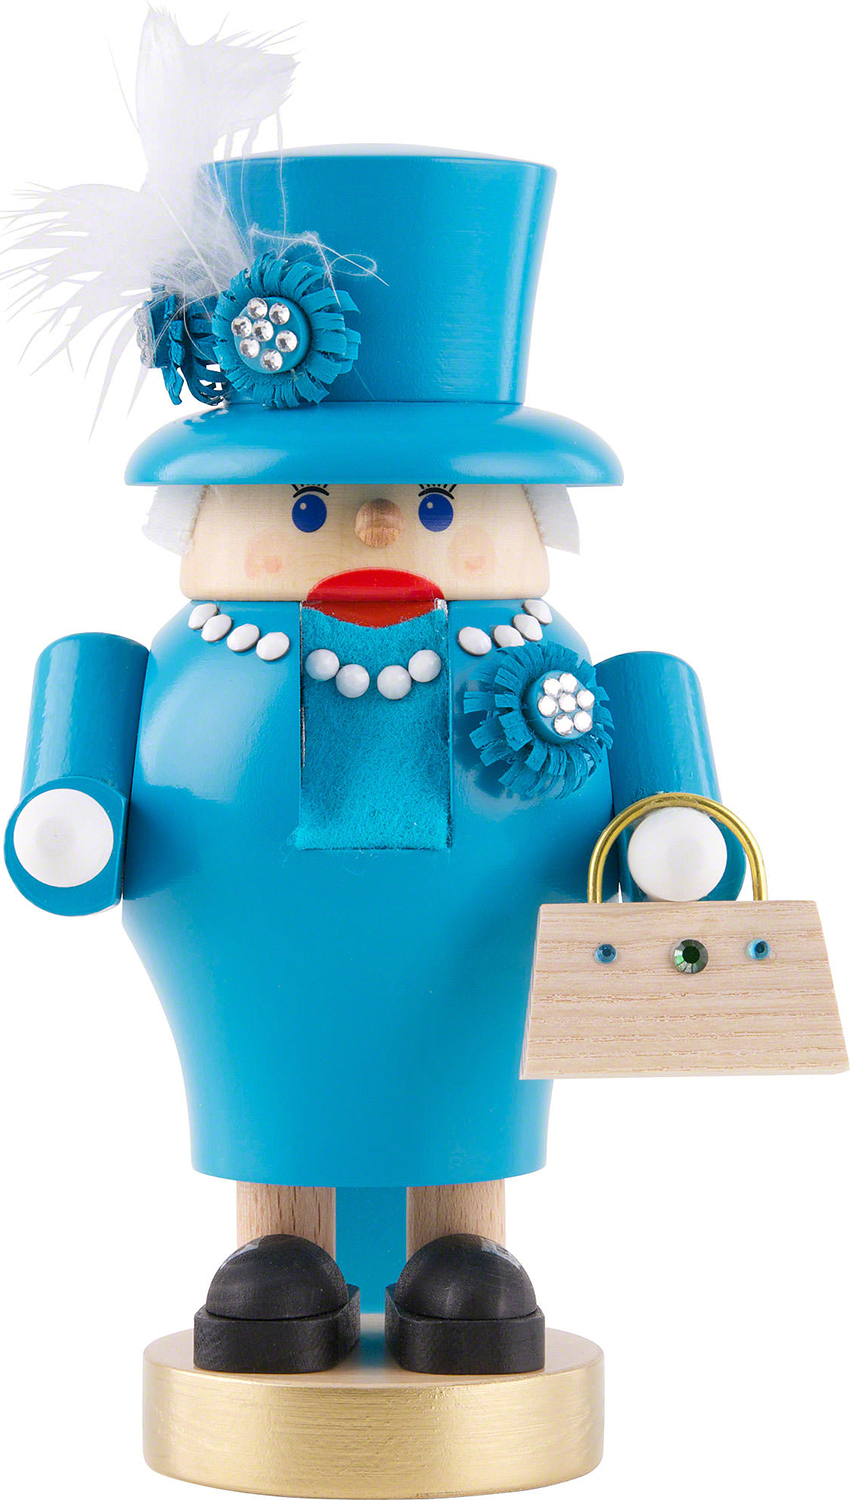
One of my students recently gave me this holiday season gift. Queen Elizabeth II, the nutcracker version. This is obviously a frivolous portrait, but an affectionate one too. Many people in the United Kingdom (and elsewhere) have a lot of respect for our 91-year-old monarch. And naturally a person with this level of attention is the subject of many graphics.

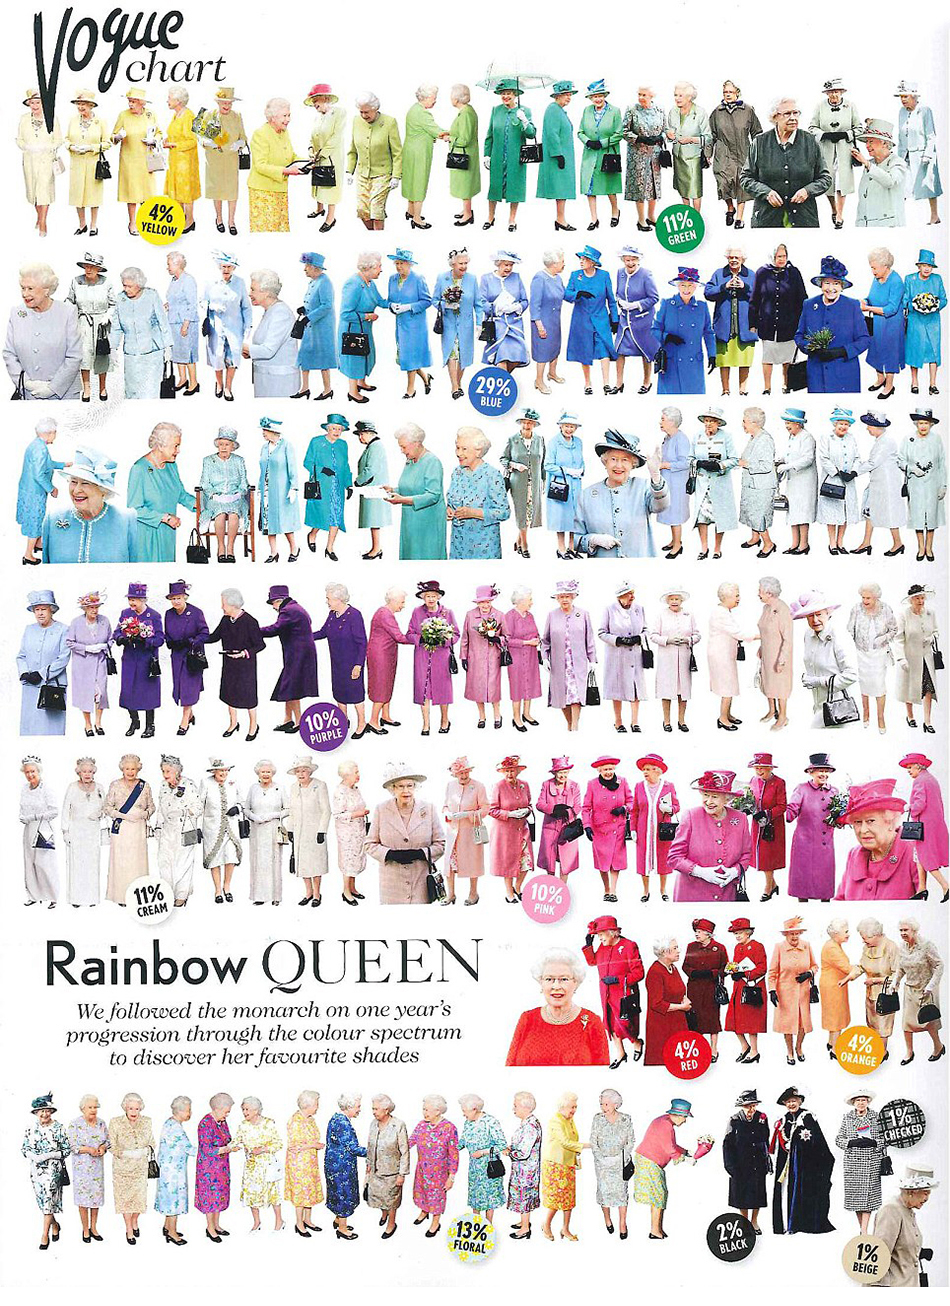
Color chart
Royal outfit data visualized in Vogue magazine. Blue is the favorite color.

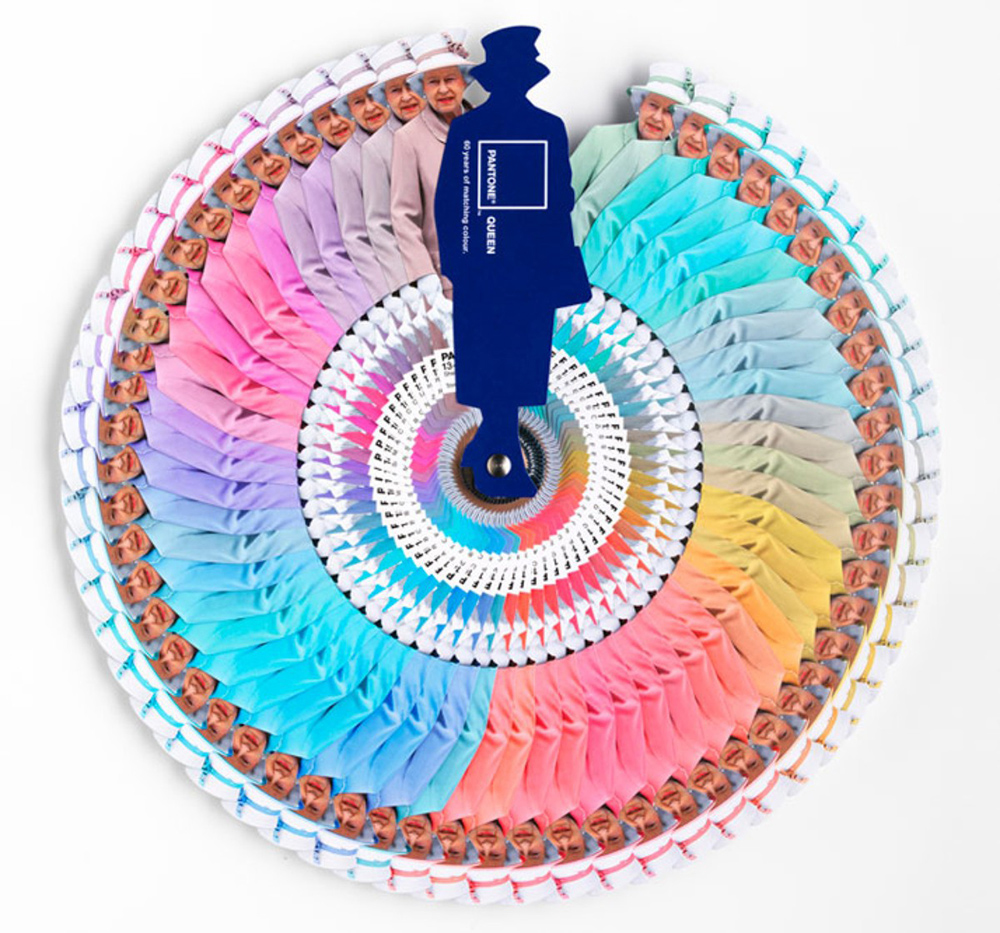
Pantone Queen
For the monarch’s Diamond Jubilee, Pantone and Leo Burnett London collaborated on a royal color selector.

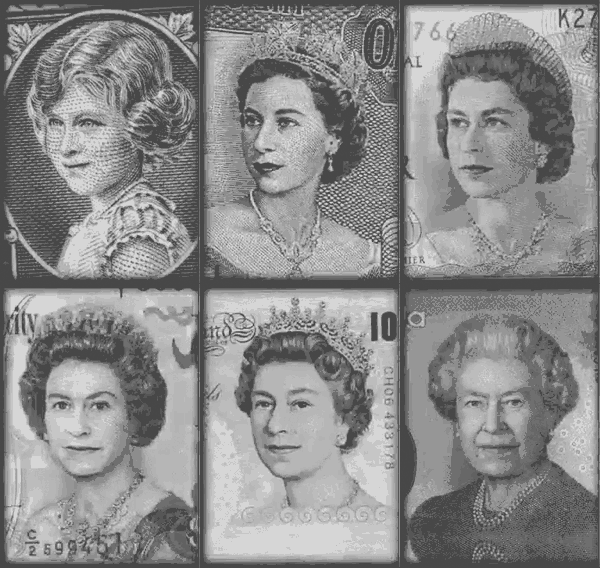
Royal timeline
Portraits on banknotes. The queen has reigned for 66 years.

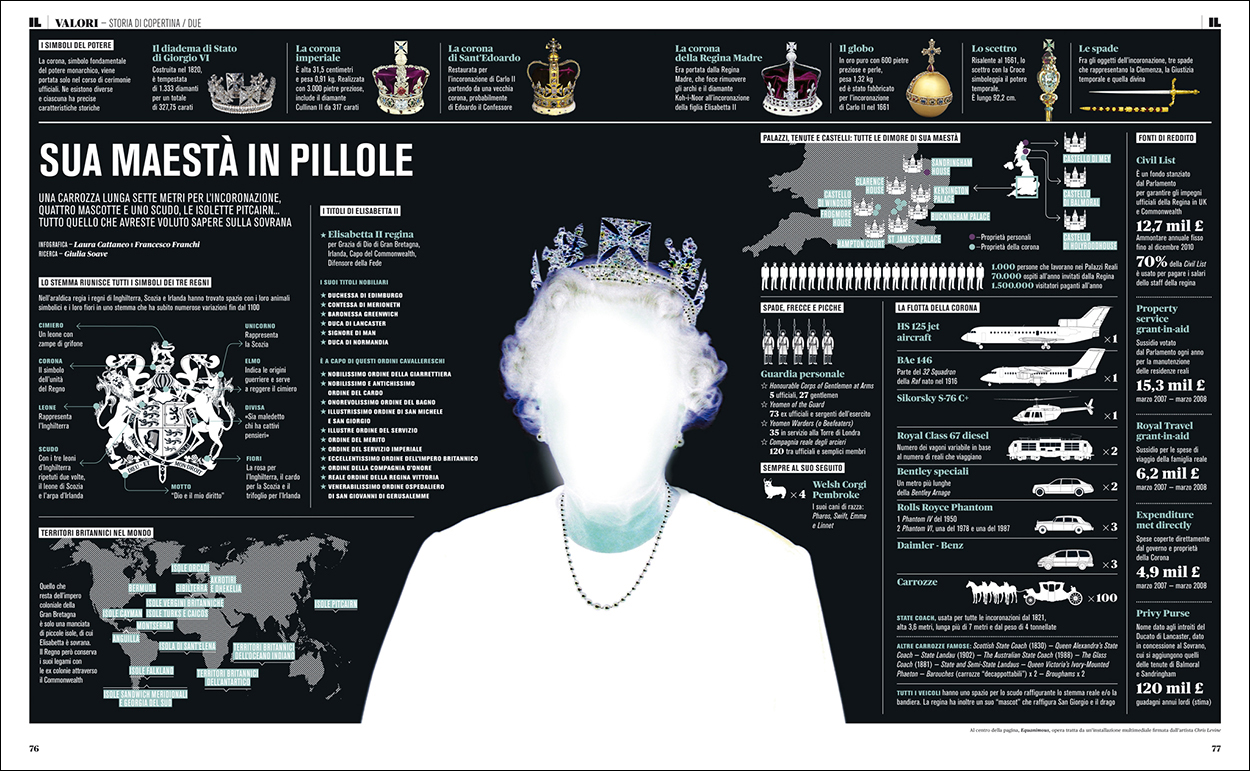
Being royal
Queen Elizabeth’s world. Infographic by Laura Cattaneo and Francesco Franchi for “IL” magazine. Click on the image for a larger version.

Crown Jewels
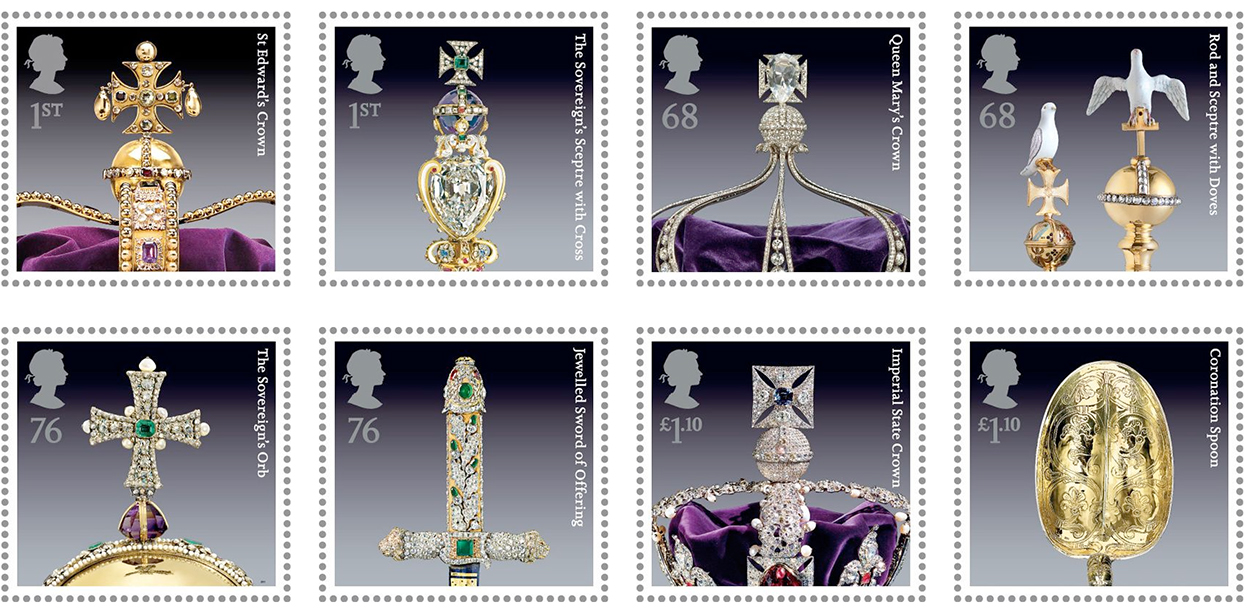
The collection (a total of 140 items) is estimated to be worth at least £3 billion pounds ($4.26 billion). They’re kept in the Tower of London. Some examples are shown in this set of well-designed Royal Mail stamps.

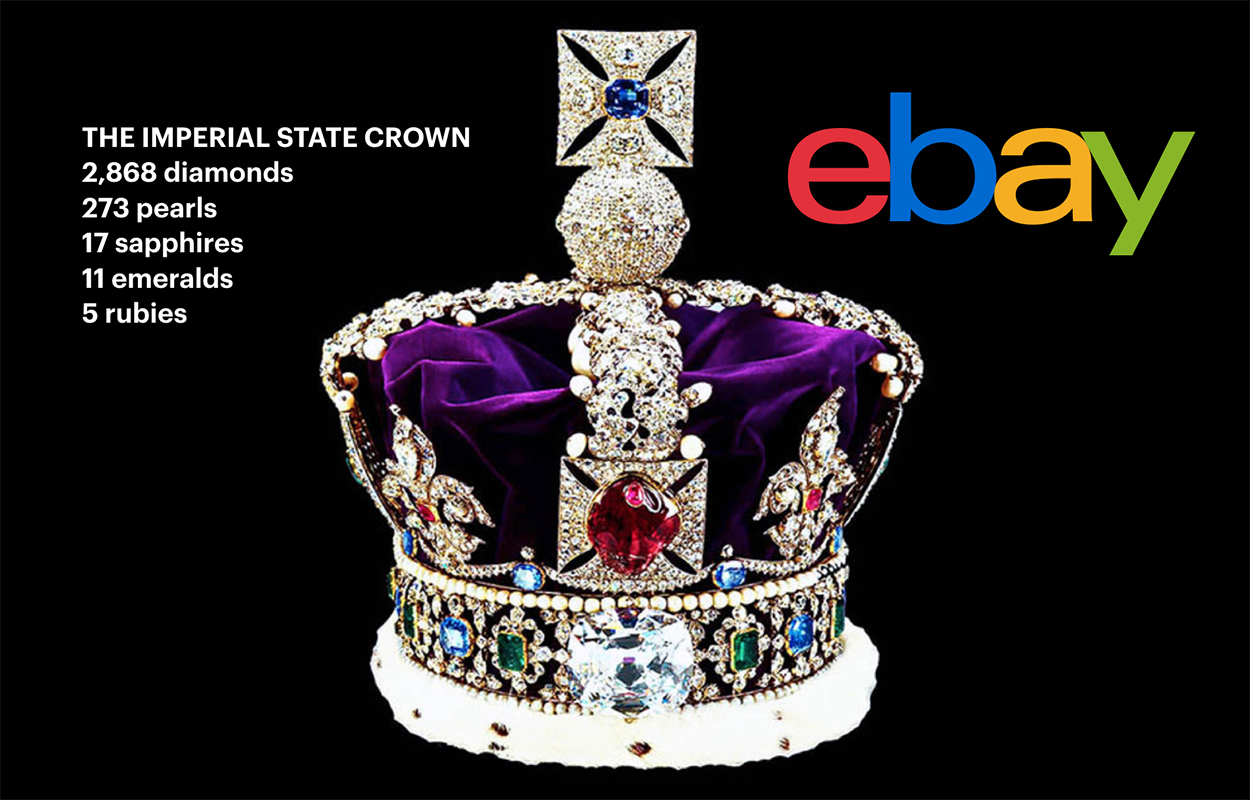
If the Queen ever runs short of cash, this should do the trick.

The world’s worst typefaces

FIVE FONTS WE DON’T LOVE.
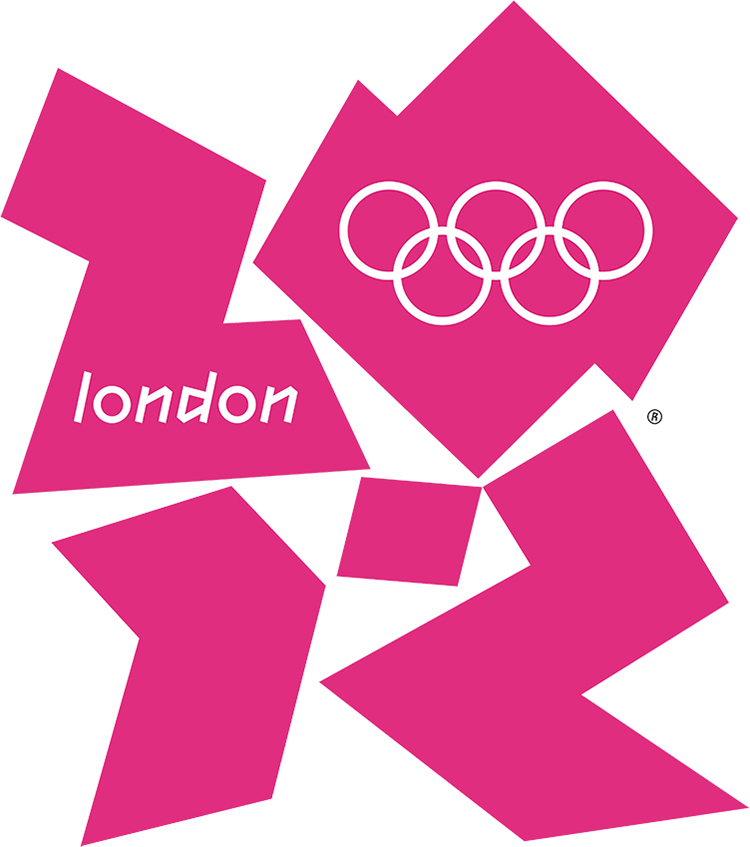
Above, the ugly London Olympic logo, which contains a sample of the world’s worst typeface. More about that later.
The following ranking is from Simon Garfield’s book, “Just My Type,” which is an insightful and fun read for anyone who cares about typography: goo.gl/fX9nni
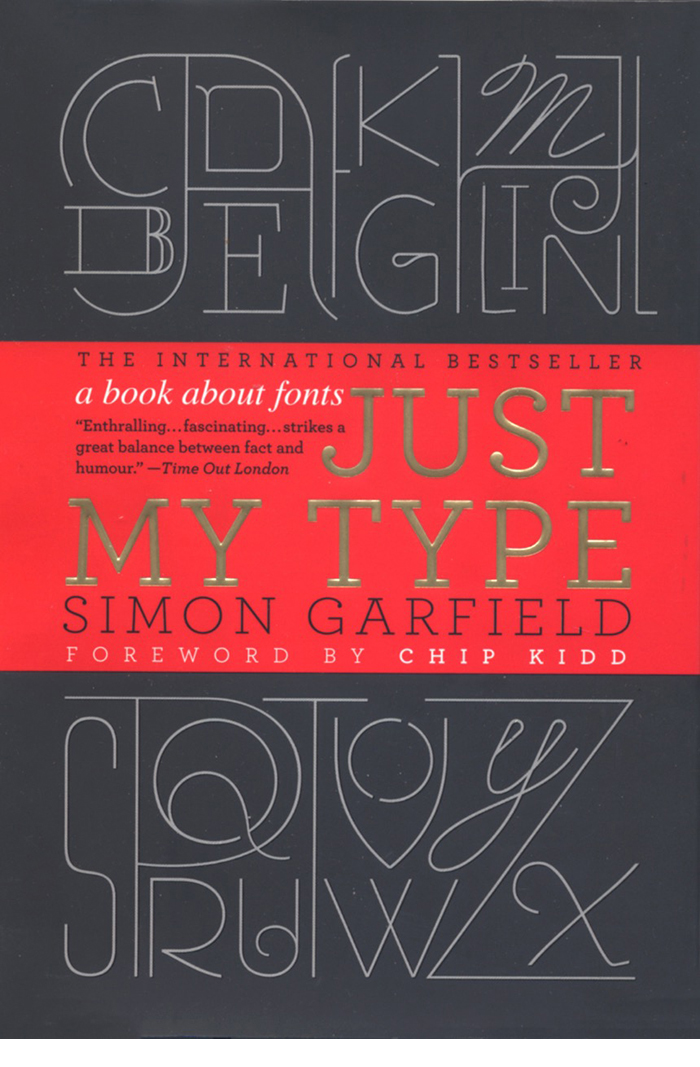
THE WORST FIVE (IN REVERSE ORDER)

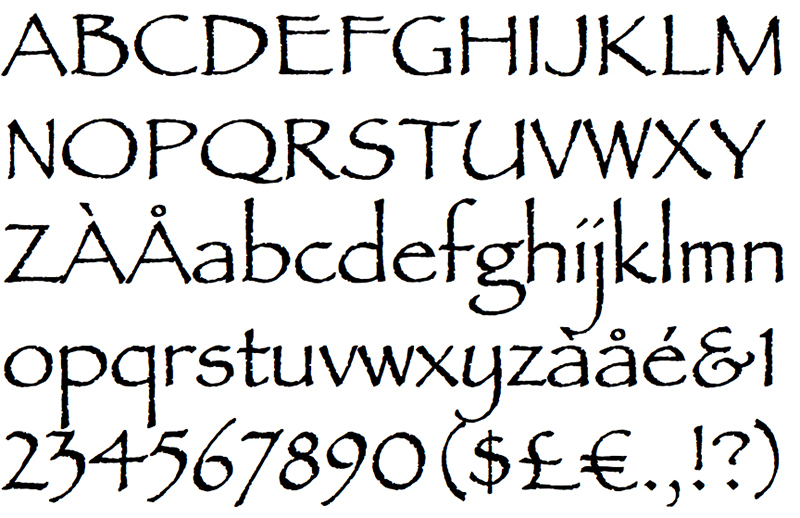
5: Brush Script My students know that I’m not a fan of fonts that mimic handwriting. To be fair, there are some good ones, but many are badly designed, and will devalue any infographic they’re slapped onto. Not exactly the language of credibility when used in a serious visual explanation. Simon: “…if you ever even momentarily considered putting Brush Script on any document at all, even in an ironic way, then you should immediately relinquish all claims to taste.”

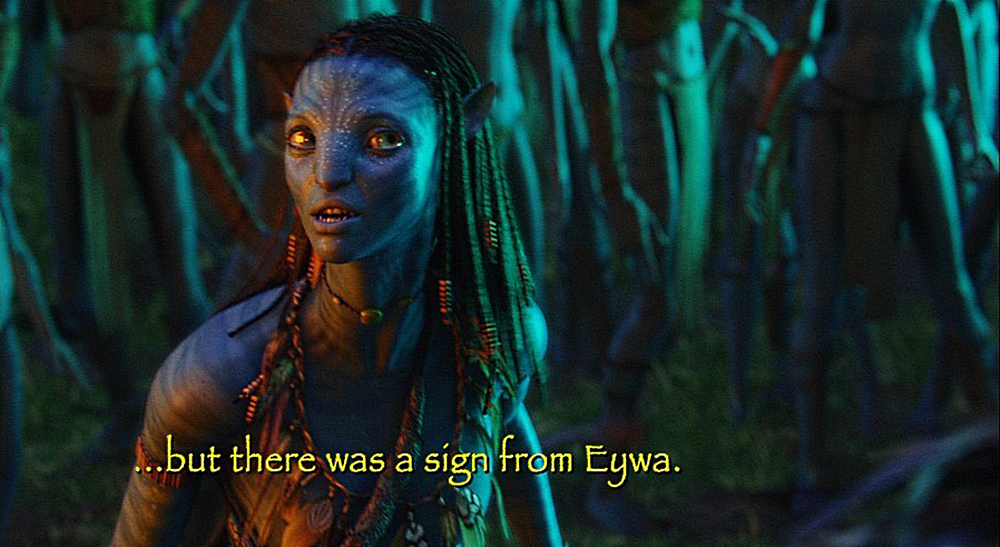
4: Papyrus Simon: “Papyrus is the font you use to spell out the the word Egypt.” A modified version is used on this Avatar poster, but it appears in it’s standard form in the Na’vi subtitles. Recently panned by “Saturday Night Live.” goo.gl/wwPBa3
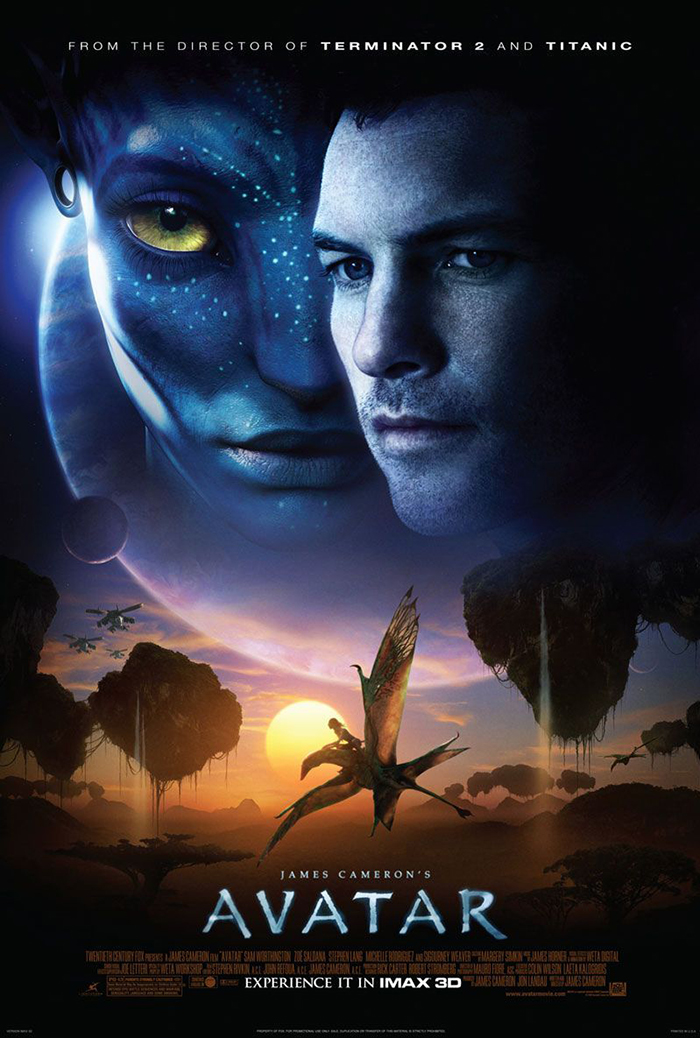

© 20th Century Fox

Simon: “Avatar cost more to make than any other film in history, but it did its best to recoup whatever it spent on 3-D special effects and computer-generated blue people by using the cheapest and least original font it could find.”
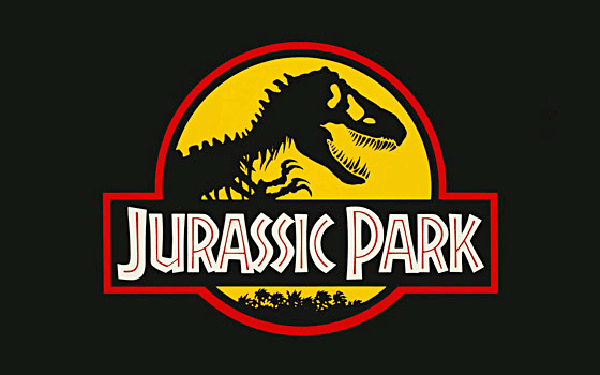
3: Neuland Inline Jurassic Park was ahead of it’s time, but the font it used was not. Simon: “It is a dense and angular type, suggestive of something Fred Flintstone might chisel into prehistoric rock.”
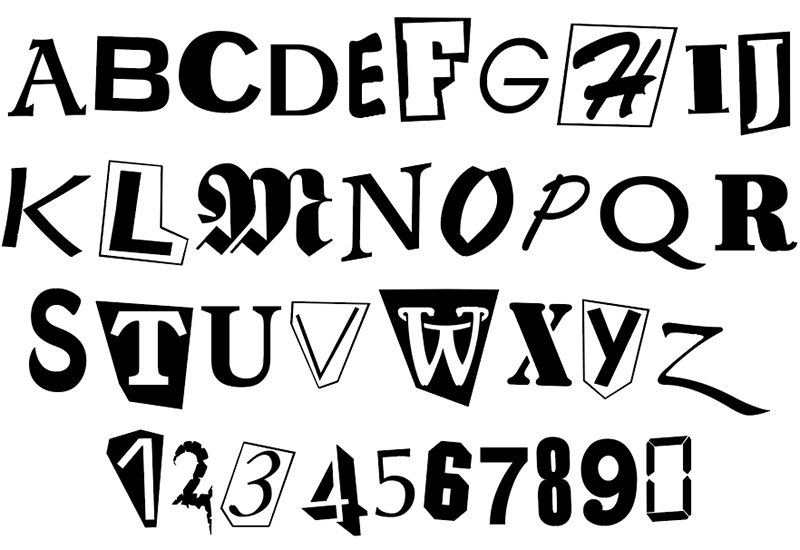
2: Ransom Note. Simon doesn’t feel that this font is any good for ransom notes. Having none of “…a genuine ransom note’s sweat, glue, and menace…”
1: The London Olympic 2012 typeface It’s official name is 2012 Headline. The font is intended to be edgy (I suppose), but that’s always a dangerous path to negotiate. It ended up being downright awful, and became dated in a very short time (maybe a couple of weeks). Simon: “…the worst new public typeface of the last hundred years.”
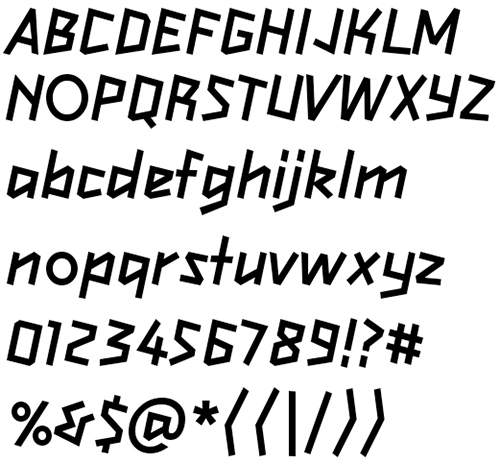
From the book: In the International Herald Tribune, Alice Rawsthorn observed that “it looks increasingly like the graphic equivalent of what we Brits scathingly call “dad dancing”—namely a middle-aged man who tries so hard to be cool on the dance floor that he fails.” And finally, my personal comment on the London Olympic logo:

Microscopic

THE WORLD THROUGH A MICROSCOPE.

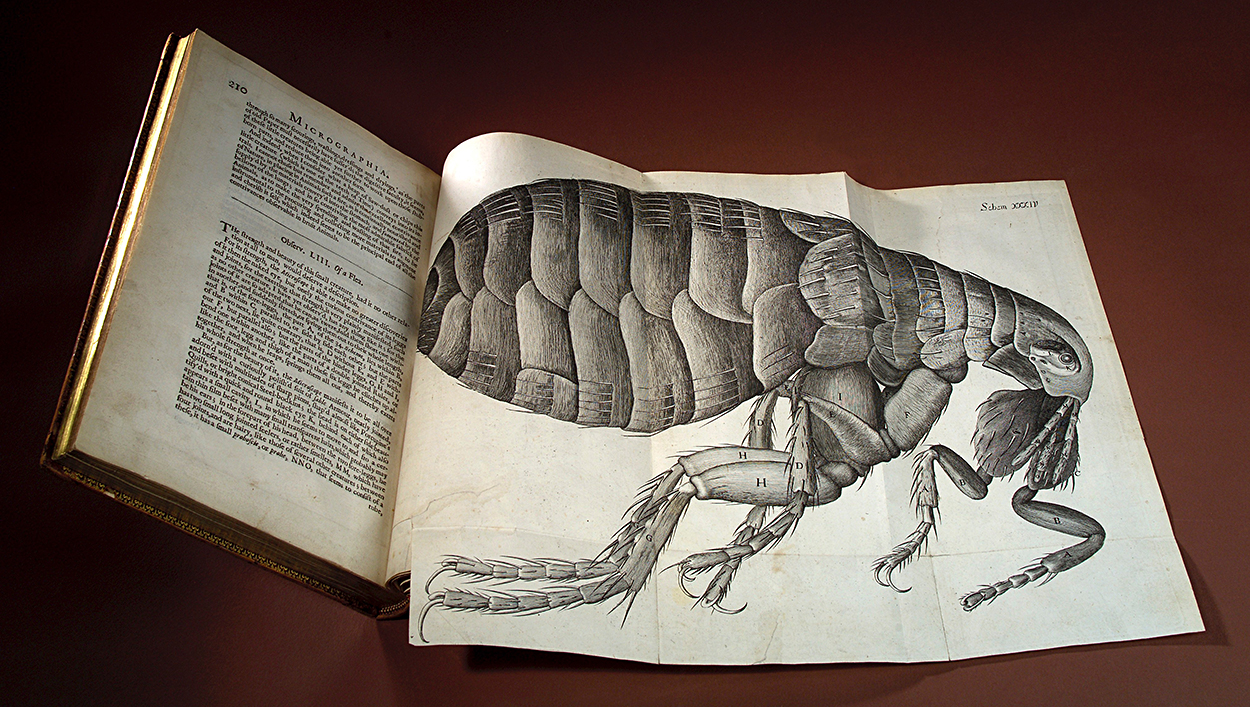
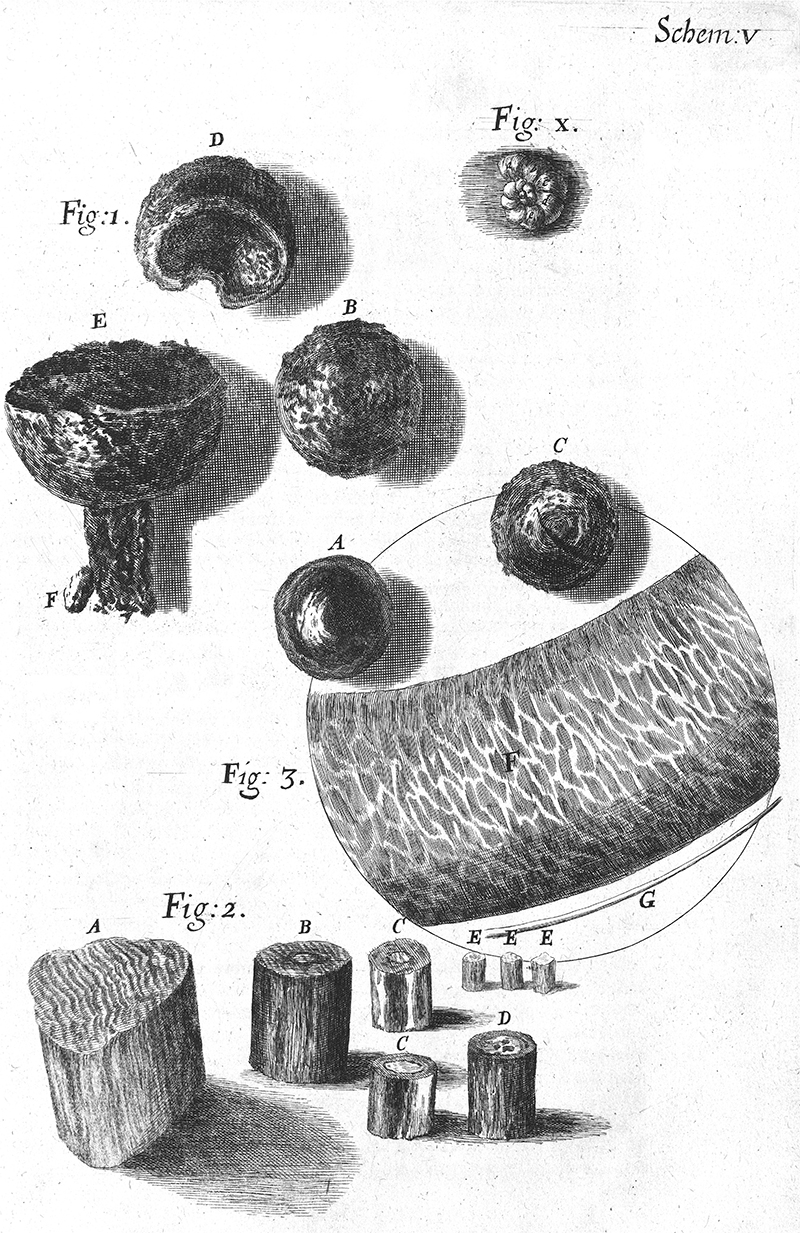
It’s not easy for us to imagine the impact that “Micrographia” had back in 1665. This giant-sized flea probably shocked the reader. It was the first time that people were able to see the secrets of the natural world in such magnified detail. Robert Hooke was an architect and scientist, and his precise illustrations were a leap into the everyday micro world. By the way, the book contains the first use of the word “cell.”
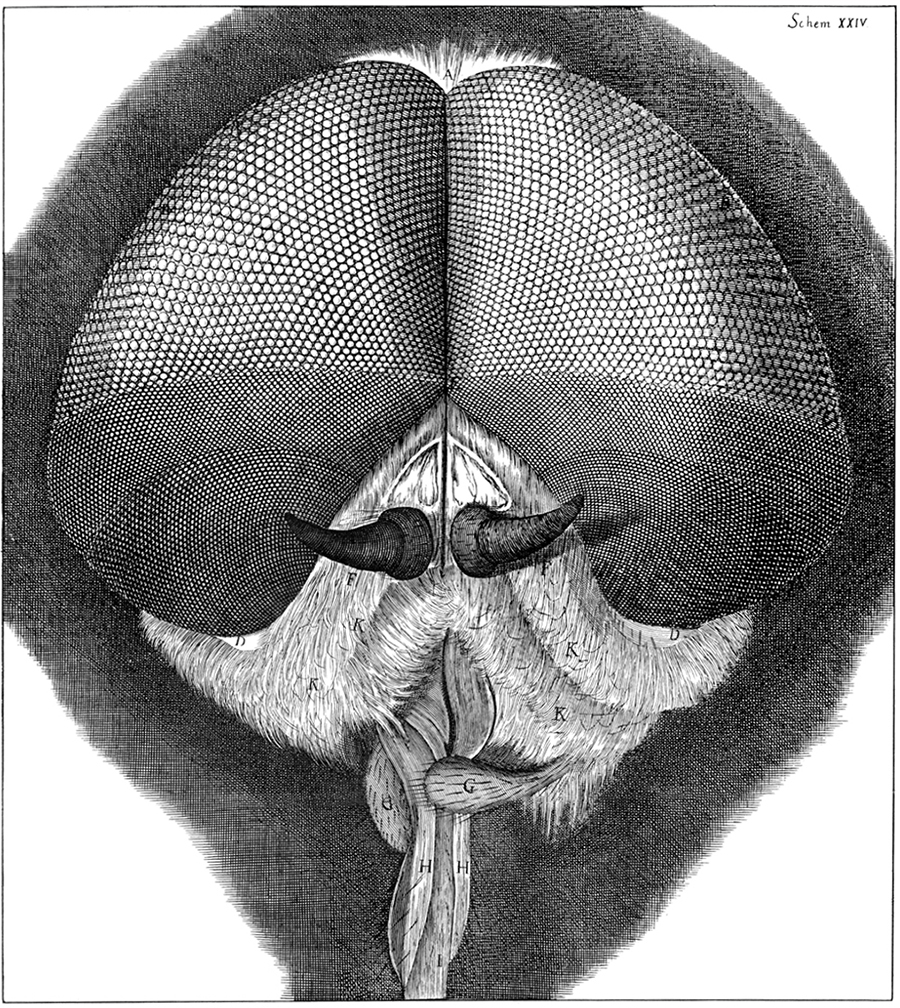
(Images from the Welcome Collection.)

The head of a grey dronefly.

Sparks of fire struck from flint and steel.

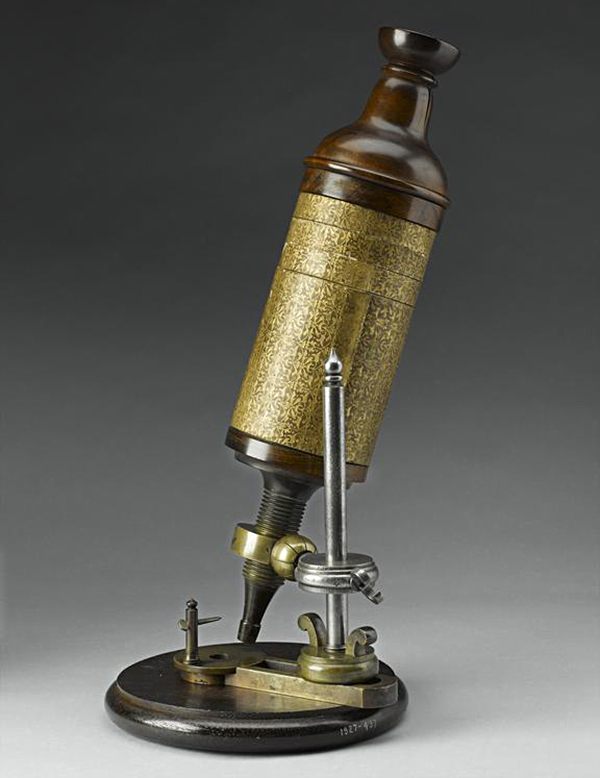
A copy of Hooke’s first compound microscope is in the British Museum.

Modern magnification
Now we’re used to seeing very high-power magnifications of all kinds of things. This image of pollen was created by an electron microscope.


Photograph by the Dartmouth College Electron Microscope Facility.

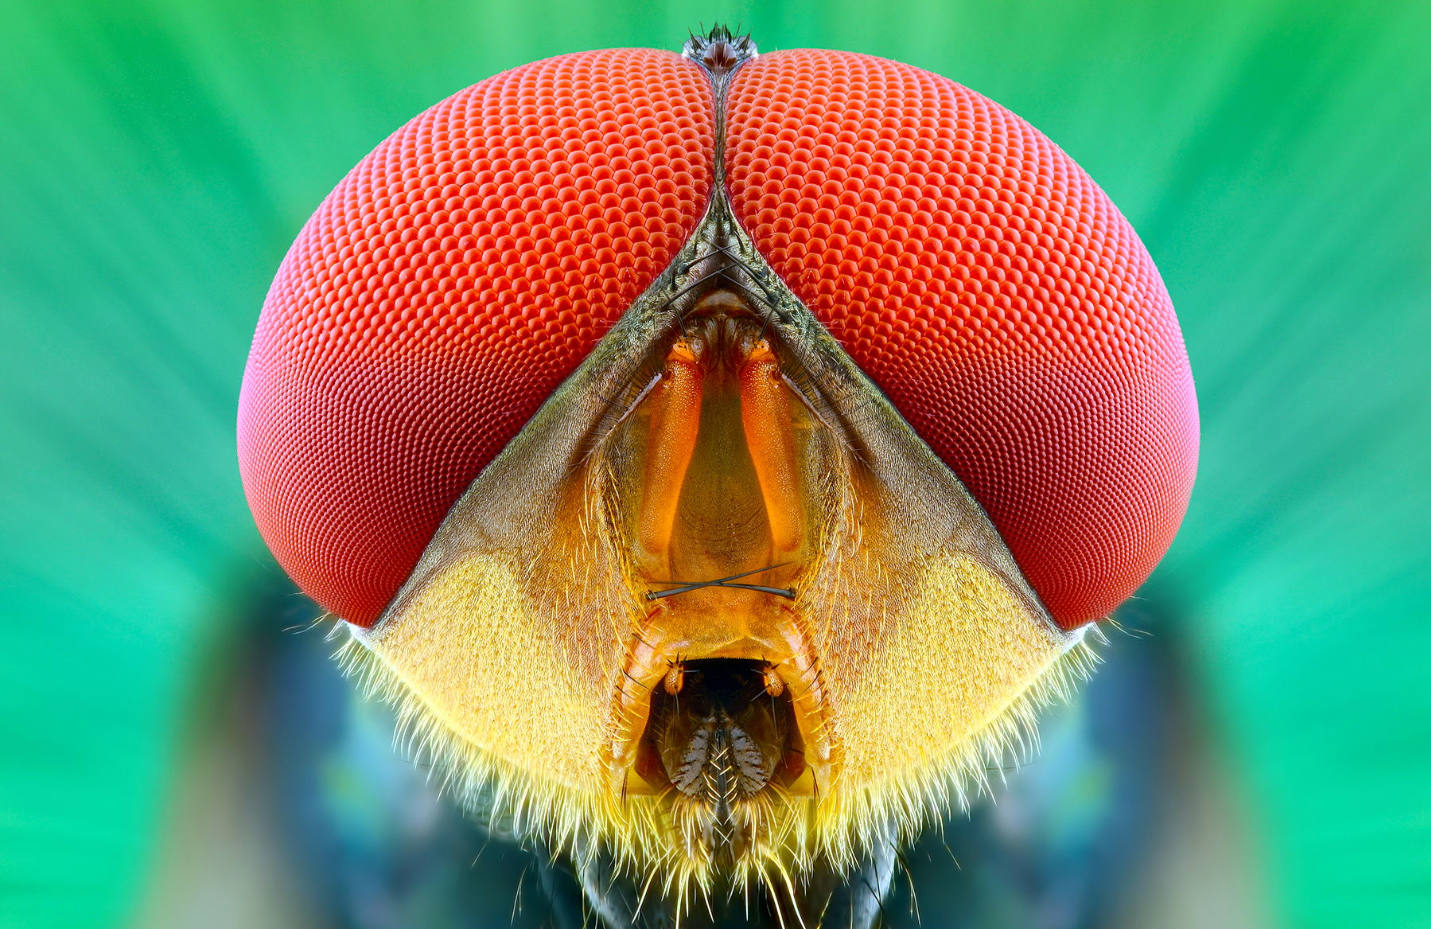
A house fly photographed with a macro lens.

Photograph by Yudy Sauw: https://500px.com/yudysauw

Circular data

USING PROPORTIONAL CIRCLES.

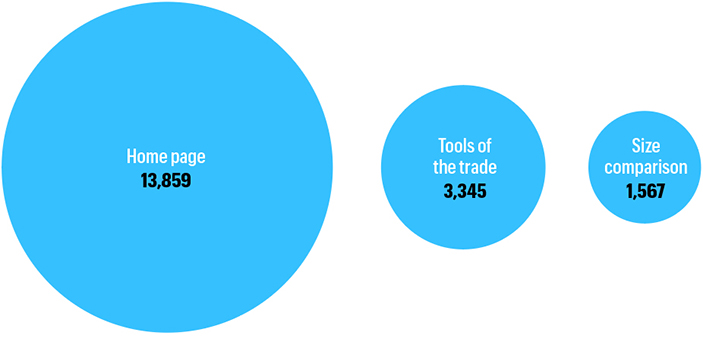
In this most basic use, the relative size of circles represents different values. These are numbers of views of this blog.
Circles can be effective in many situations, especially when comparing very large and very small numbers.

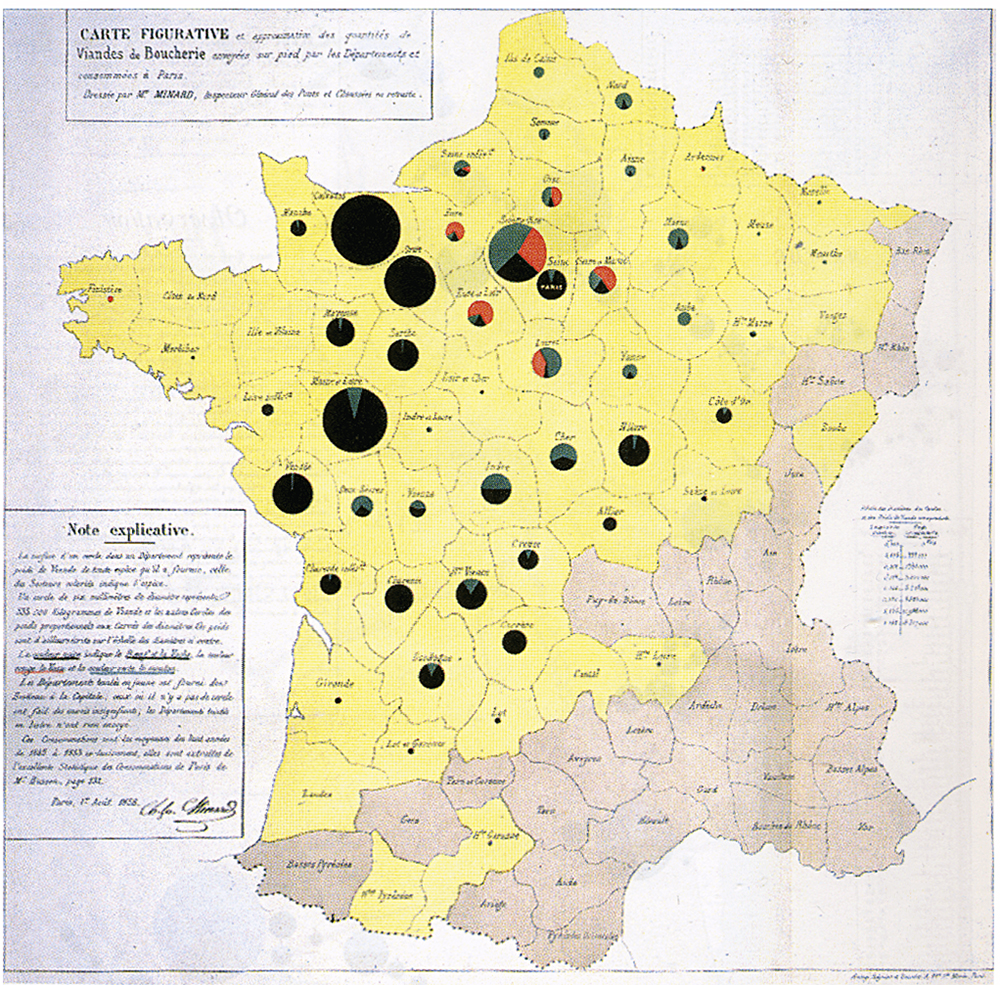
Divided proportional circles are proportional pie charts. This is a classic map-based example by Charles Minard, from 1858.

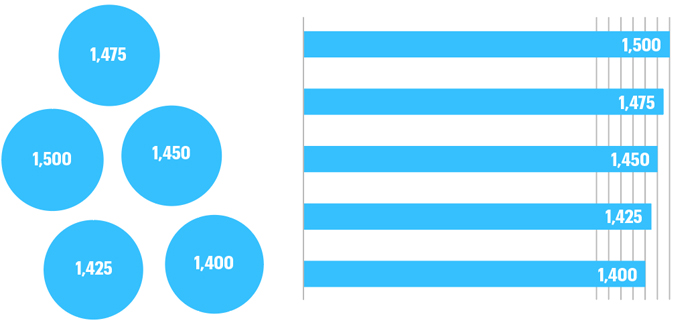
A few years ago, circle-mania hit the infographic world. It seems to have calmed down now, but for a while it seemed like circle plots were used for everything. And today, they are often used when another method to present the data would be clearer. An underlying issue is that we’re not good at comparing areas, so fine differences are not visually reinforced. The comparison below shows how a bar chart can be more immediate that clusters of circles. Very fine differences are immediately visible without reading any numbers. Placing the circles in ascending or descending order, and on the same base line, would help make the left-hand chart clearer, although the differences will always be more difficult to see than if bars are used.

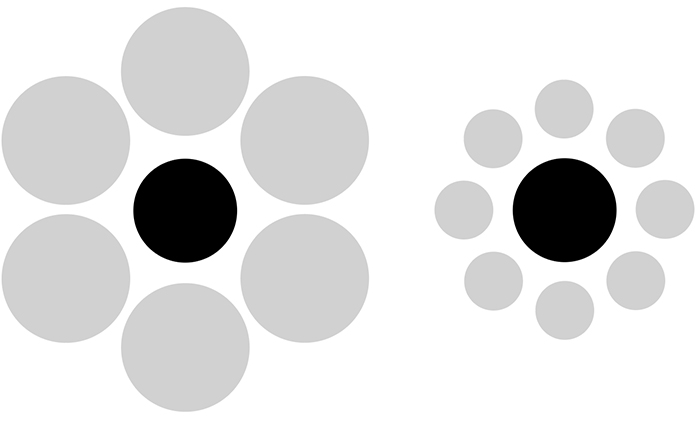
Another concern is that the proximity and the size of shapes can confuse us. Here the black circles are the same size.

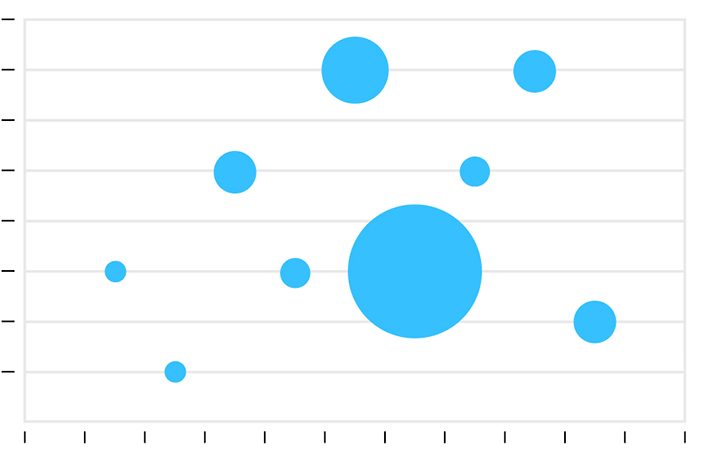
A bubble chart is a scatter plot that uses proportional circles to represent a third level of data.

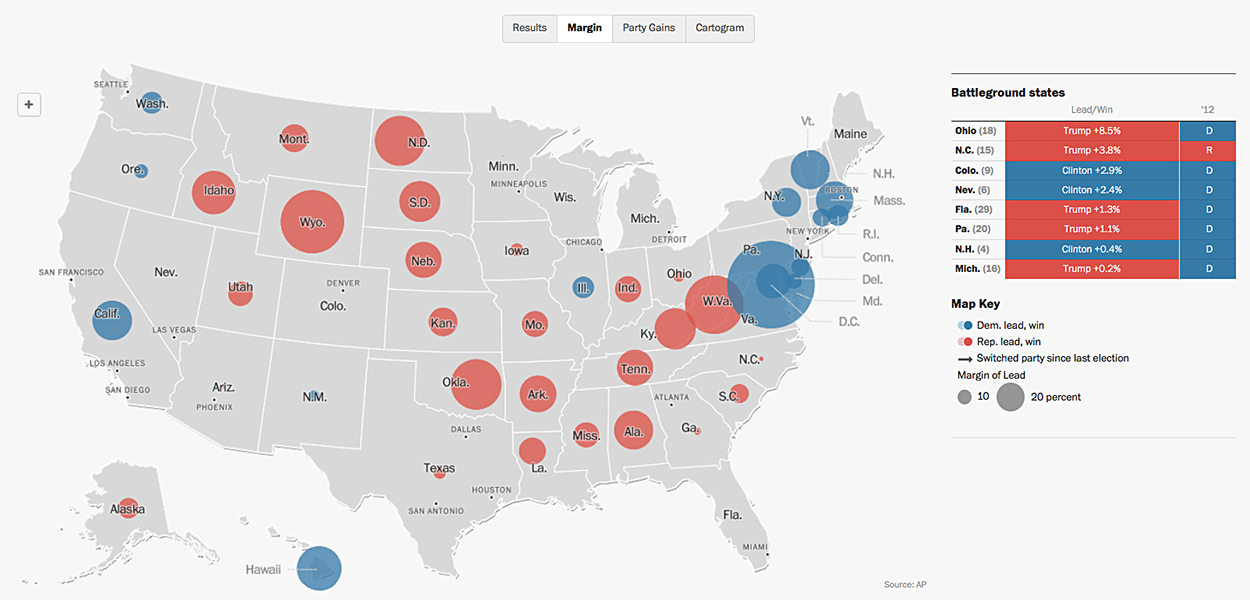
And the bubble map is always worth considering. We get a good visual impression of the states with a large margin of victory in this 2016 Washington Post interactive election map. https://goo.gl/eDgpPs
Try the margin data at the state level.

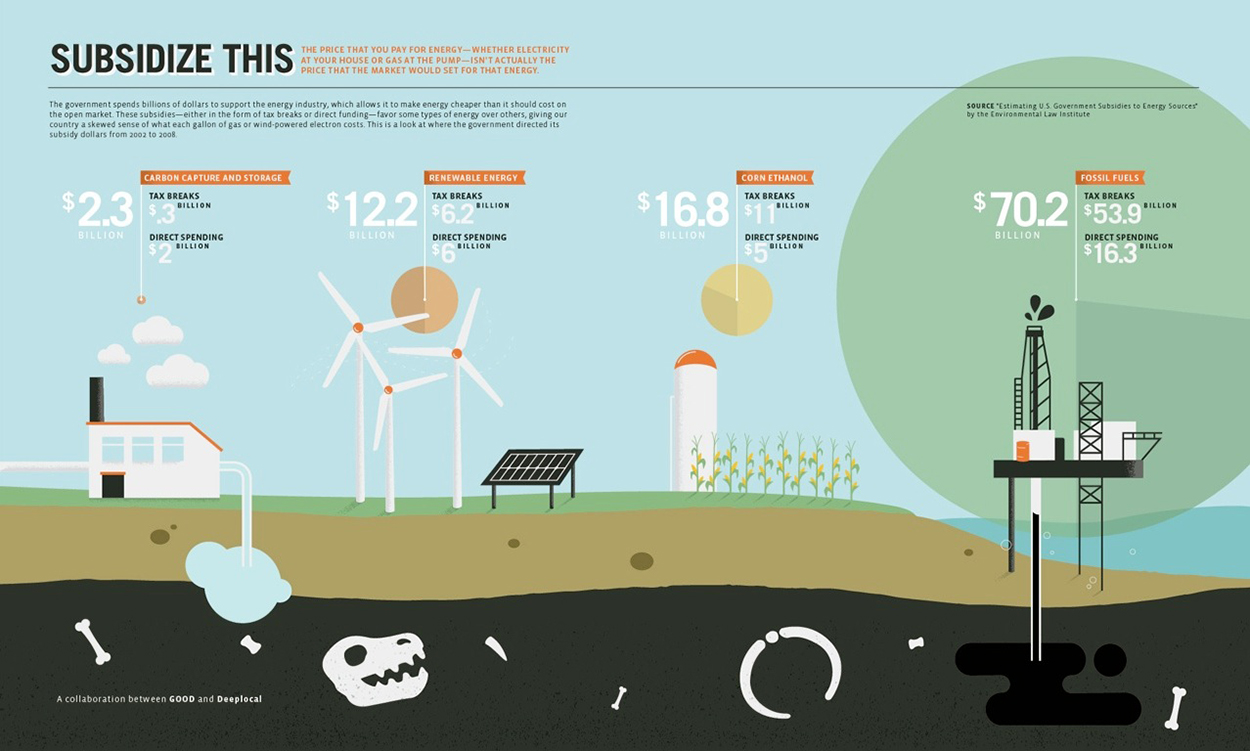
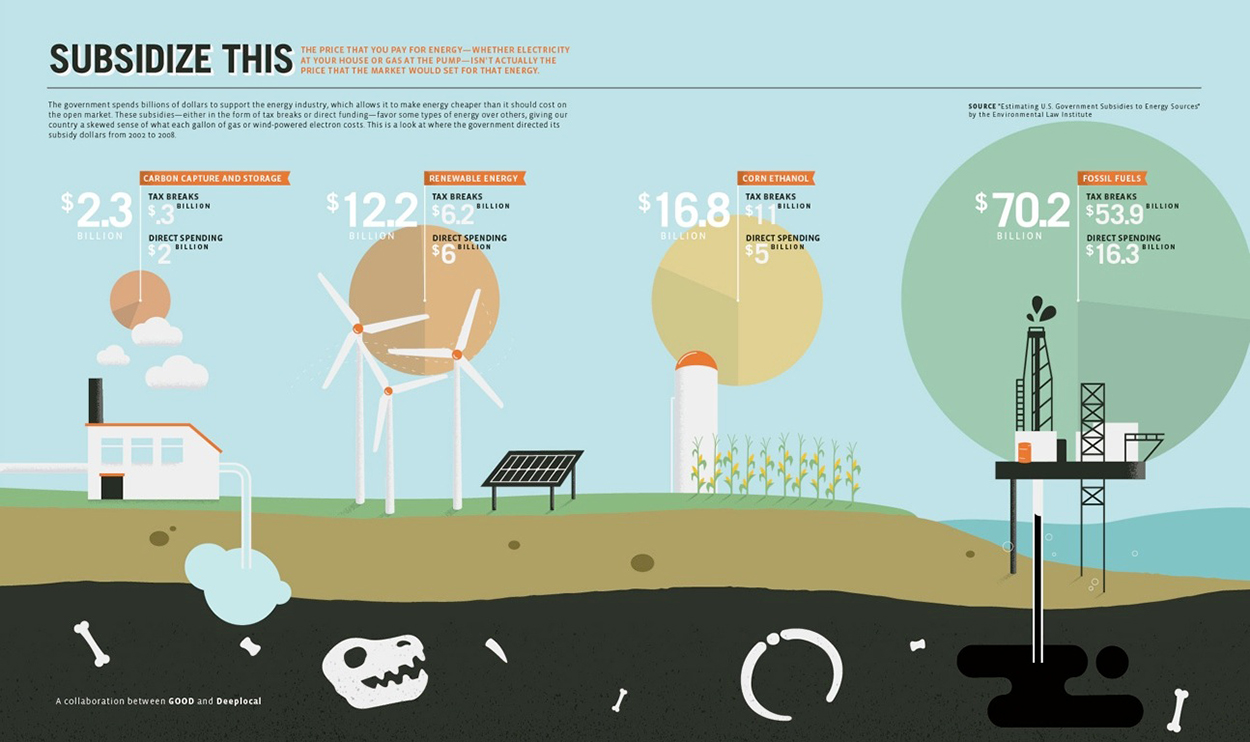
Sometimes the use of circles in charts and maps makes data difficult to comprehend because there is a lot of overlap in congested areas of the visualization. But by far the most common problem with proportional circles is incorrect plotting. As this is an area comparison, using diameters will produce a greatly exaggerated result. The square root of the values should be calculated to get the correct ratio of the sizes. Here’s an example of the problem. The original graphic and the subsequent correction. We should applaud “Good” magazine for doing the right thing and (prominently) fixing this. Most people don’t bother.

To be fair, anyone can make a mistake. And I have certainly made my share during my long career. (But for some reason, I’m not showing any of them here!) So use circles, but like everything else in our data viz toolkit… use them wisely.

Our home

AN OPTIMISTIC AND ENCOURAGING INTRODUCTION TO THE EARTH.

This is a companion post to the previous one, which was about the “Powers of Ten.” An explanation of the scale of the universe: https://wp.me/p7LiLW-21z

Oliver Jeffers created this beautifully illustrated book with his very young son in mind. It’s a positive view of our planet and all it’s fascinating diversity, that seems especially uplifting in these divisive times. Perhaps we need to step back, see the bigger picture and be nicer to each other. Really, why not?

In Oliver’s words, “Some things about our planet are pretty complicated, but things can be simple, too: there are lots of us on here, so be kind.”

On Amazon: goo.gl/aieE7o