Visual Conceit

CREATIVE VISUAL SOLUTIONS BY ADONIS DURADO.

We’re very fortunate that our Knight Fellow for this academic year is Adonis Durado, whose design and infographics work at the Times of Oman, and several other publications, is widely admired. He currently has a terrific exhibition in our gallery called “Visual Conceit.” Here’s some examples from the show, along with his comments. The selection here has an infographic bias that does not reflect the balance of the show, and of course that’s because it’s on this particular blog.

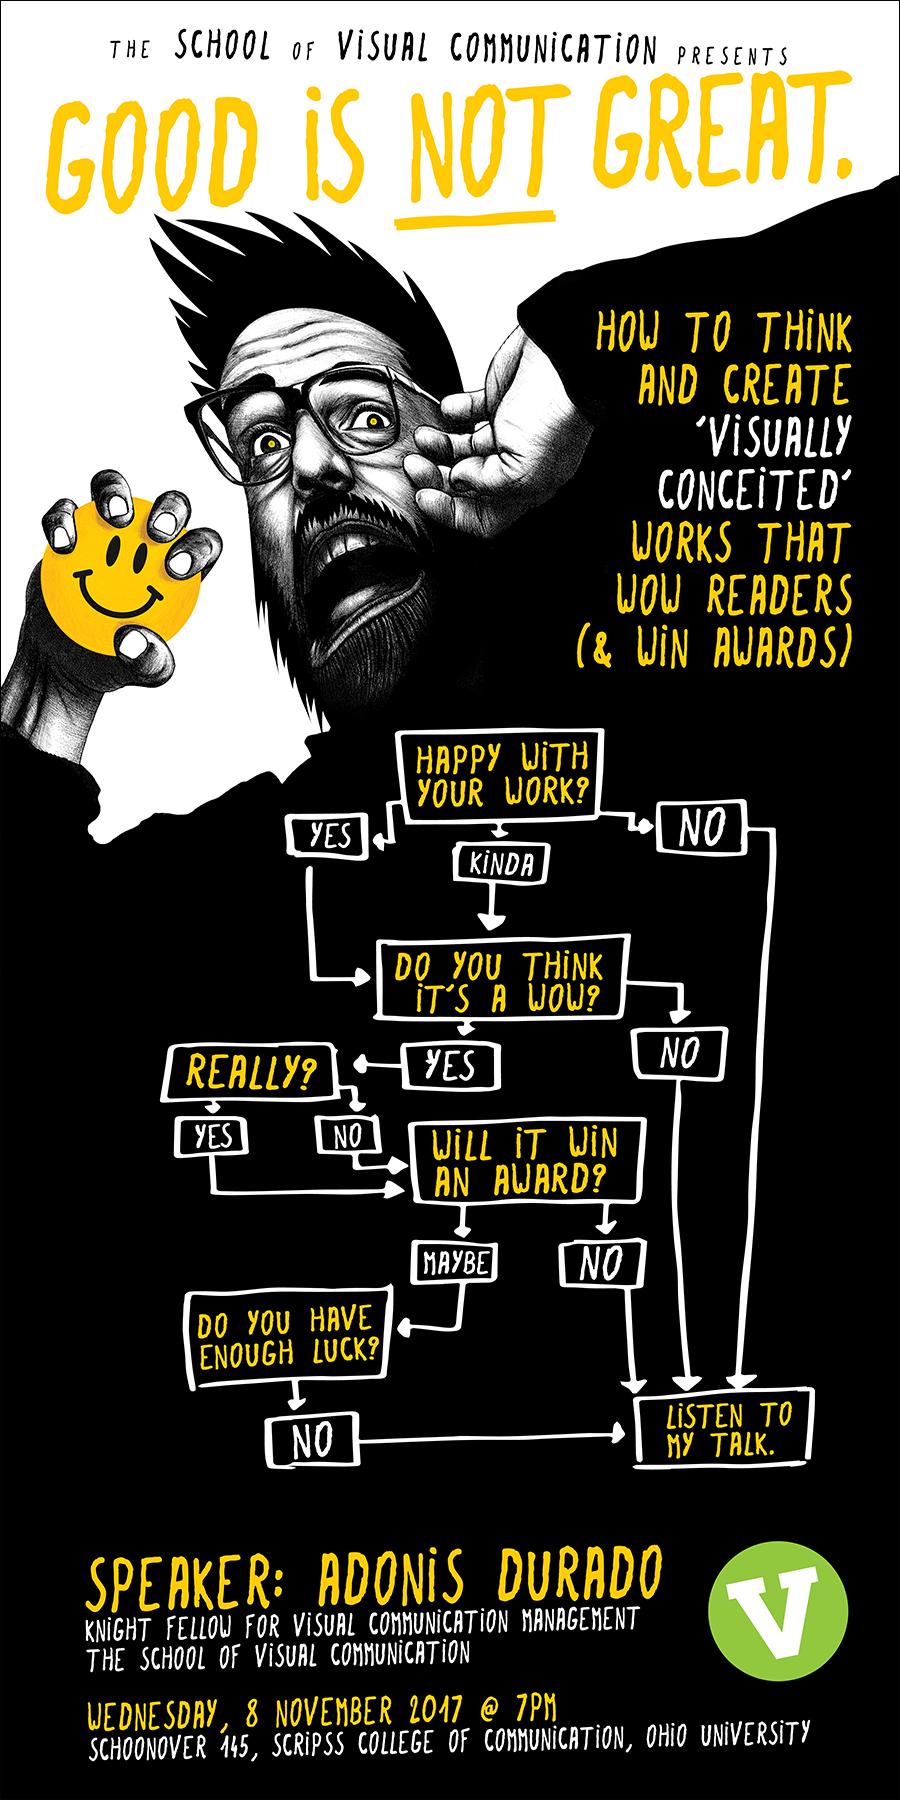
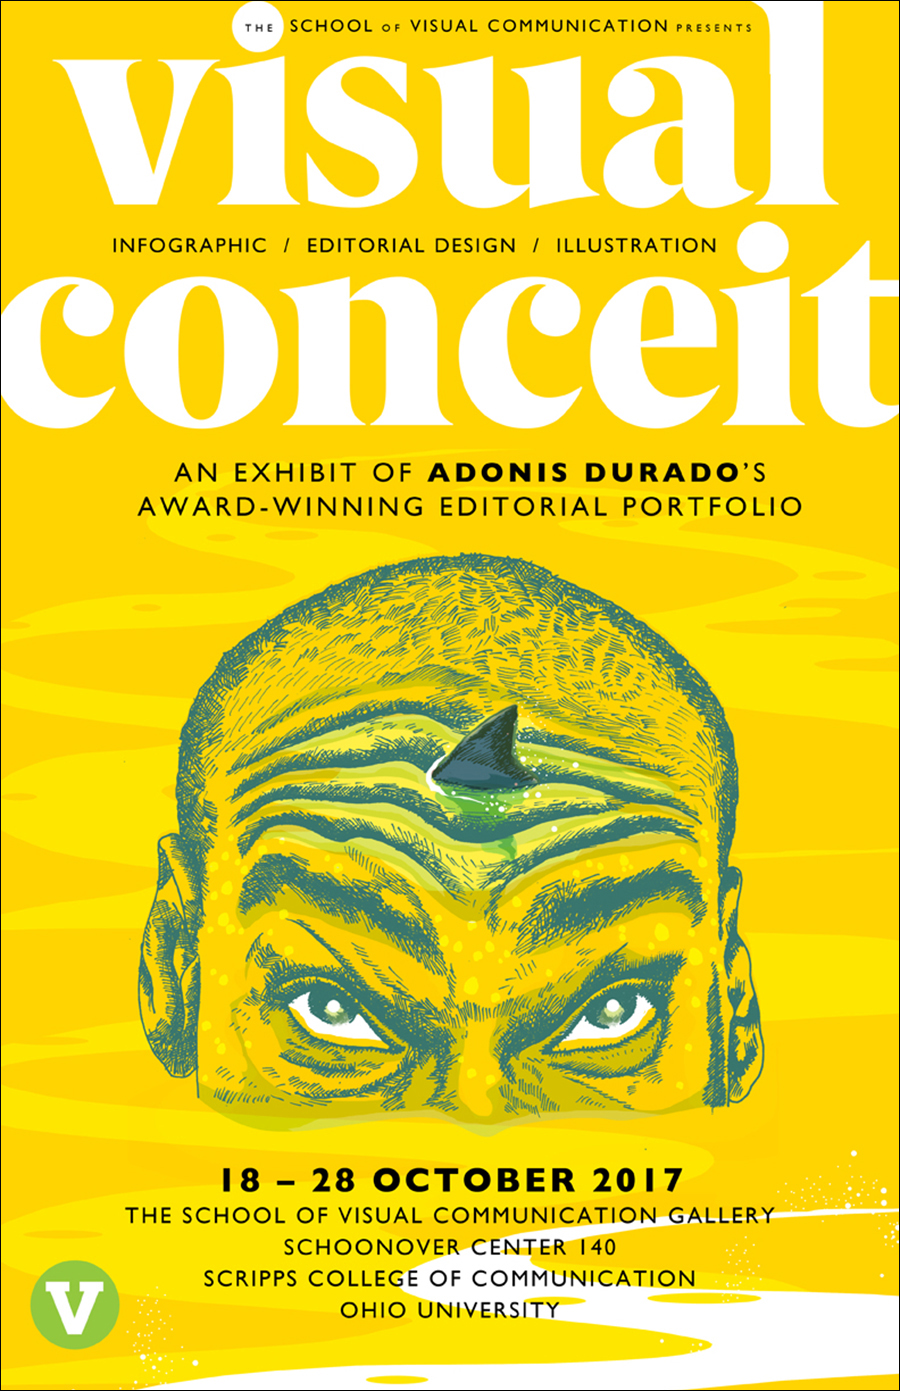
Adonis is talking about his work on Wednesday in our auditorium (poster shown above). This is a terrific opportunity for our students to learn from a world-class designer.

SOME OF HIS INFOGRAPHICS…

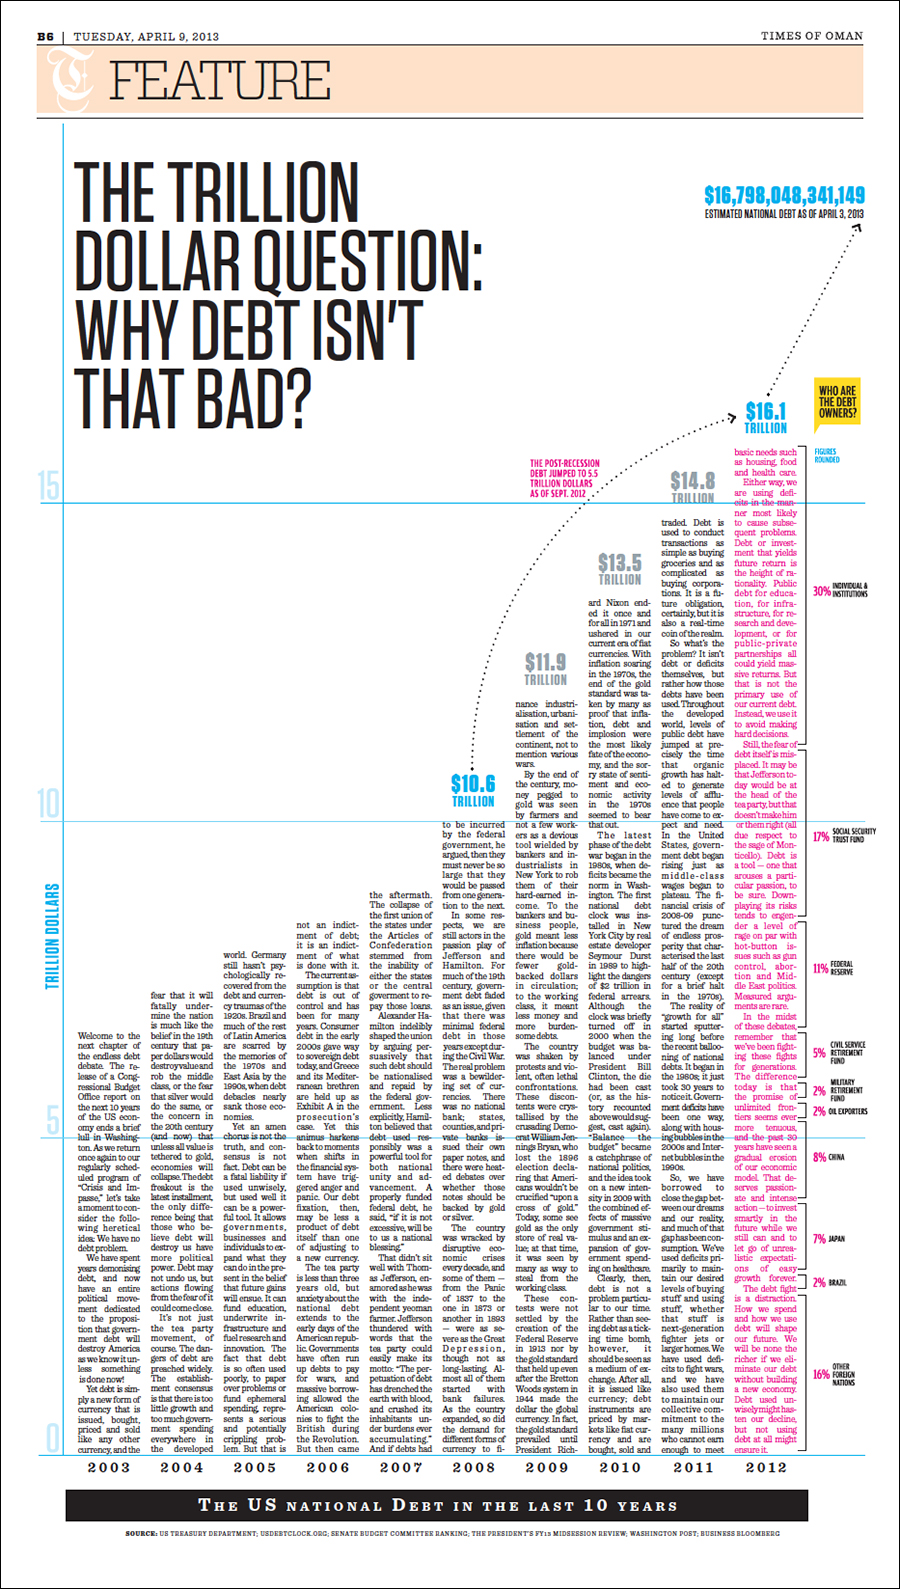
Mega-debt “My conceit here is to use the bars in the chart as body text columns, giving the page an organic or architectonic quality. It’s possible to read the article and the graphic at the same time. This is arguably the biggest bar chart ever published in a newspaper.”

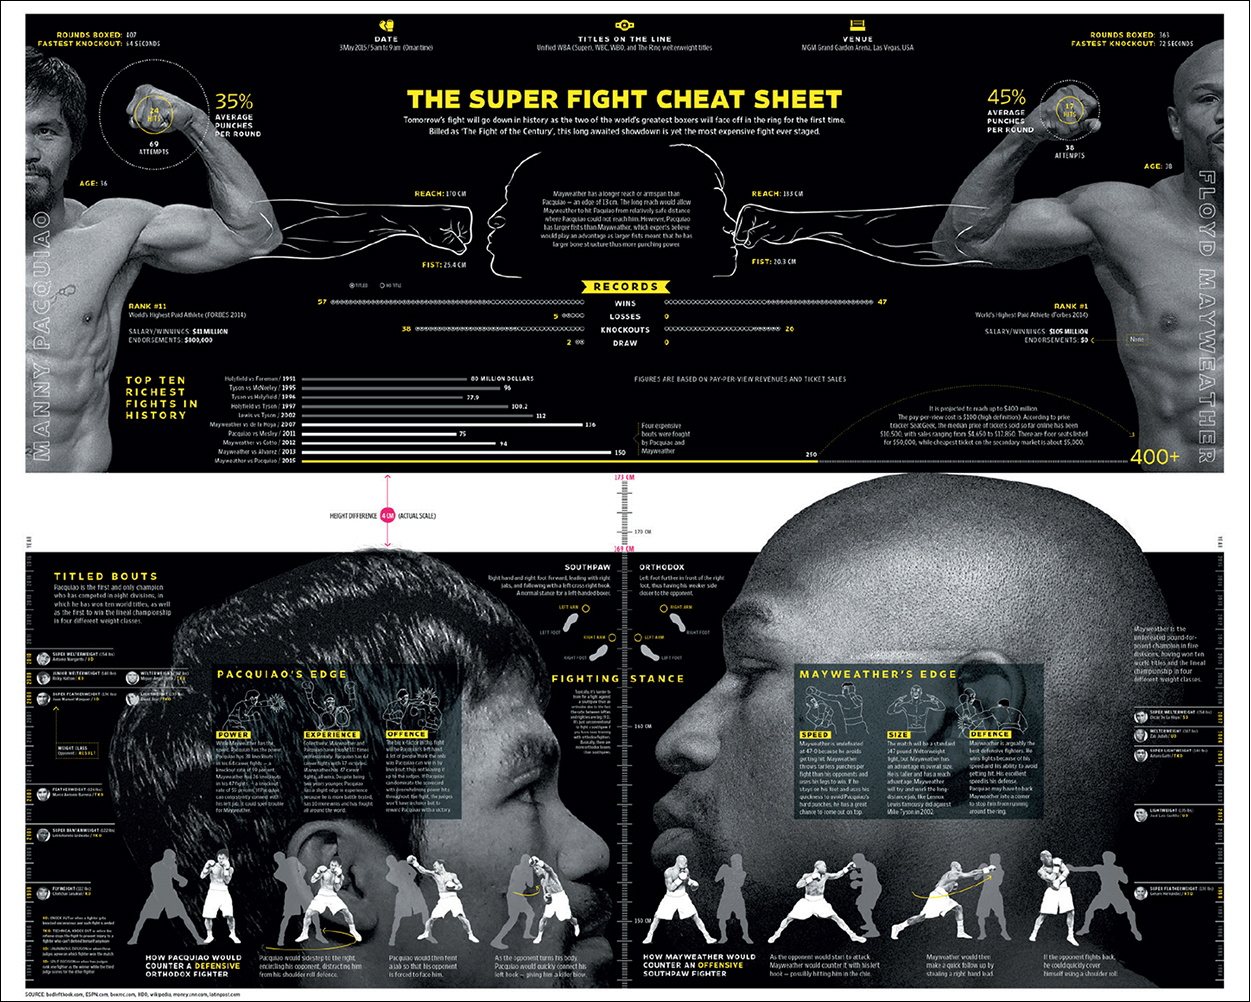
Boxing matchup “This preview presents, at actual scale, the height difference between the two boxers, which is shown as a white strip that runs across the spread. Height difference matters because a taller boxer has longer limbs, giving him a reach advantage.”

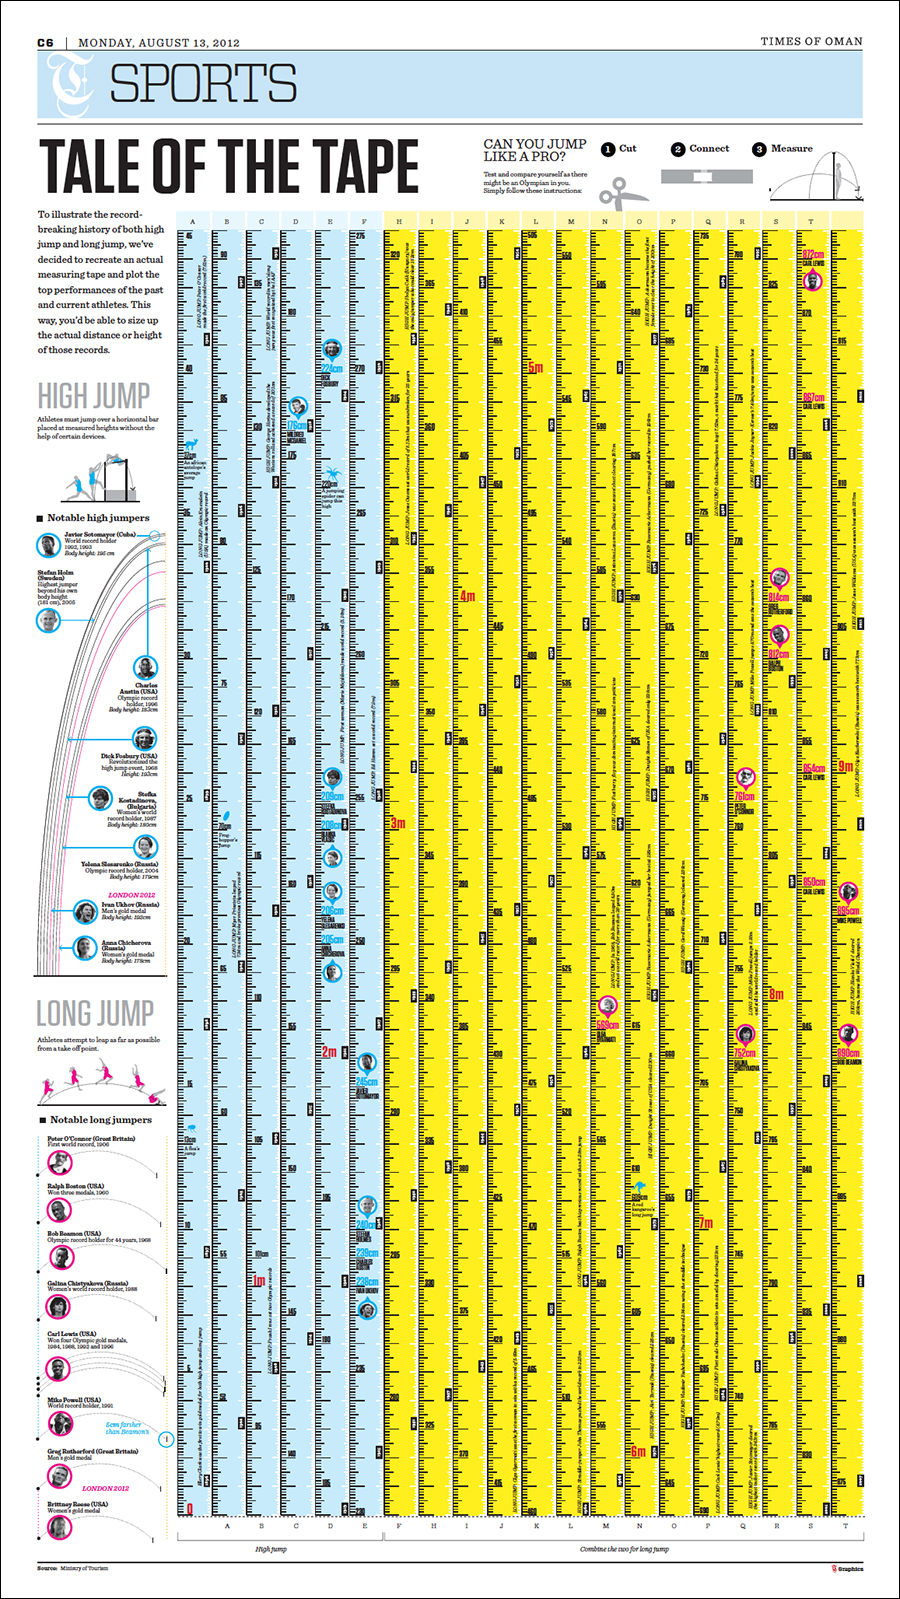
Olympic records “An infographic about the record-breaking history of the Olympic long jump and high jump. To add fun and interactivity, I invited readers to cut up the page and transform it into a measuring tape, then see for themselves if they can jump like a pro.” (Click on the image to see a detail.)

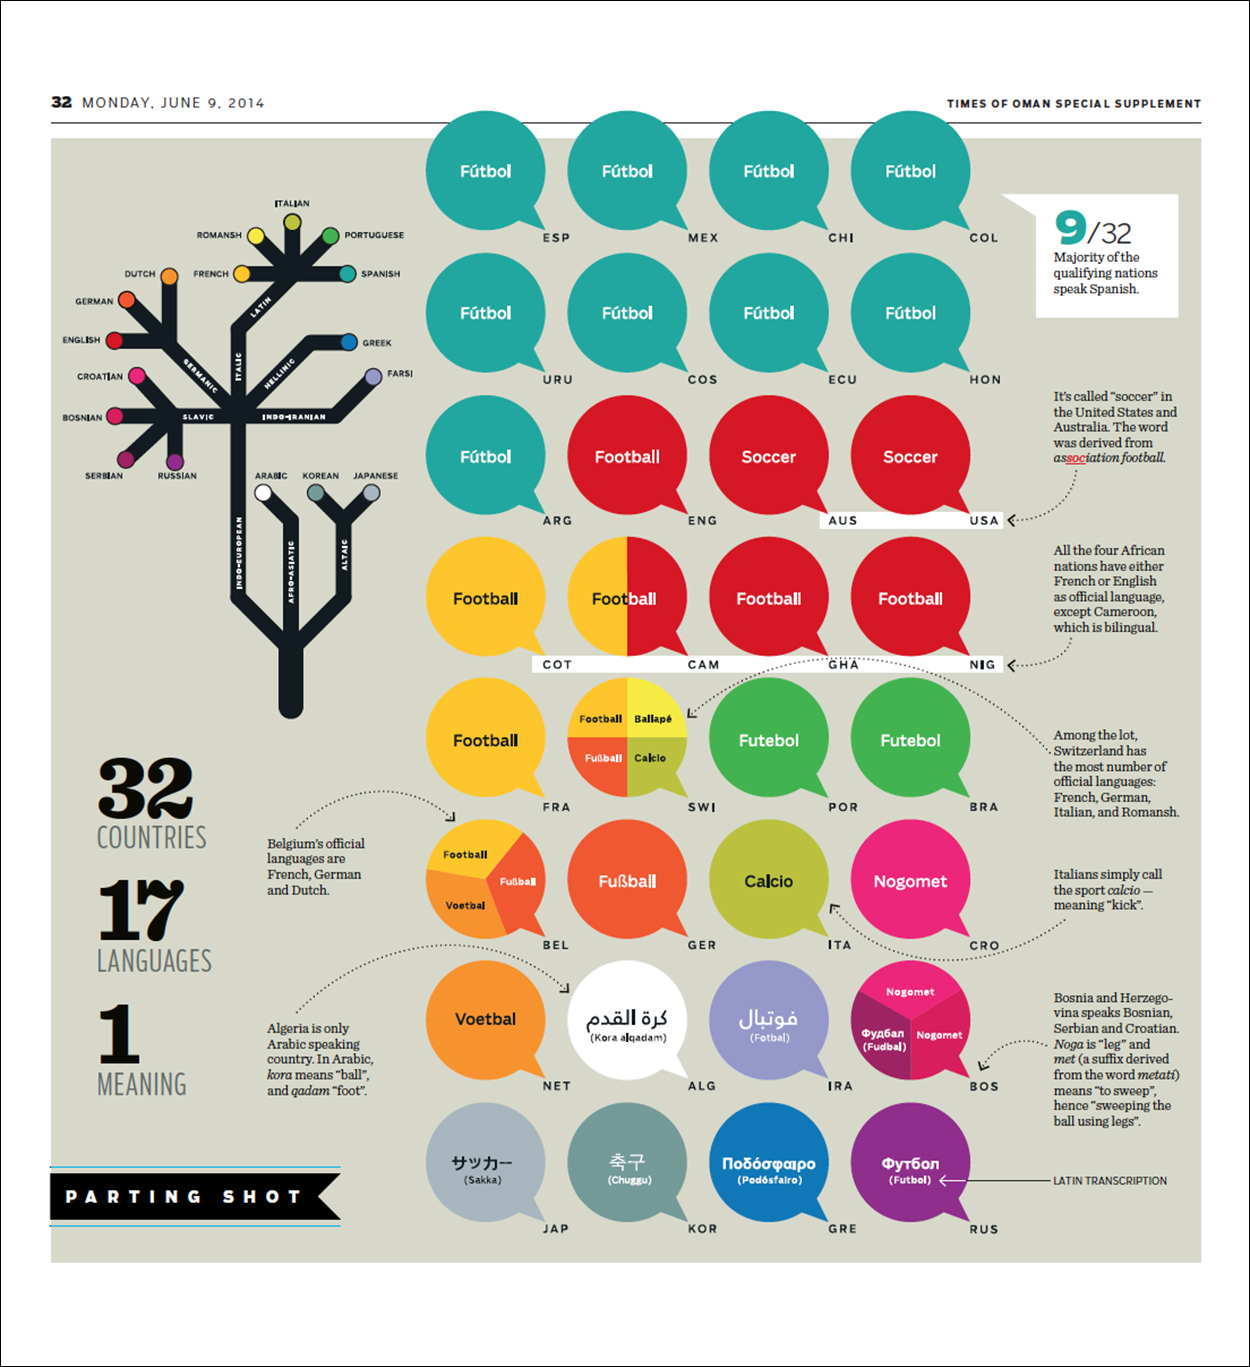
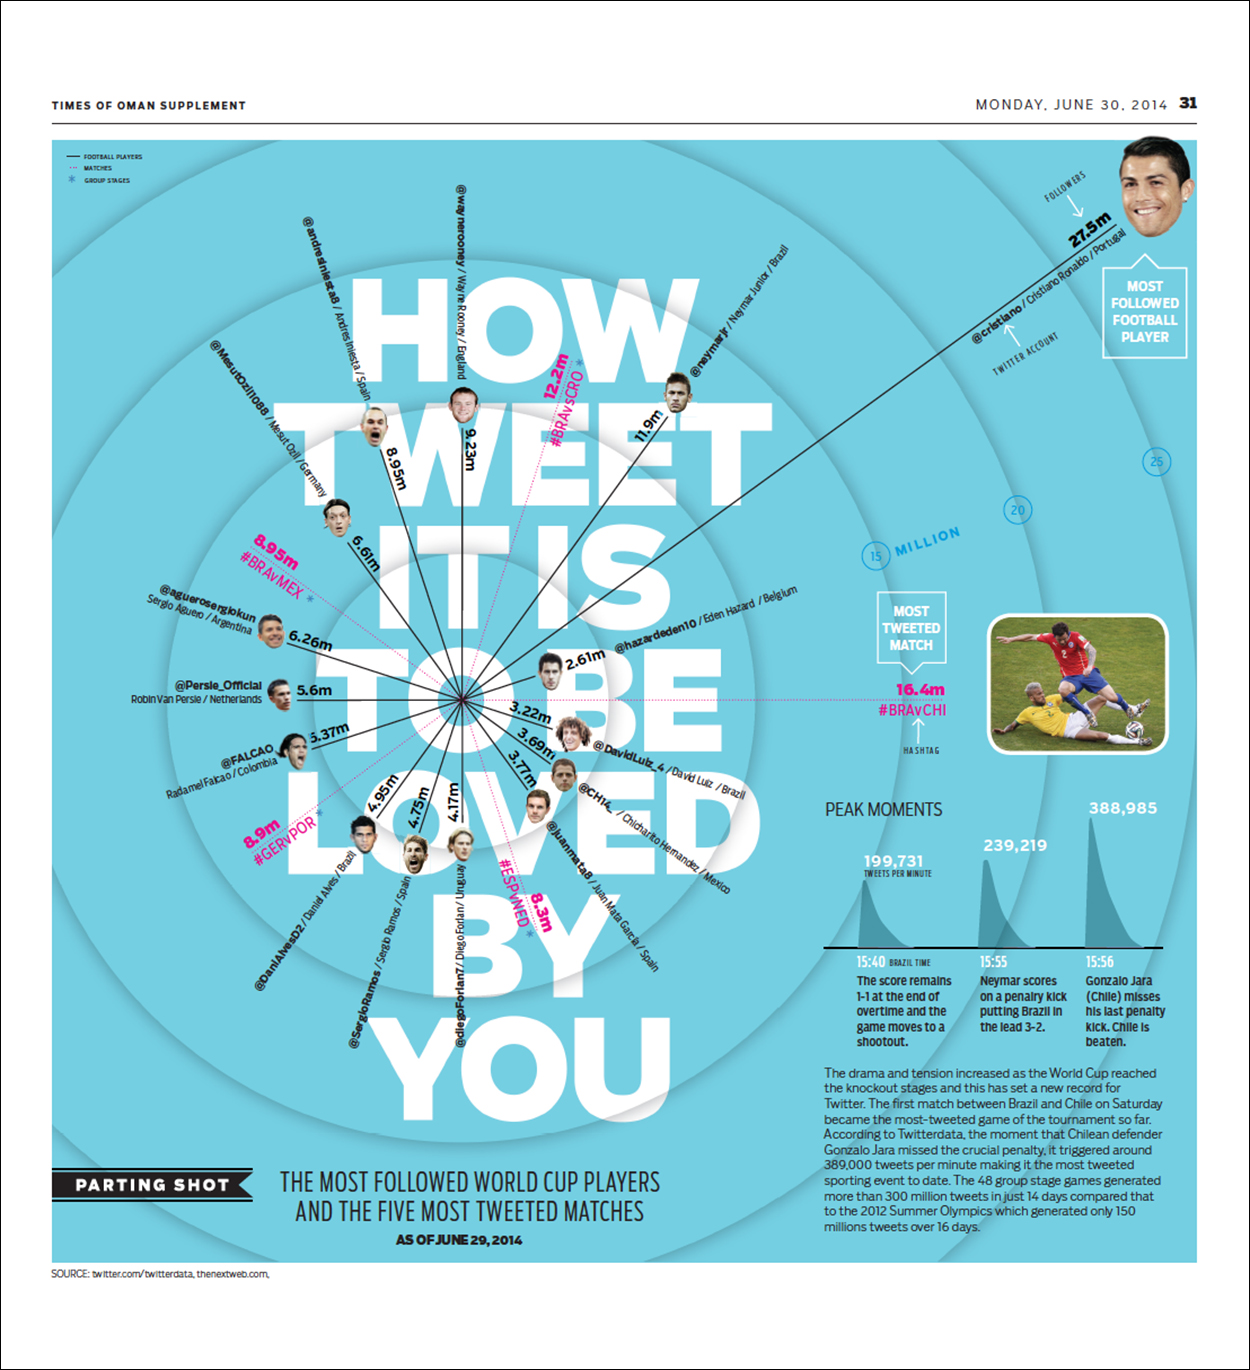
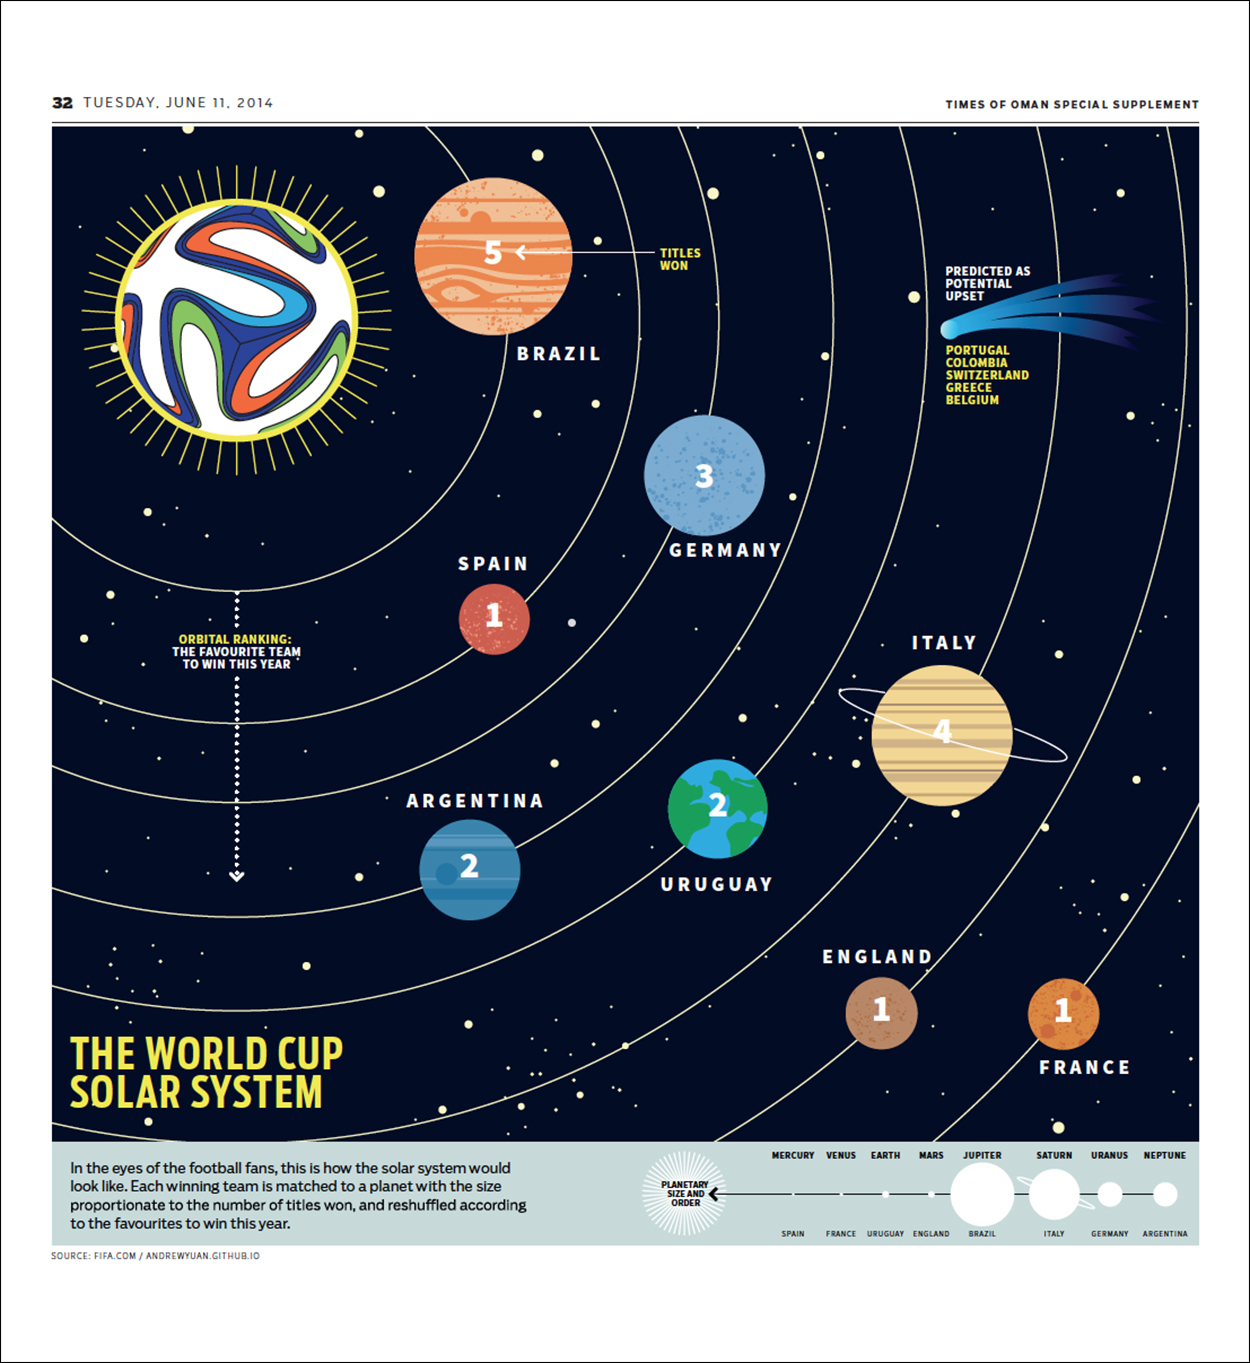
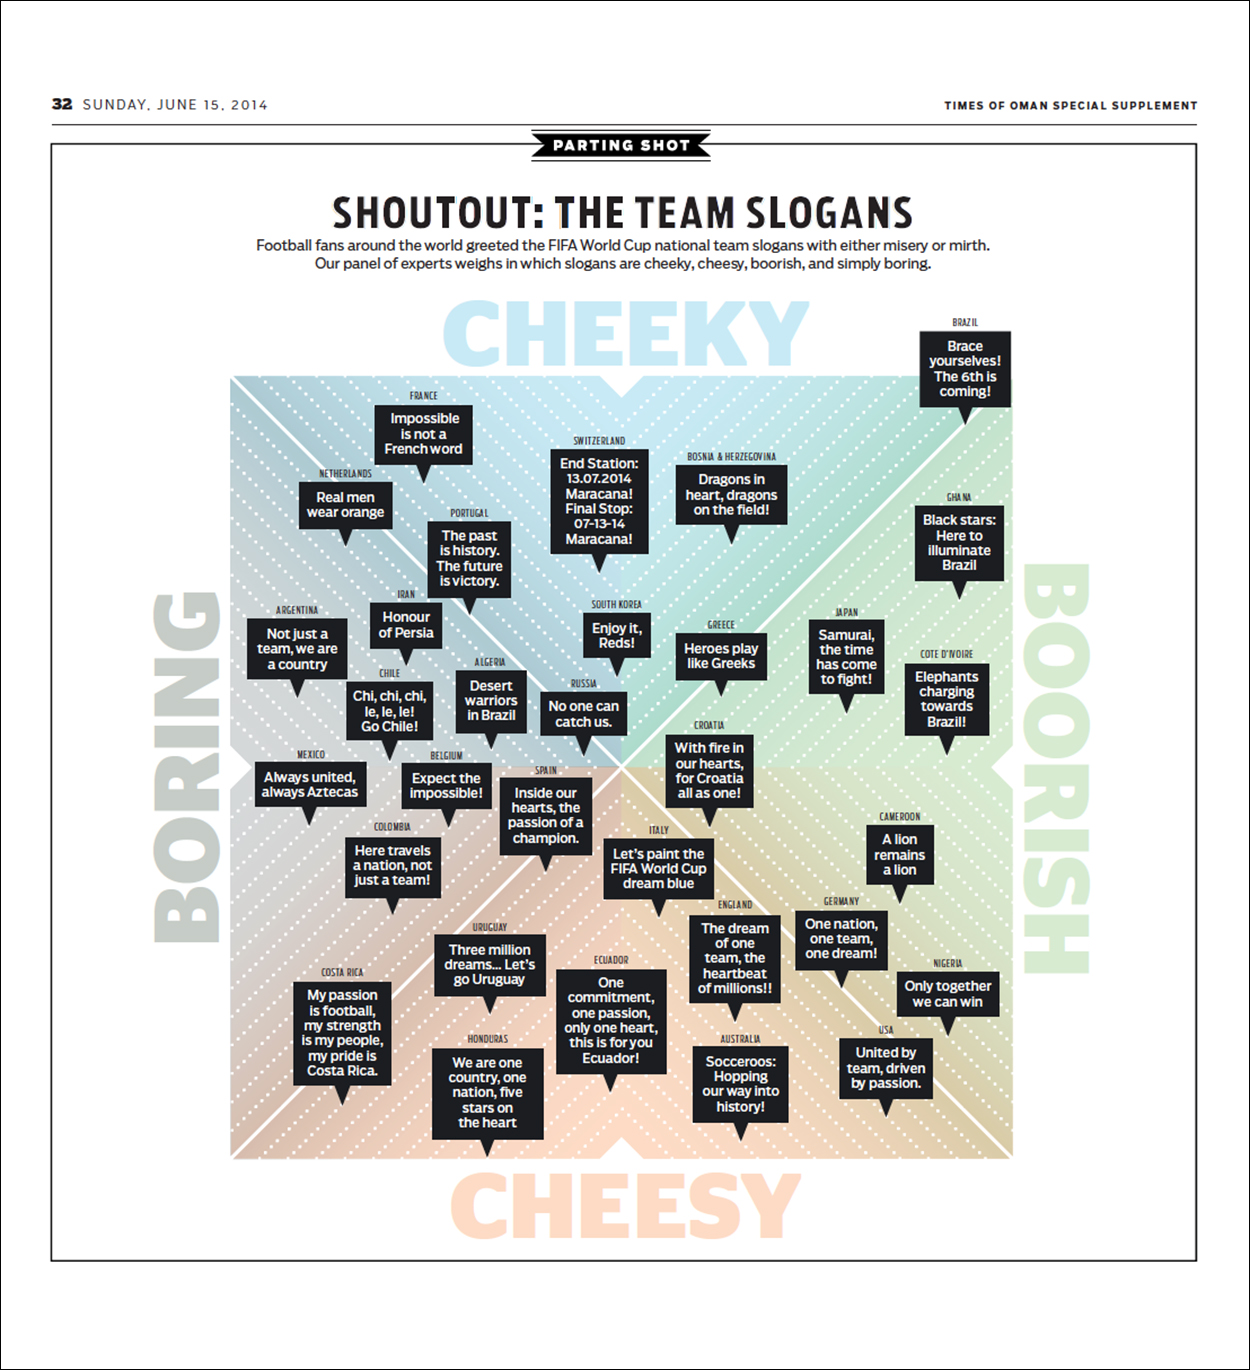
World Cup insights “A series of infographics that were published in the back of our World Cup supplement. In this section, called “Parting Shot,” we tried visualizing content that is considered non-serious or off-beat.”

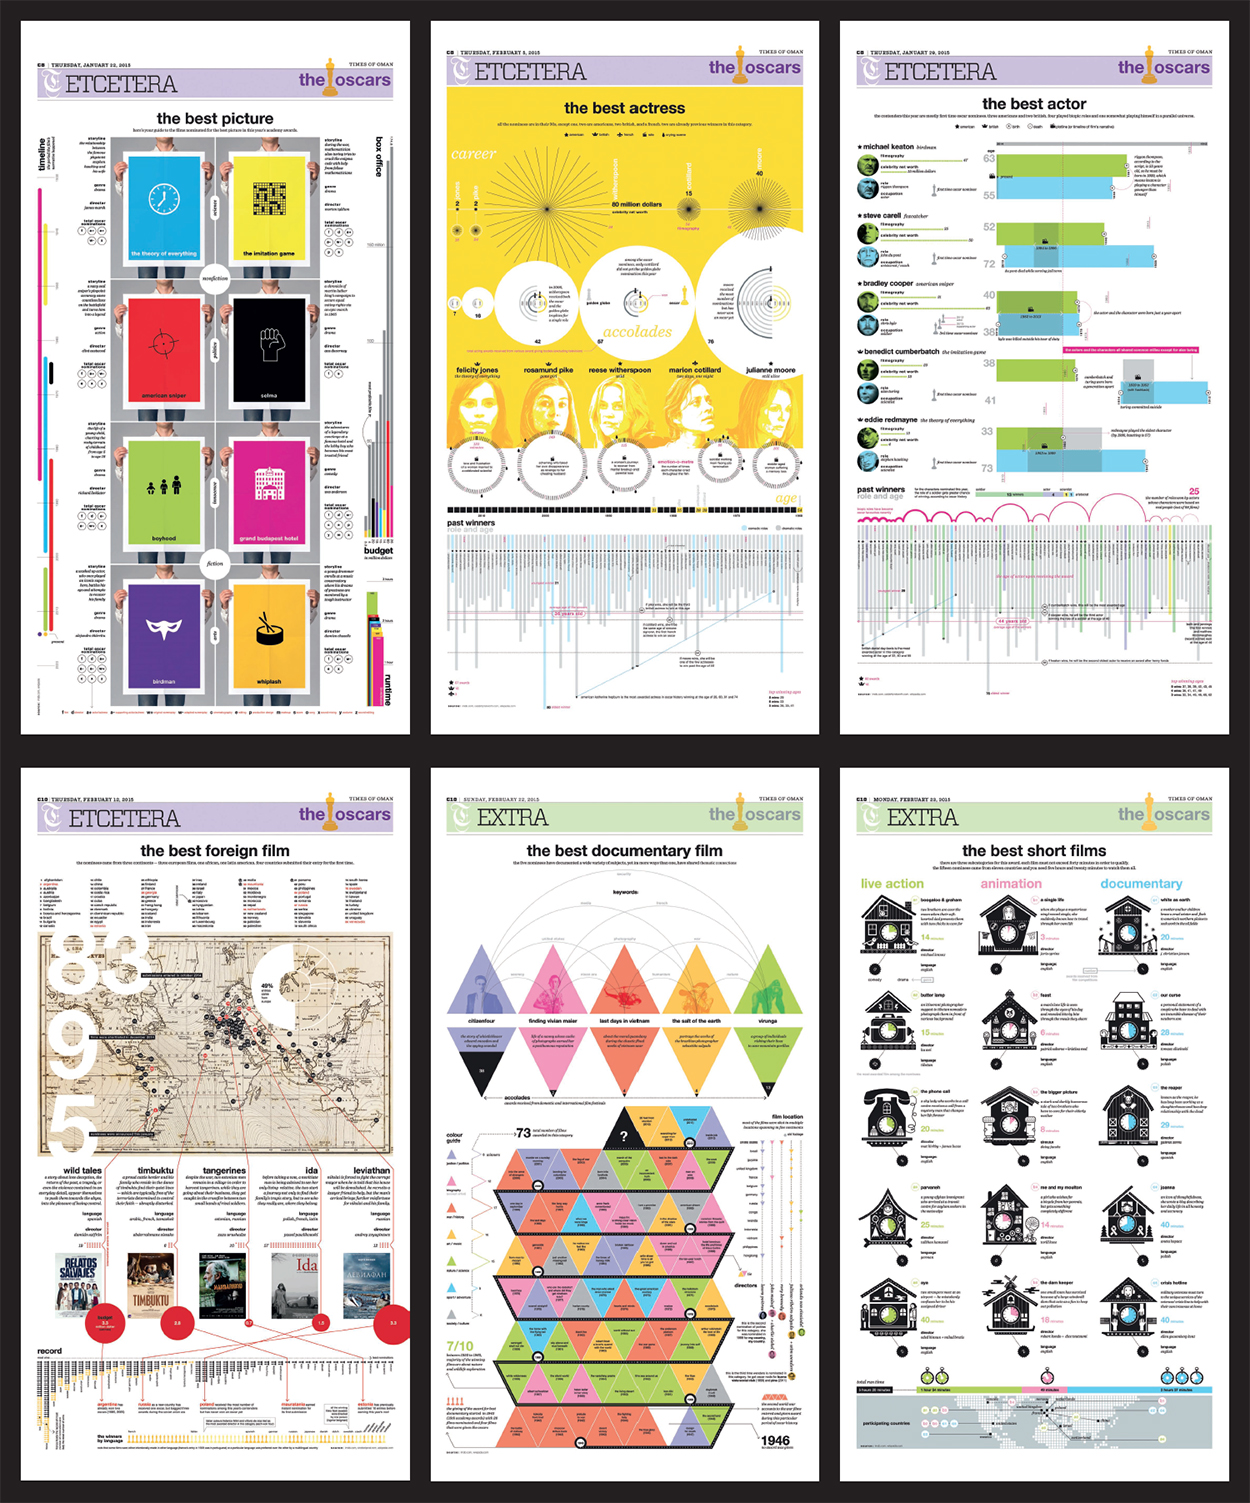
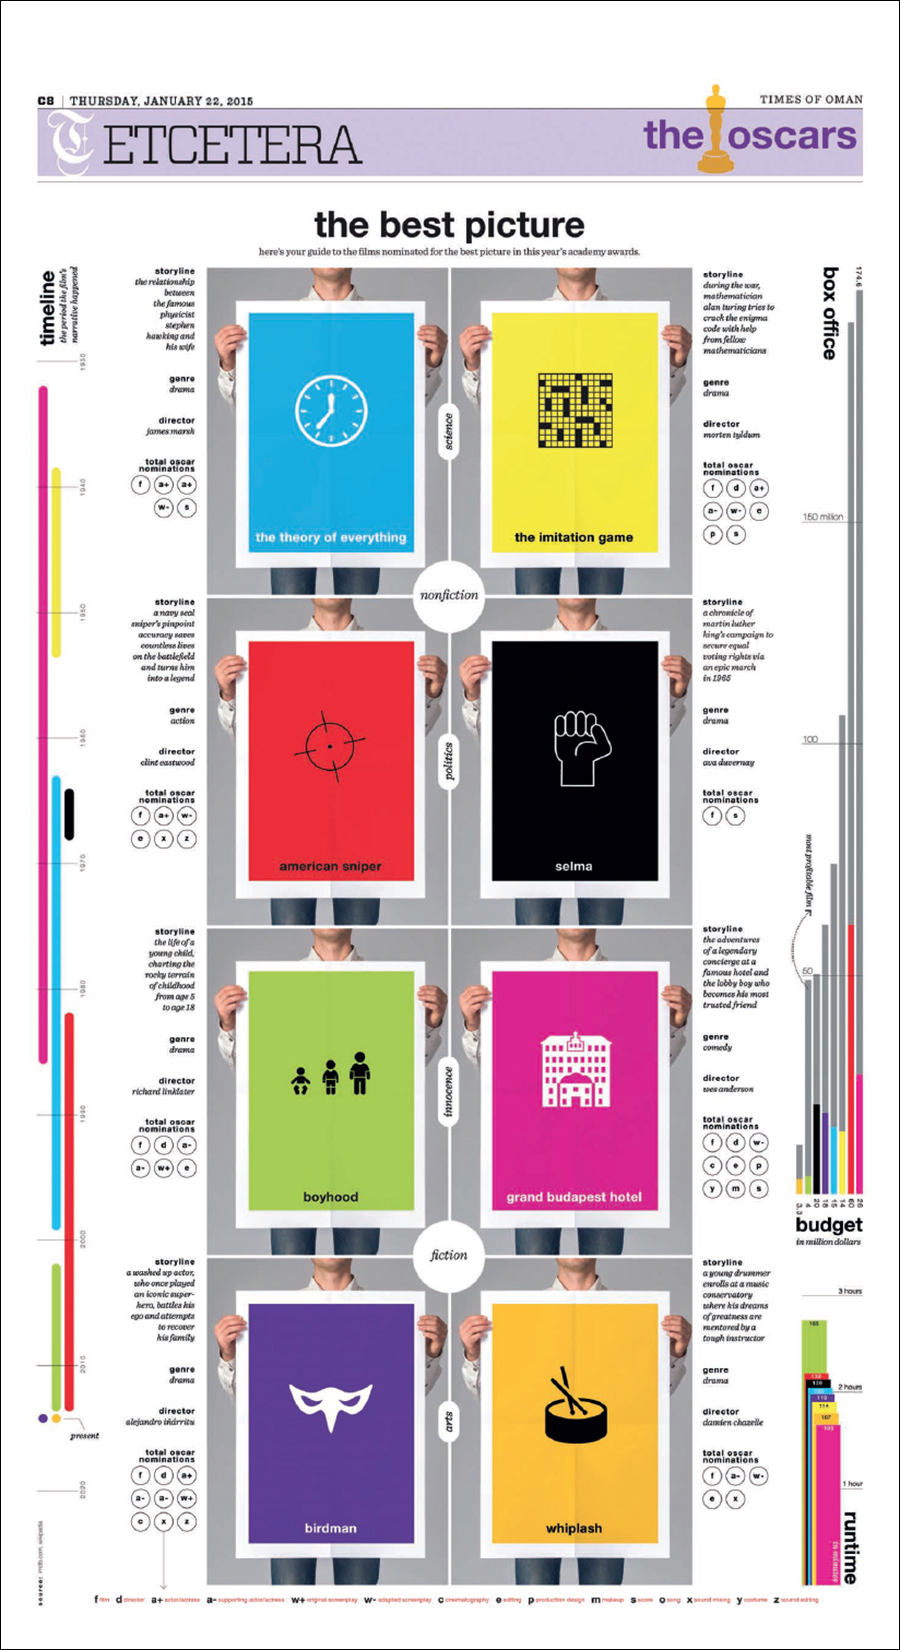
The Oscars “A series of infographics published daily leading up to the Academy Awards ceremony. I employed a variety of conceits for each category page. For example, in “The Best Picture,” I asked myself: Would it be possible to make the graph’s color legend the most dominant element of a page? The legend is a discreet element in all graphics, but not in this case.”

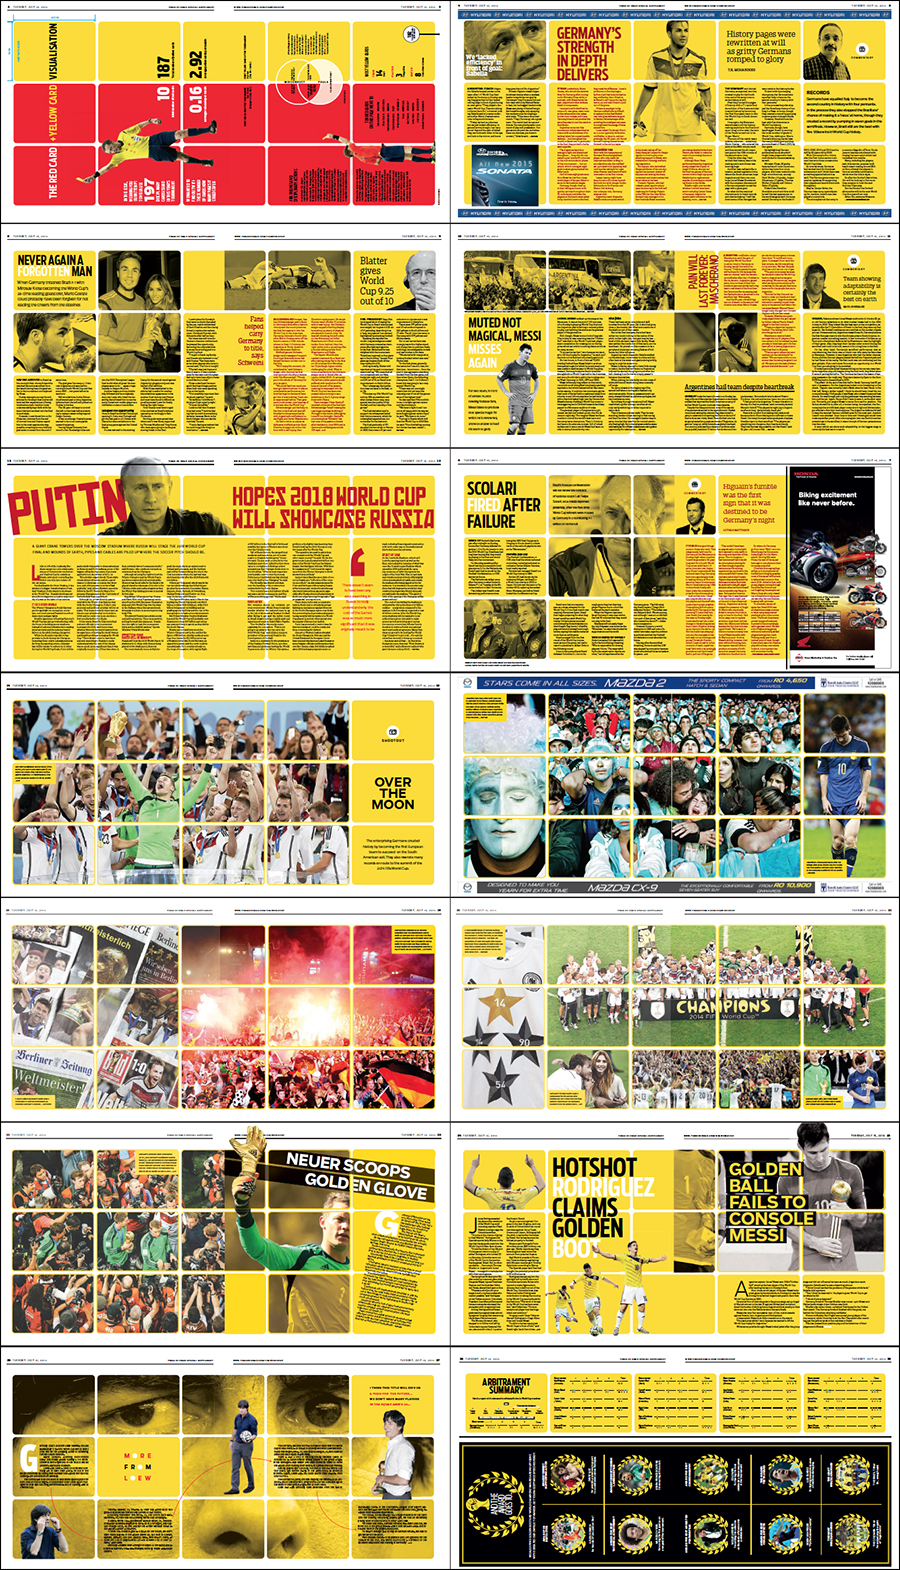
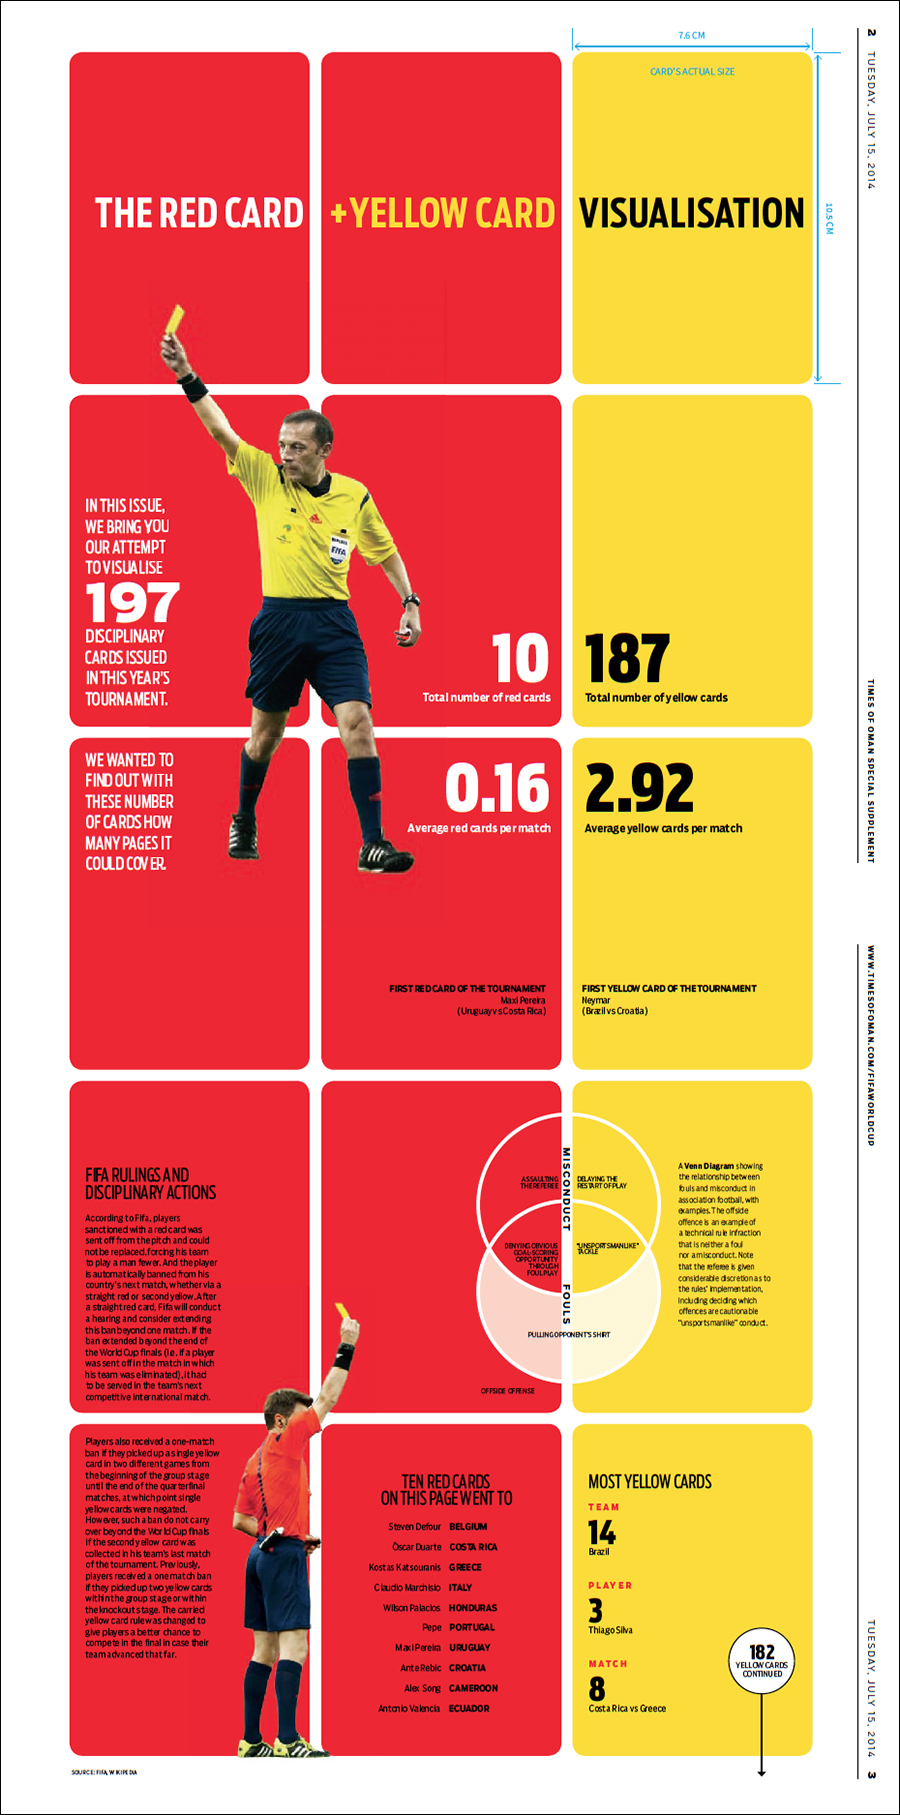
Soccer discipline “Another World Cup graphic. I began the design by considering if it’s possible to visualize a dataset that can occupy the entire issue of the magazine. These are all the red card and yellow cards issued during the tournament.”

The first spread (rotated).

… AND SOME OF HIS PAGE DESIGNS

Danish banking “This page started with the conceit of “type attack,” where the headline serves as the dominant element of a page (or the text becomes art in itself). I ended up deconstructing the body text as well, and came up with a treatment that mimics the concept of intertextuality. Notice that the lead paragraph contains keywords that link to pieces of related information.”

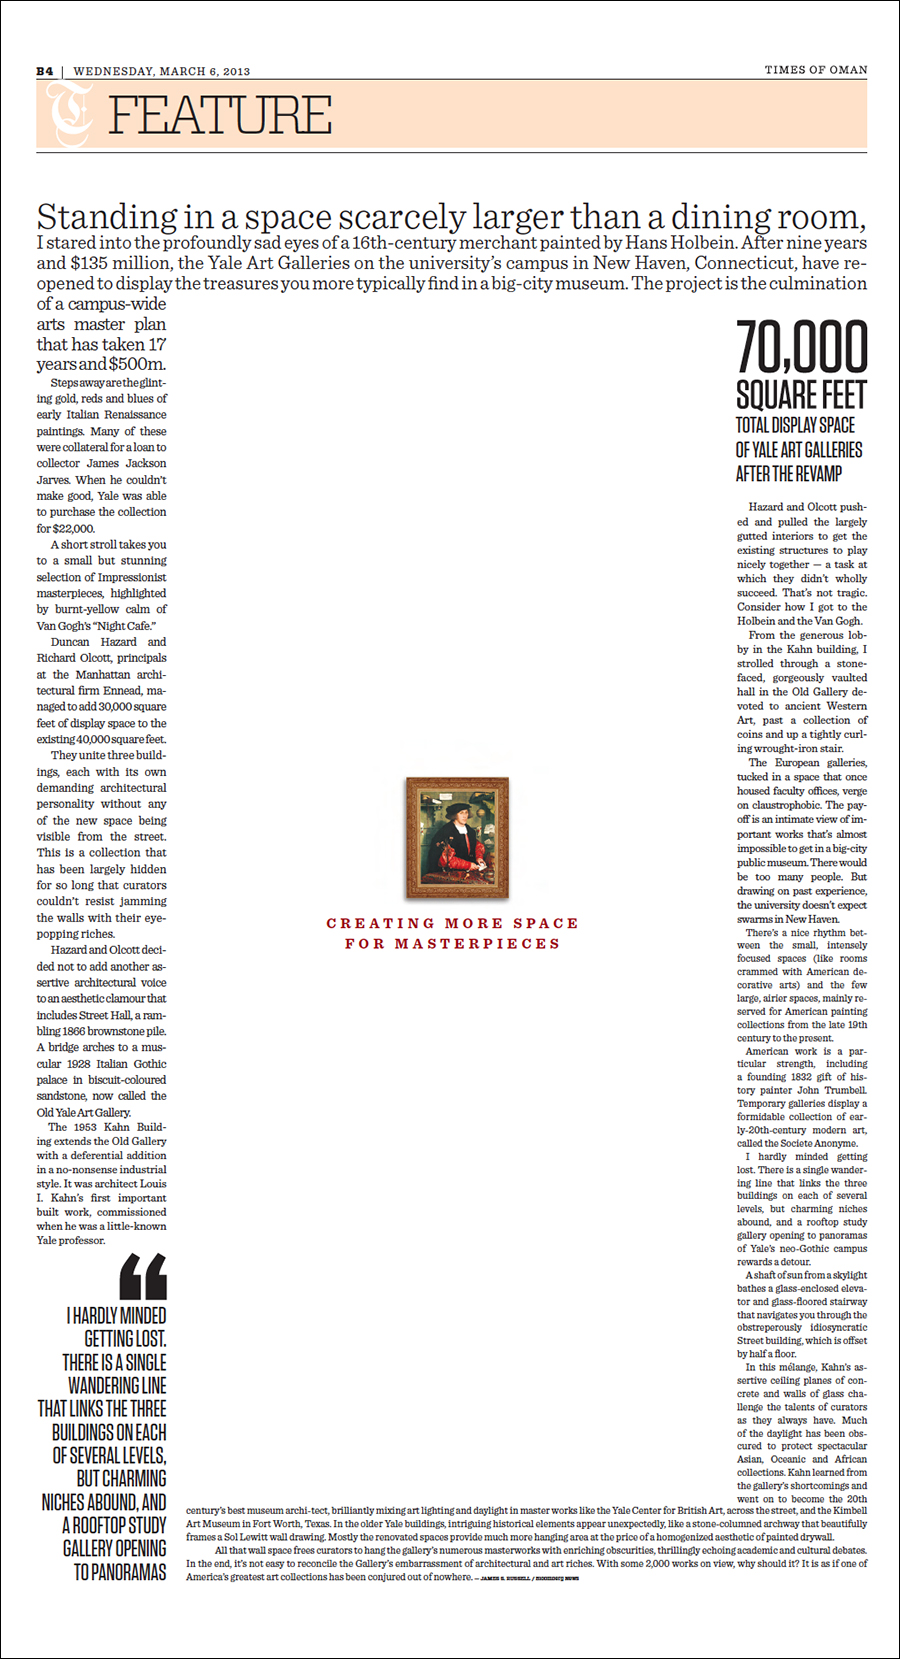
Gallery space “My solution to a challenge that I set myself: Is it possible to design a page where the white space is an illustration in itself, and is an element that will help visualize a story?”

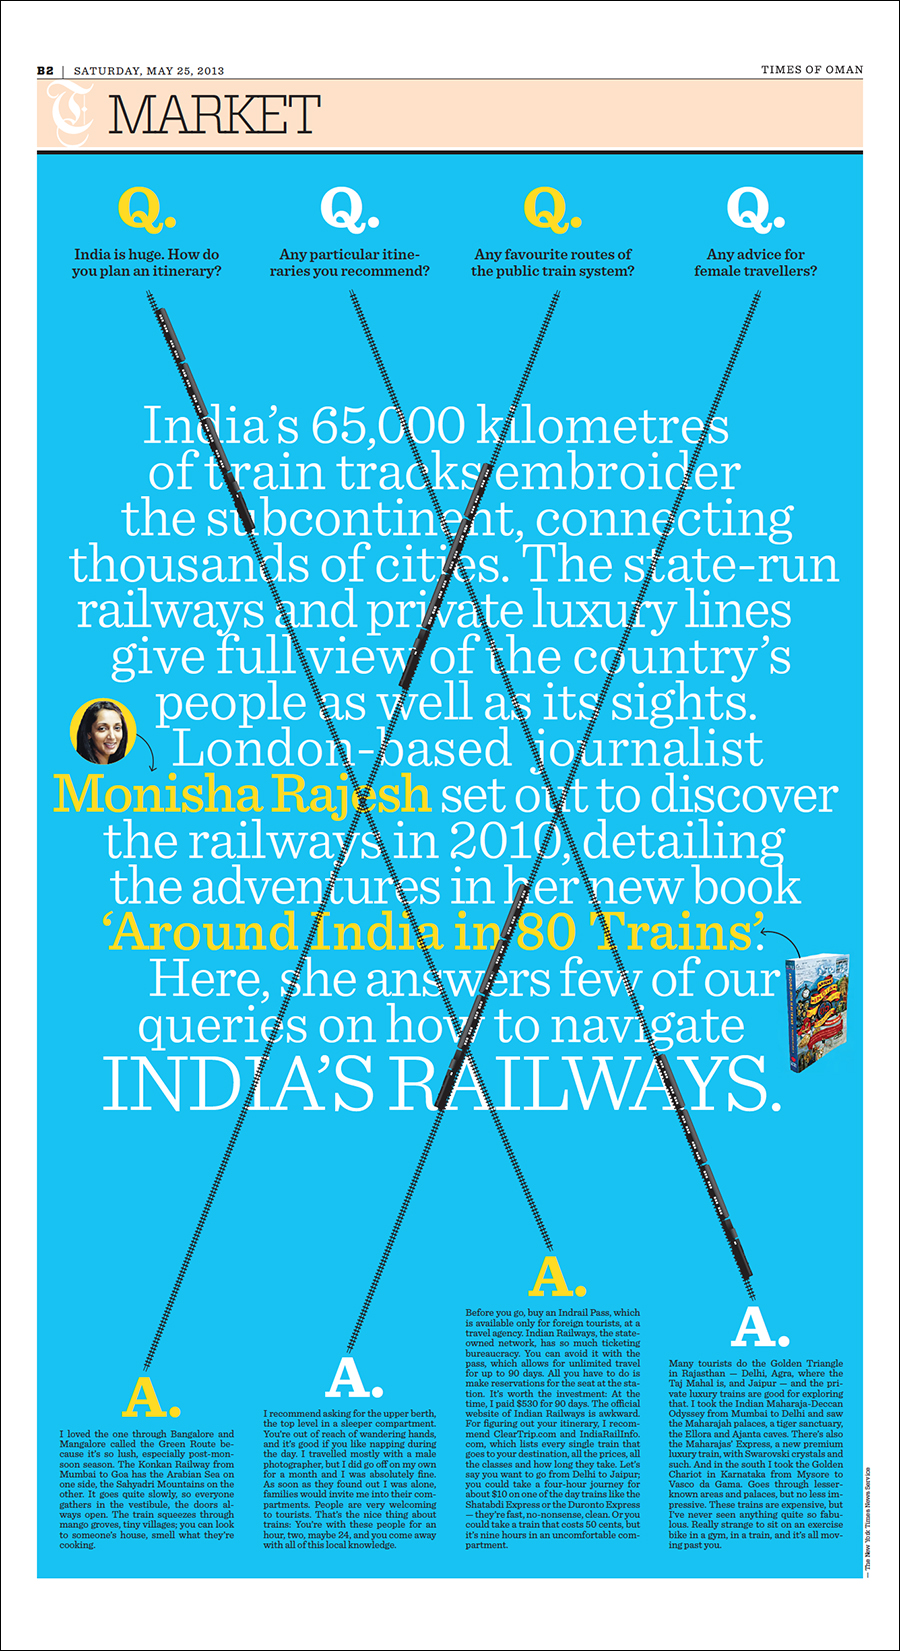
India by train “Perhaps here I was just too tired of the regular Q&A format. This playful treatment defies convention, and I even let the headline and the intro merge into each other.”

The poster for the gallery show.


The Accessible Icon Project

A PICTOGRAM’S ROLE IN SOCIAL CHANGE.

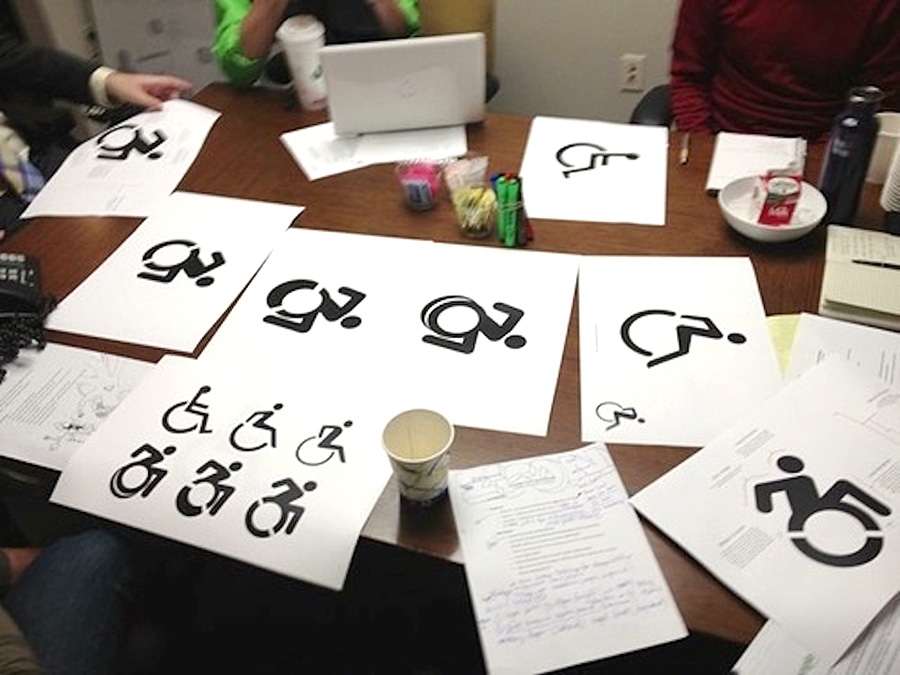
Sara Hendren and Brian Glenney started altering the icon that marks wheelchair-accessible parking spots in 2009. They put stickers on signs around Boston to make the standard symbol look more active. The International Symbol of Access was designed in the 1968 by Susanne Koefoed, in a competition organized by the United Nations. It’s promoted by the International Organization for Standardization (ISO).

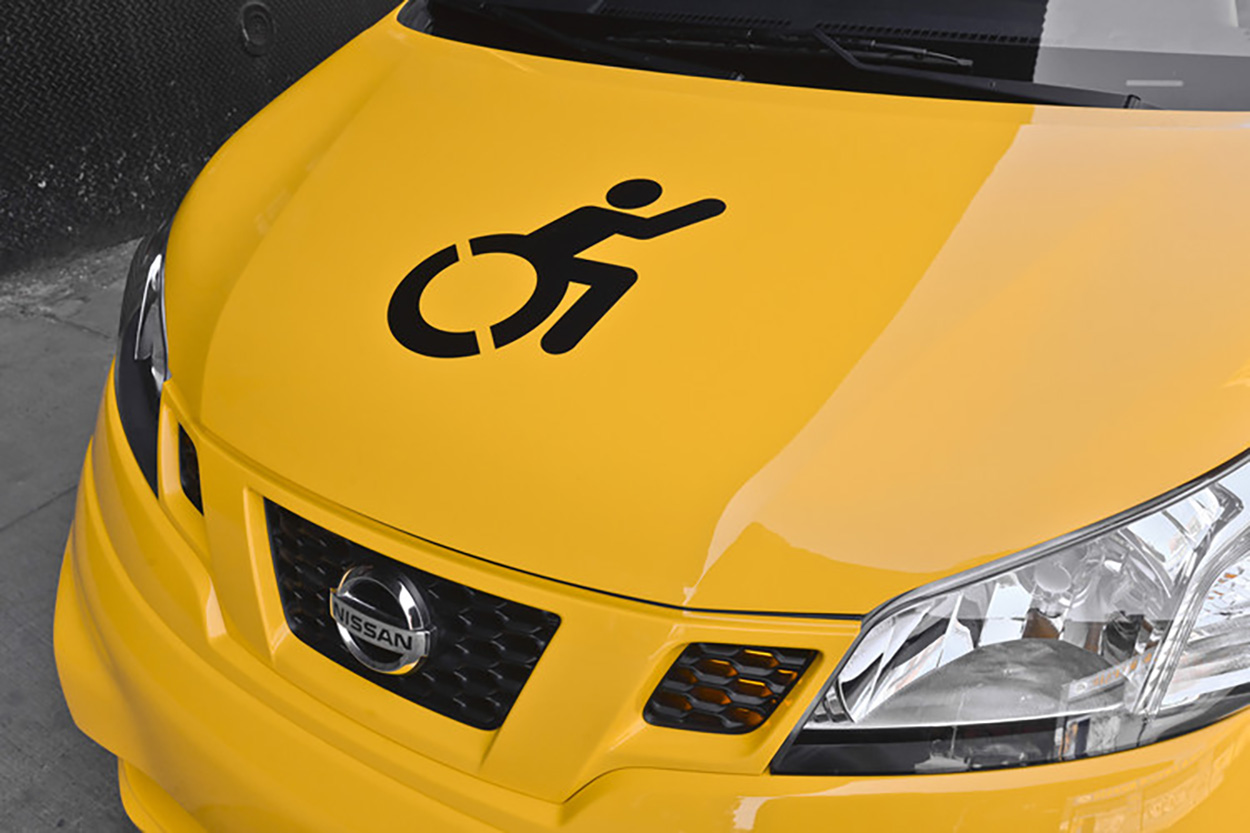
The Accessible Icon Project grew from these initial attempts to promote change. A team of interested people worked with a designer, Tim Ferguson Sauder, to finalize a new icon. The cutouts in the wheel make it easy to stencil and emphasize movement. The other improvements speak for themselves. When the design was finalized, it was put into the public domain.

Events around Boston, in cooperation with Triangle Inc’s community service organization, gave the new icon more visibility. And now it’s really taking off.

It’s on my phone.

MoMA has added it to their permanent collection.There’s a modified version on wheelchair-accessible New York taxis.

This pictogram is one part of a movement to encourage a more positive perception of people with disabilities.
Truly, it represents “Infographics for the People.”

Mercator projection

FROM THE SIXTEENTH CENTURY TO GOOGLE MAPS.

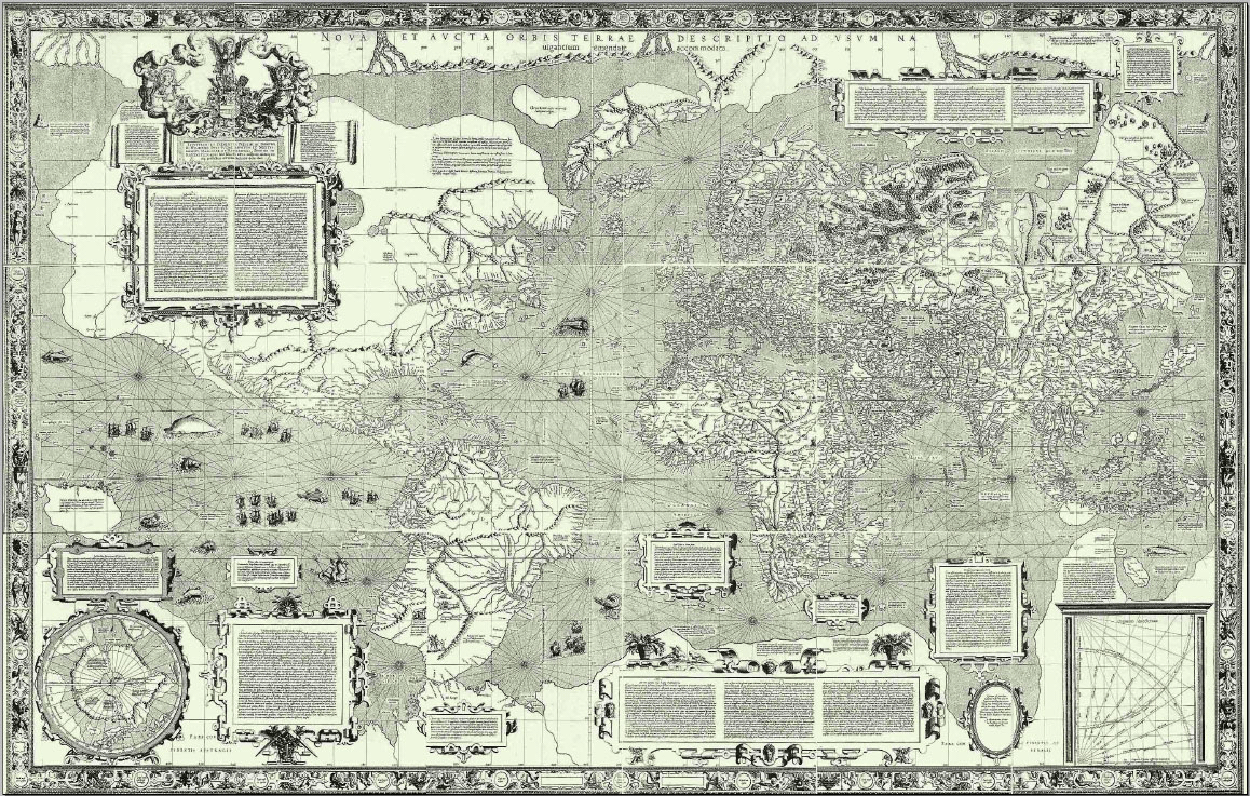
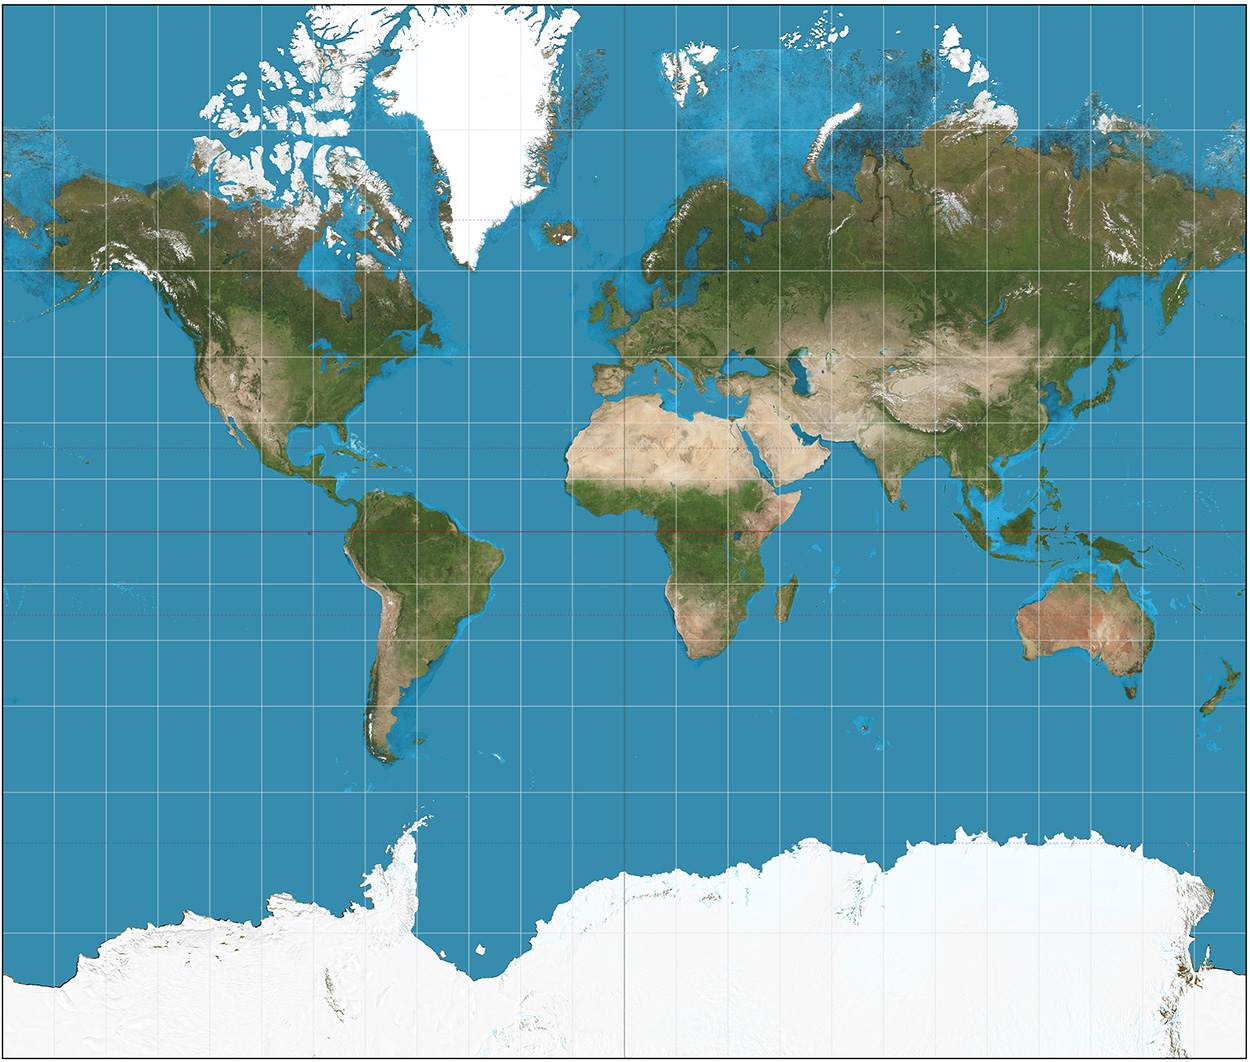
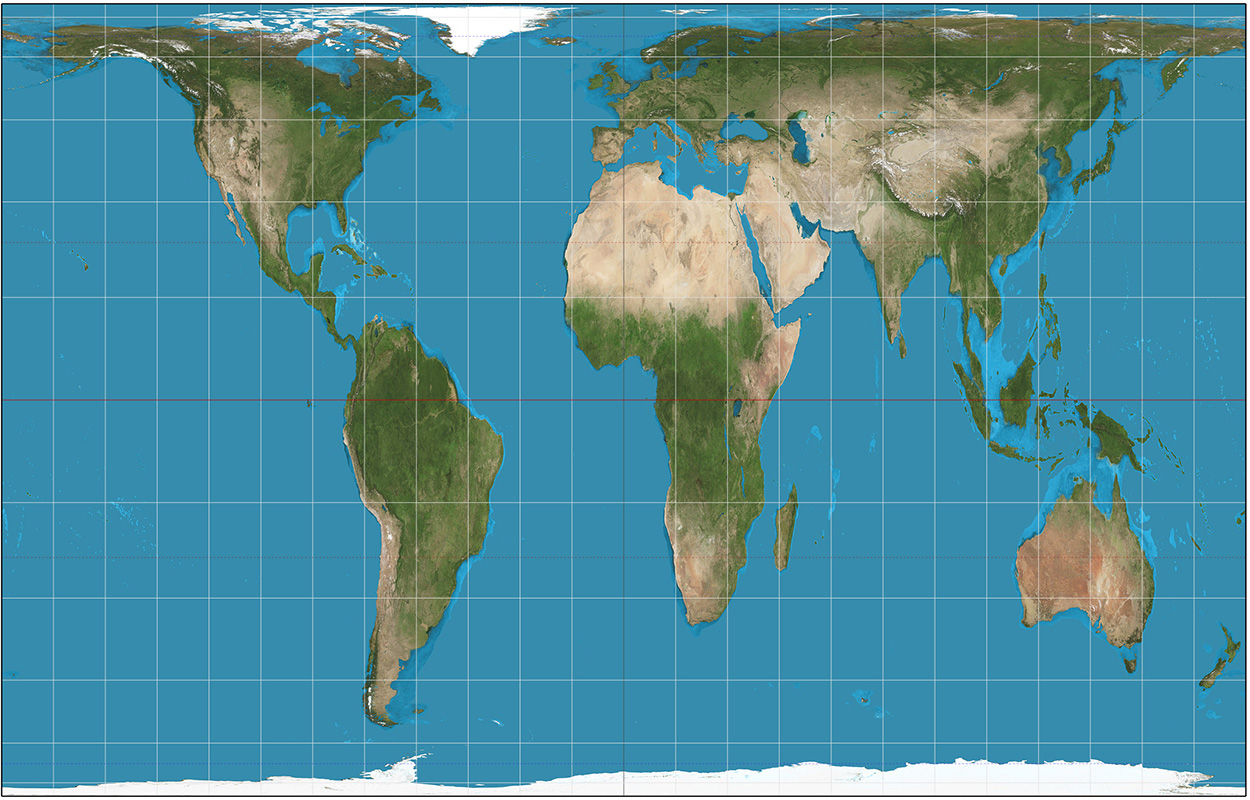
Gerardus Mercator’s world map dates from 1569. The scale is equal in all directions around any point, which keeps the angles and shapes of small objects intact. It worked really well for nautical navigation (which at that time was extremely important) because routes without changes of direction are straight, and consequently this projection became the standard. All map projections obviously distort the globe as they translate it to a flat surface, and the Mercator projection has a serious level of distortion the farther it moves from the equator. Greenland and Antarctica are quite substantial, to put it mildly. Europe is larger than it should be, which suited everyone back then.

Nevertheless, the projection has been a staple component of atlases until relatively recently. This site shows the Mercator-effect scale differences. Try it: goo.gl/7ks7hy

By contrast, the Gall-Peters projection accurately shows the relative size of land areas, but there’s considerable distortion, especially along the equator and at the poles. Also, like the Mercator, distances are not consistent. Consequently, many cartographers are not convinced that this is the way to go either. Nevertheless, UNESCO and UNICEF support this projection as a way of showing a fairer representation of the relative size of the developing countries.

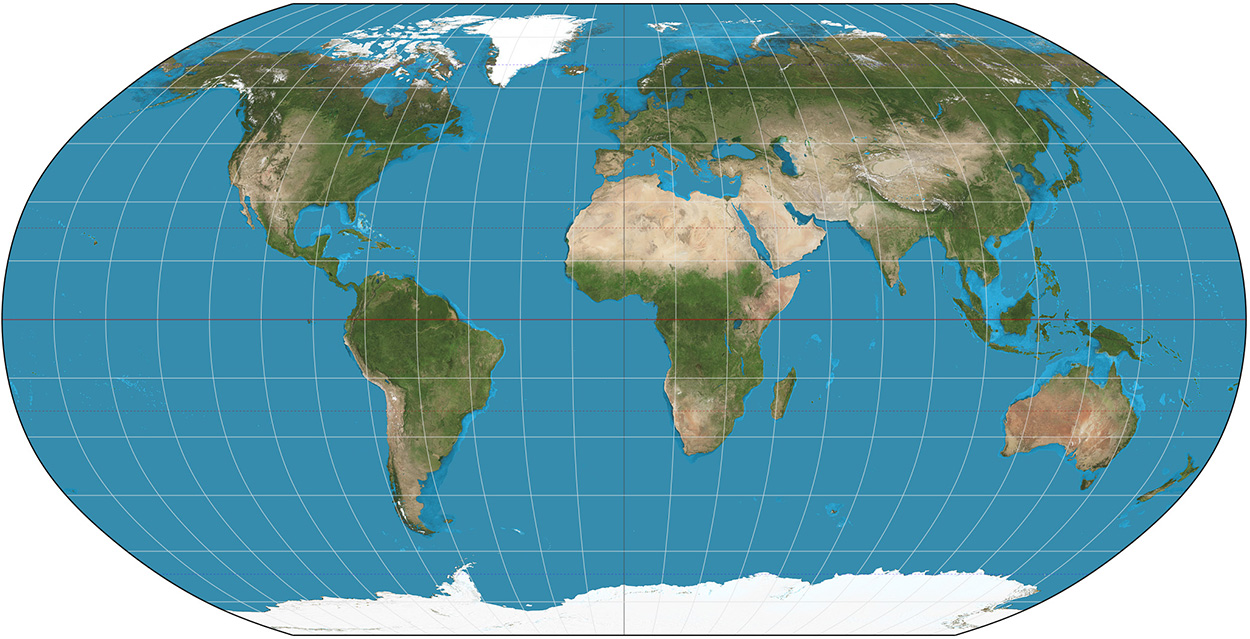
I’ve always liked the Robinson projection. It doesn’t tick all the boxes, but at least the land areas look something like they do on a globe.

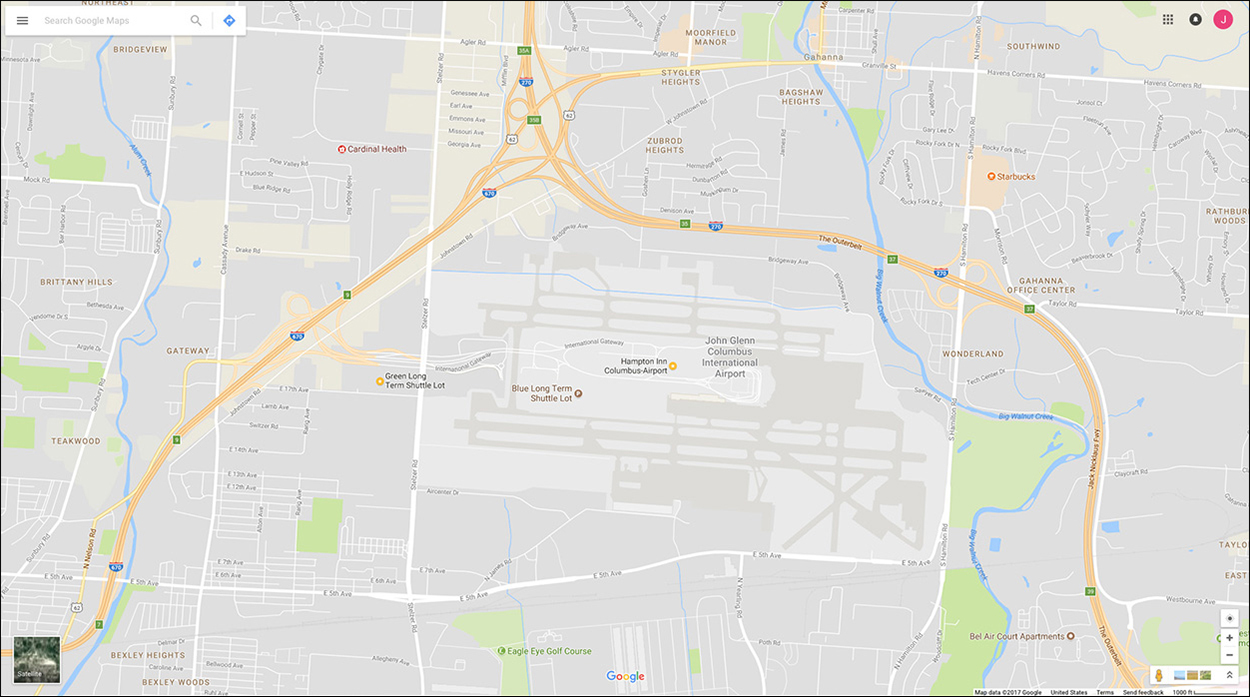
Many online applications (like Google Maps and OpenStreetMap) use a variant of the Mercator projection called Web Mercator. Why? Because with it’s parallel longitude and latitude lines, it scales really well from large-scale maps to local views, and north is always vertical. Distortion on a local scale is minimal. (I’ve been to the location below a lot in the last few years.)

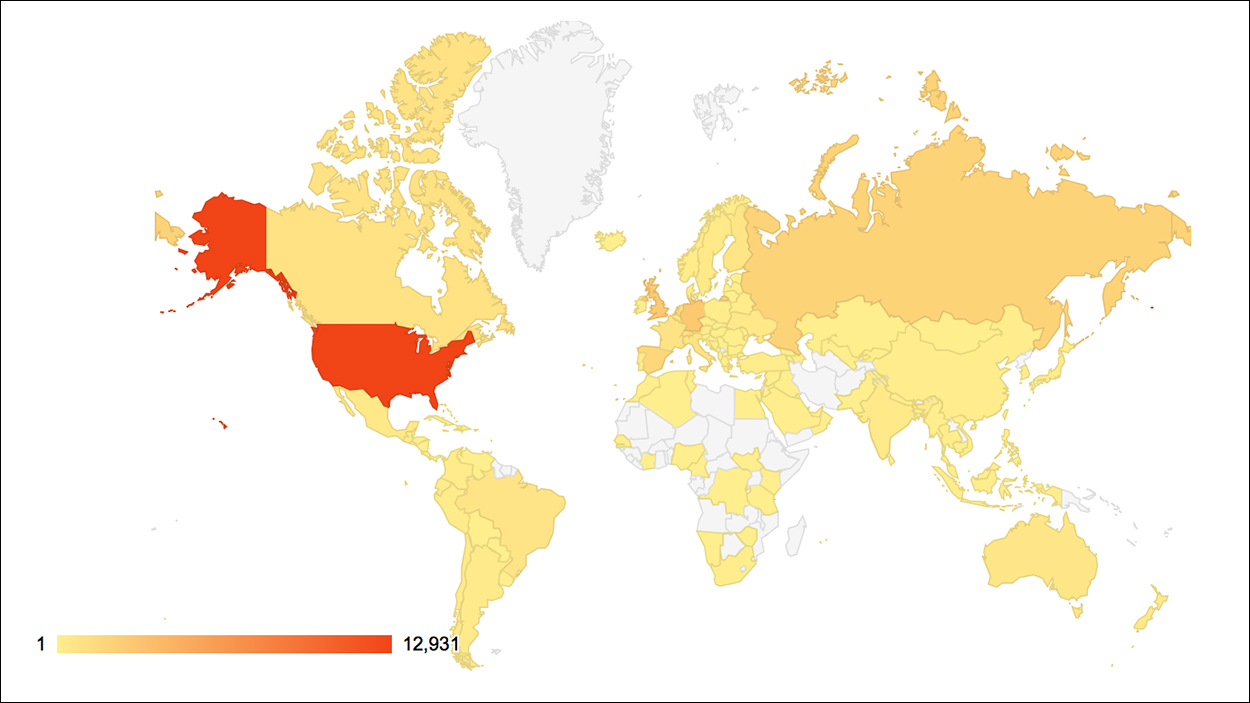
Here’s a WordPress map of views of this blog. No readers in super-sized Greenland. So far.

Mercator, Gall-Peters and Robinson images by Strebe.

Fernando Baptista in Ohio

A SCULPTURE AND INFOGRAPHICS WORKSHOP.

Last week, Fernando Baptista visited Ohio University. He gave a presentation to a packed auditorium, and the following day he began a two-day workshop for twenty students from the School of Art + Design and the School of Visual Communication. The group used the same methods that Fernando uses to make his superb illustrations for National Geographic magazine. Undergraduates and graduates worked together in a studio that is used for art and design classes. Countries (apart from the U.S.) that were represented: China, India, Iran, the Philippines and Spain.
Photograph above by Kisha Ravi (a VisCom photojournalism student).

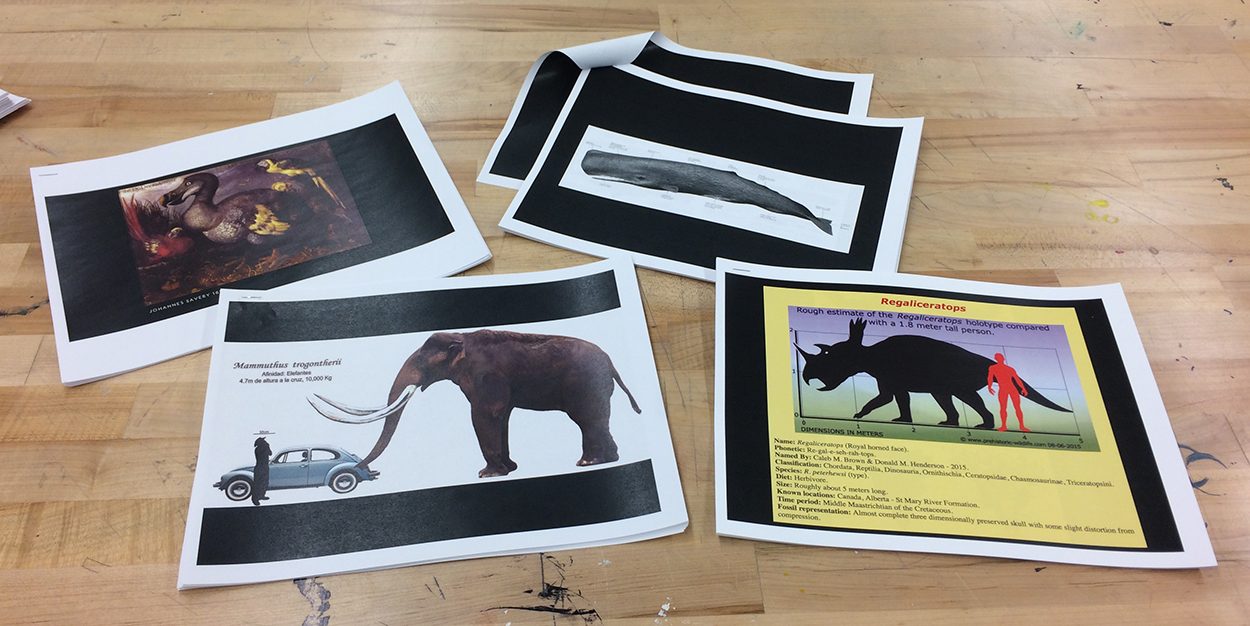
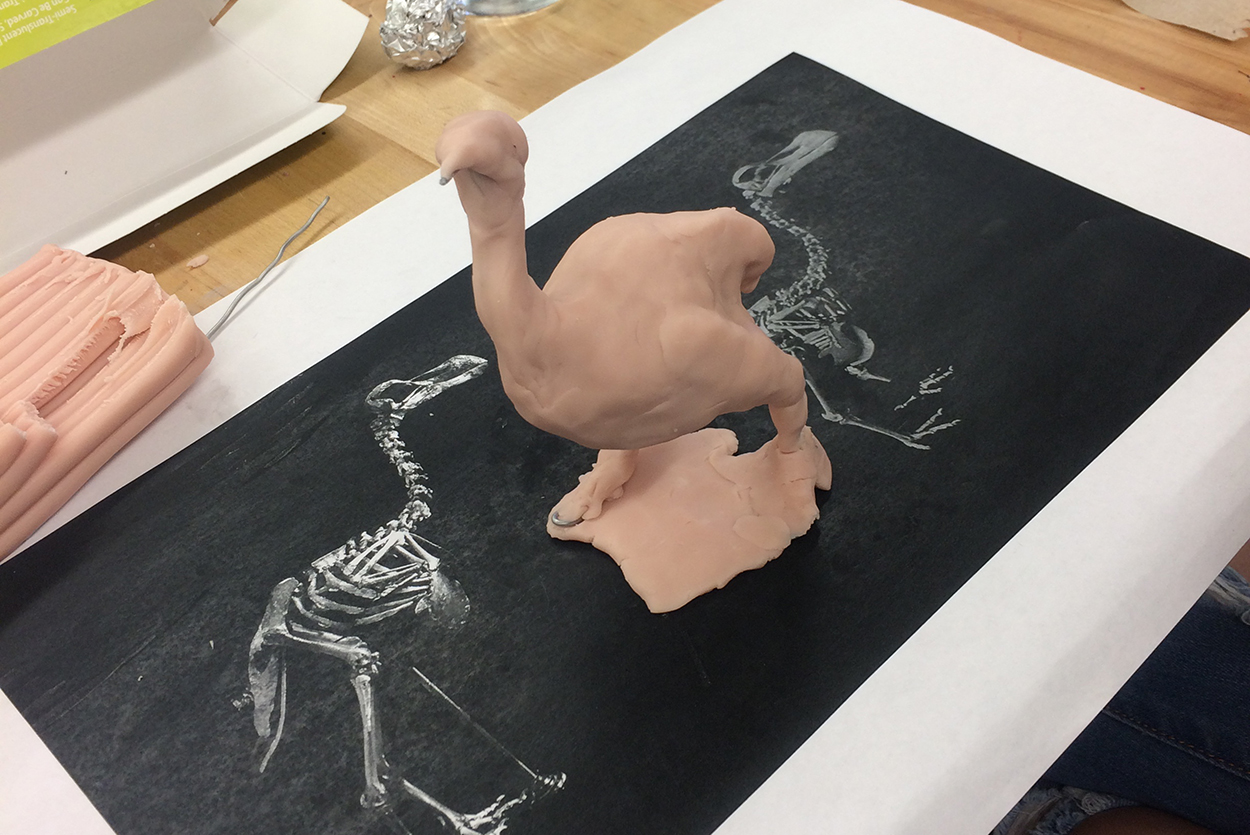
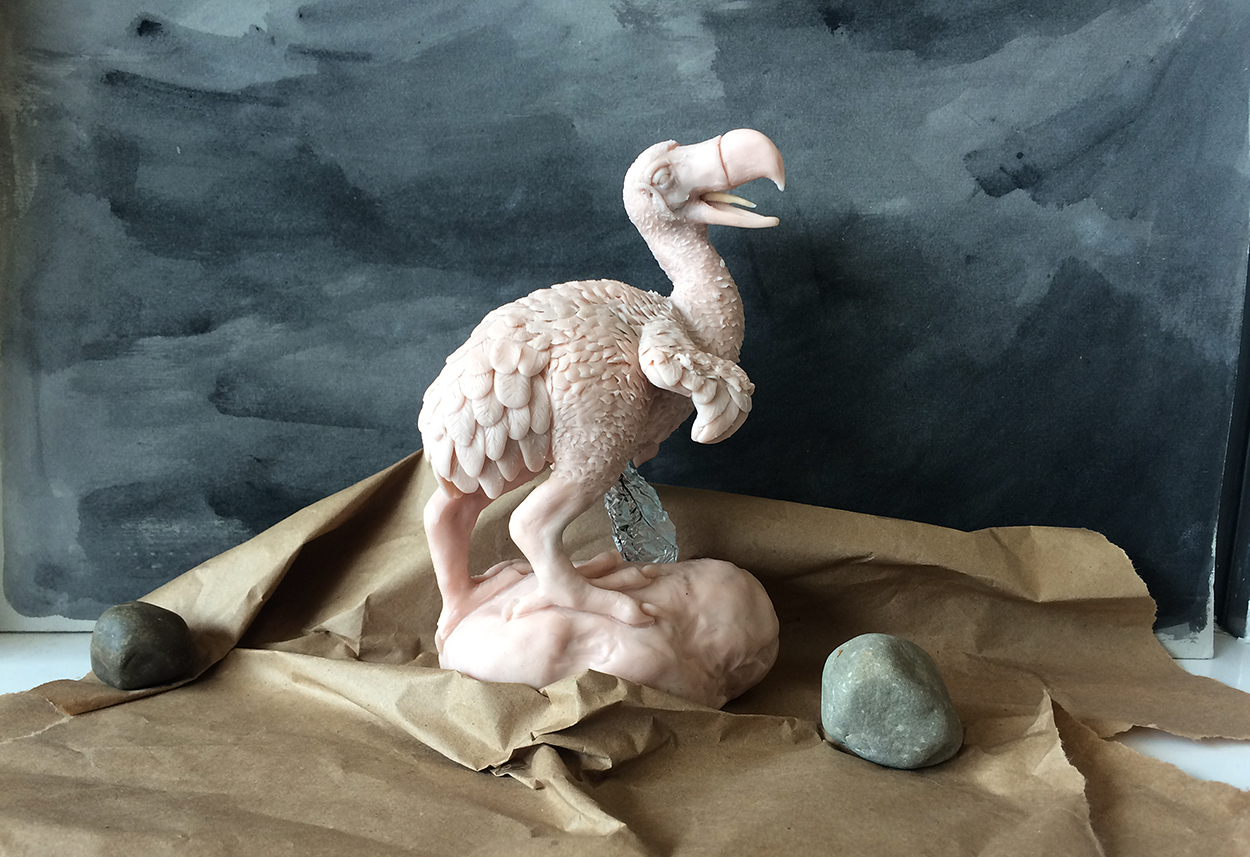
Day One The reference material. Students chose one of four subjects: mammoth, sperm whale, dodo or triceratops.

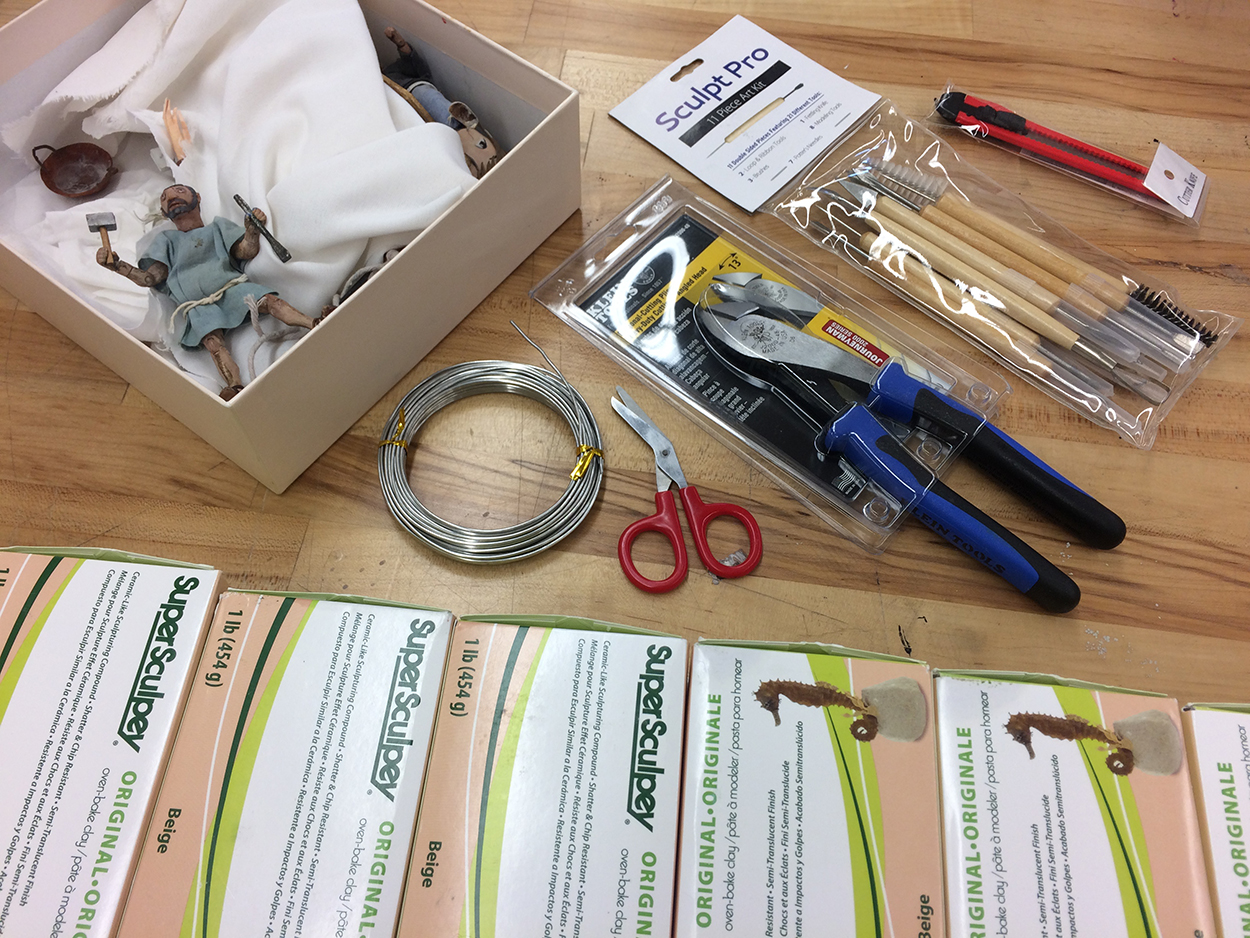
The equipment. Notice the figure from an animation about Trajan’s Column, who happens to be on the table. See the video here: goo.gl/jhqbkb

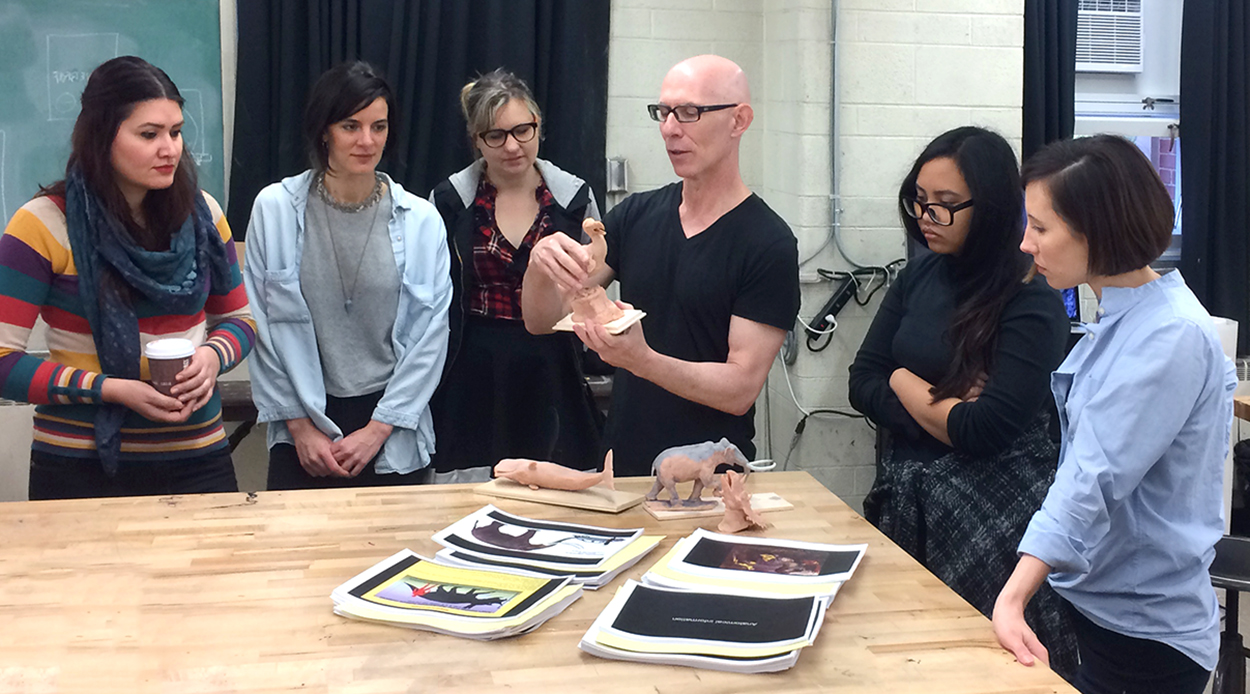
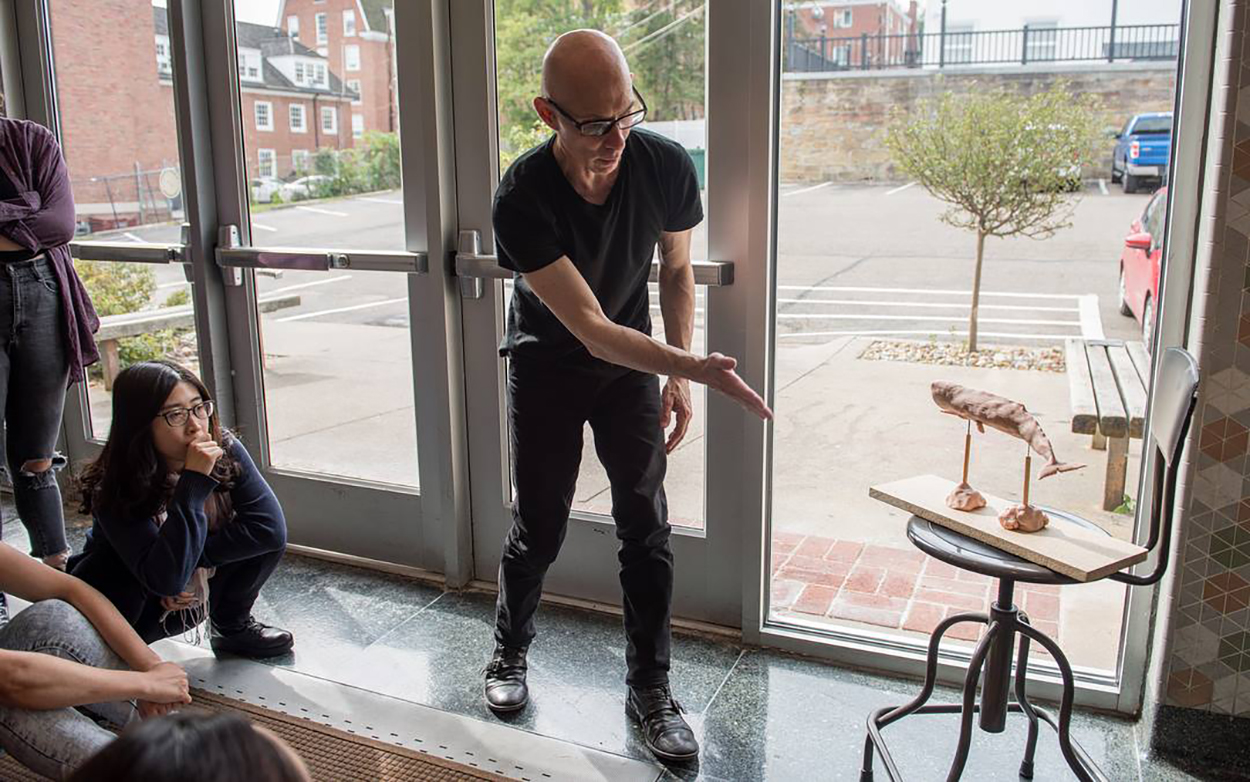
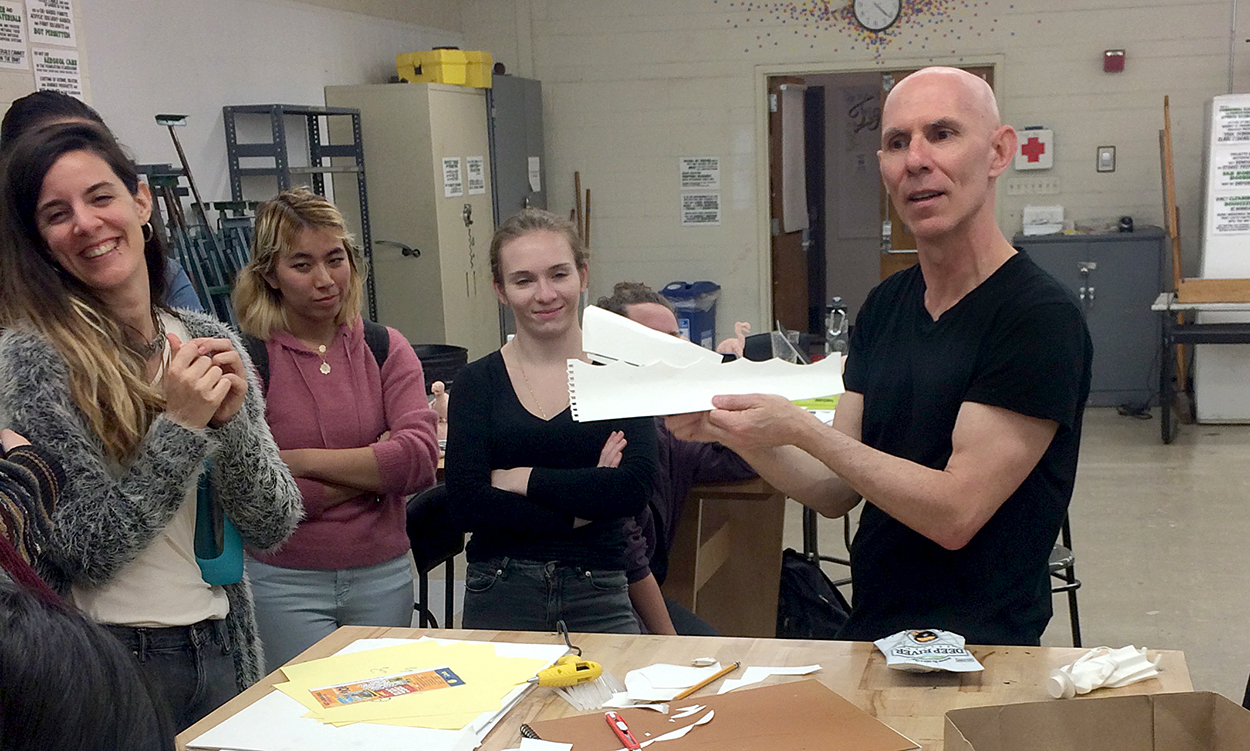
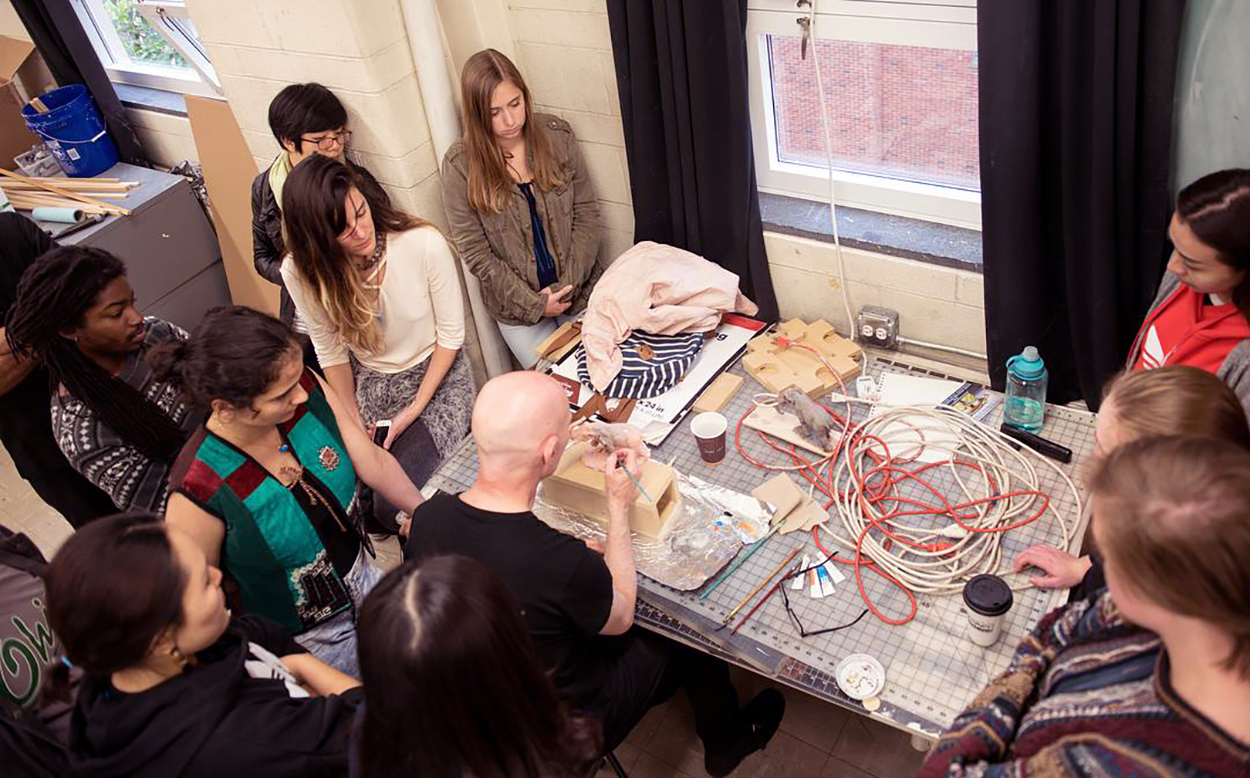
Fernando explains his process. Like all great professionals, he’s keen to share the lessons he’s learned during his career.

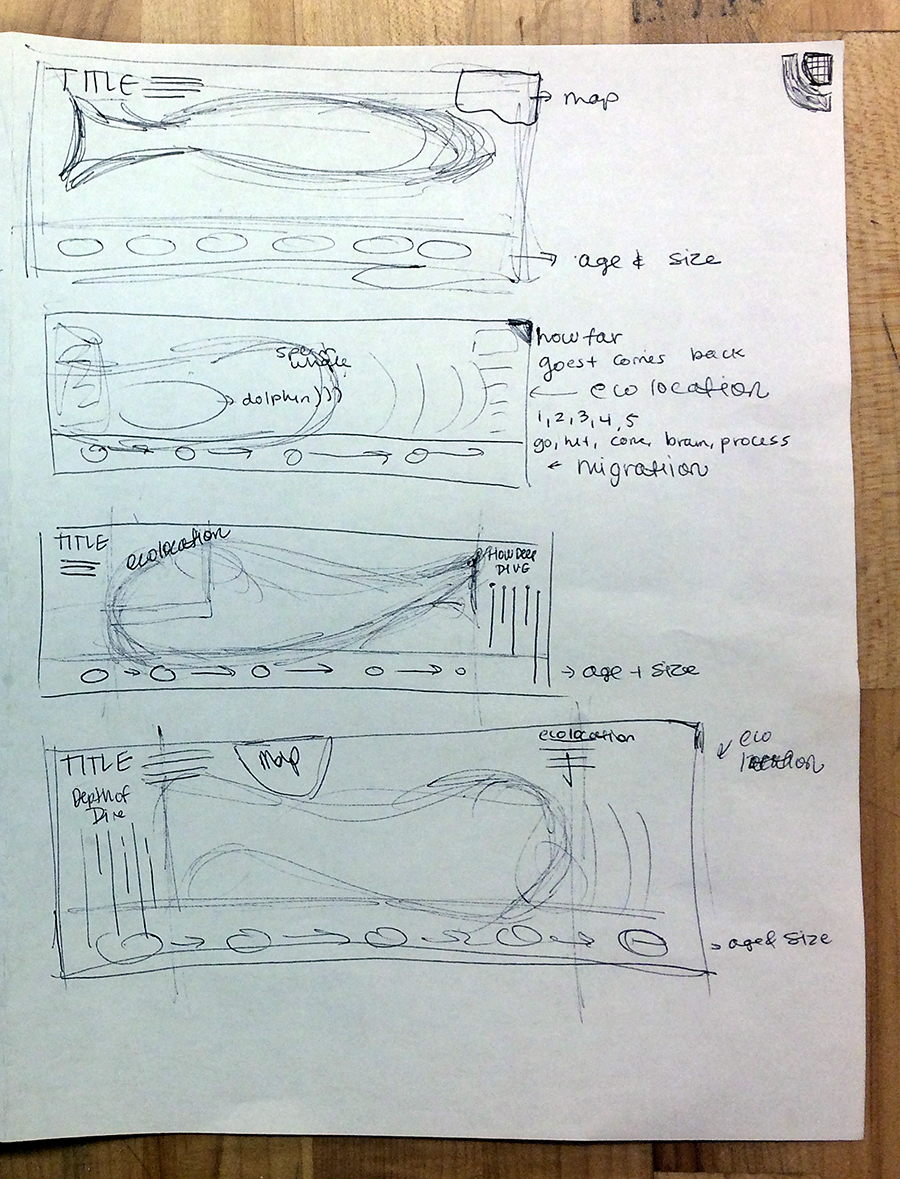
The first stage was to rough out ideas for an infographic. One student’s plans for a sperm whale graphic.

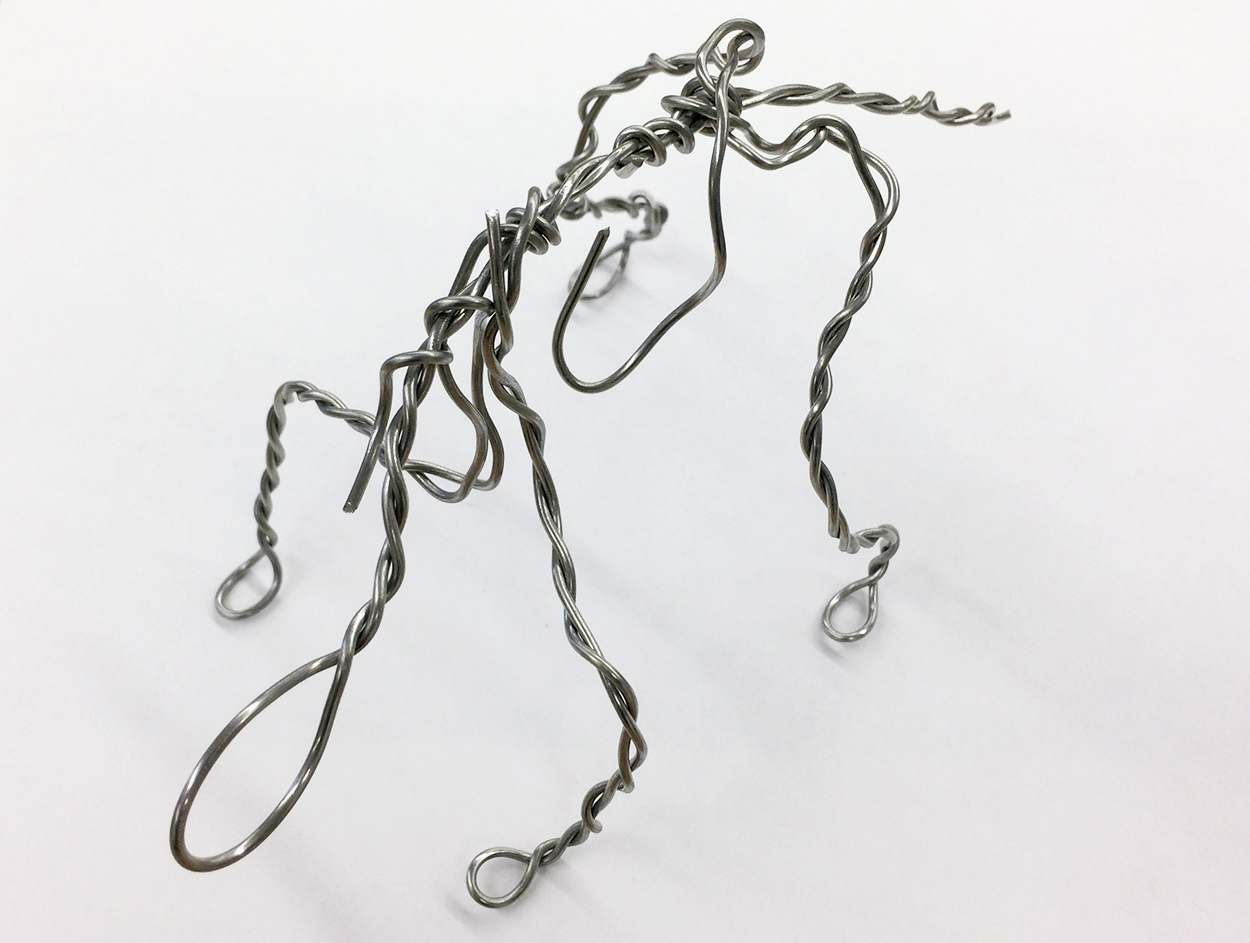
A wire armature was made to closely match the skeleton of the animal. In this case, a triceratops.

Aluminum foil was used to fill out the form (here, a dodo) before layers of Super Sculpey, a polymer modeling clay, were applied.

Adonis Durado, who was making a video of the workshop, modeling an impromptu portrait of Fernando.

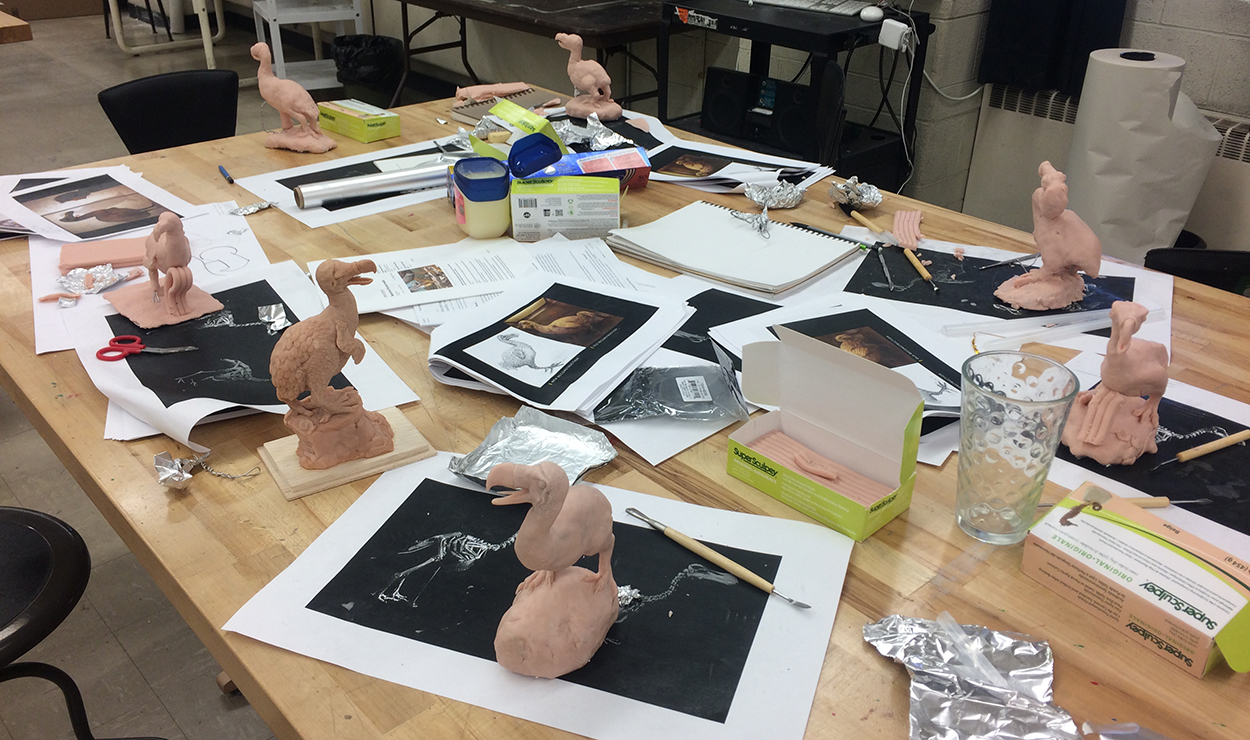
At the end of the first day, the creatures were really starting to take shape. I don’t often see a table of dodos on the campus.

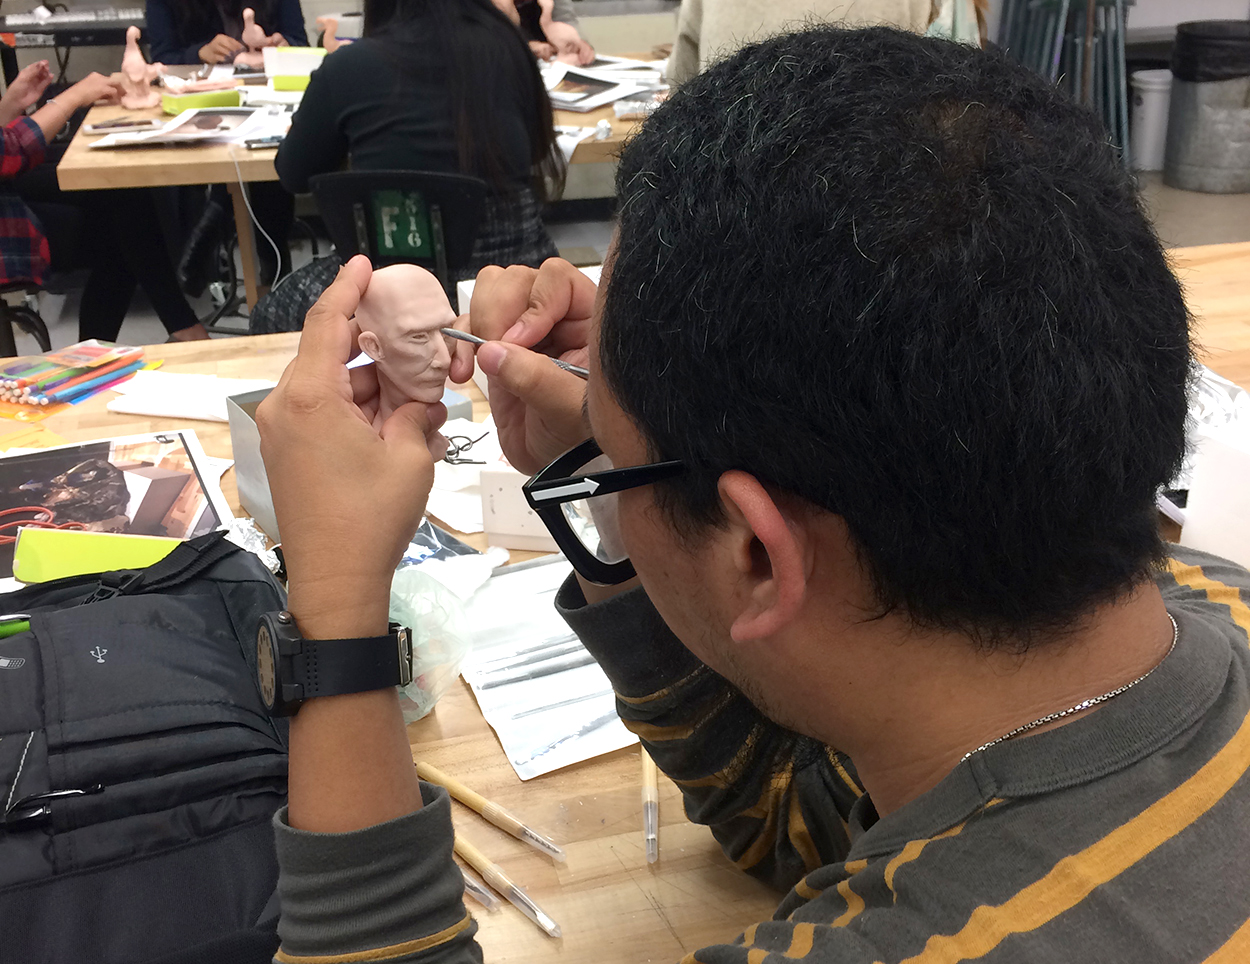
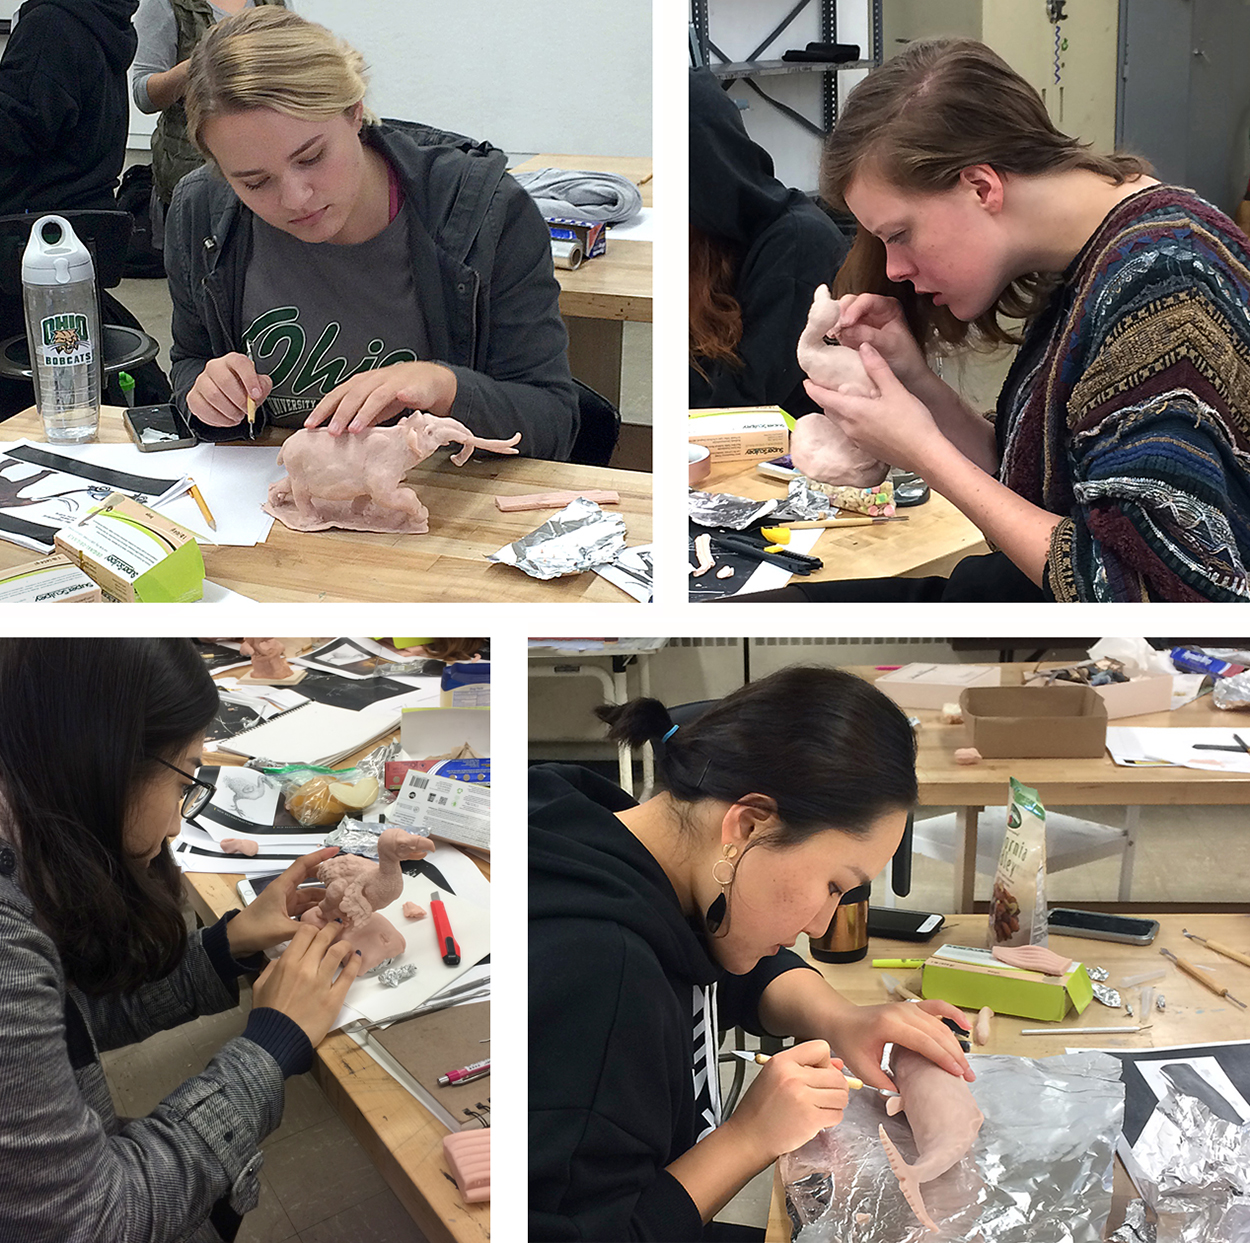
Day Two Refining the models. Adding the fine detail needed some serious concentration.

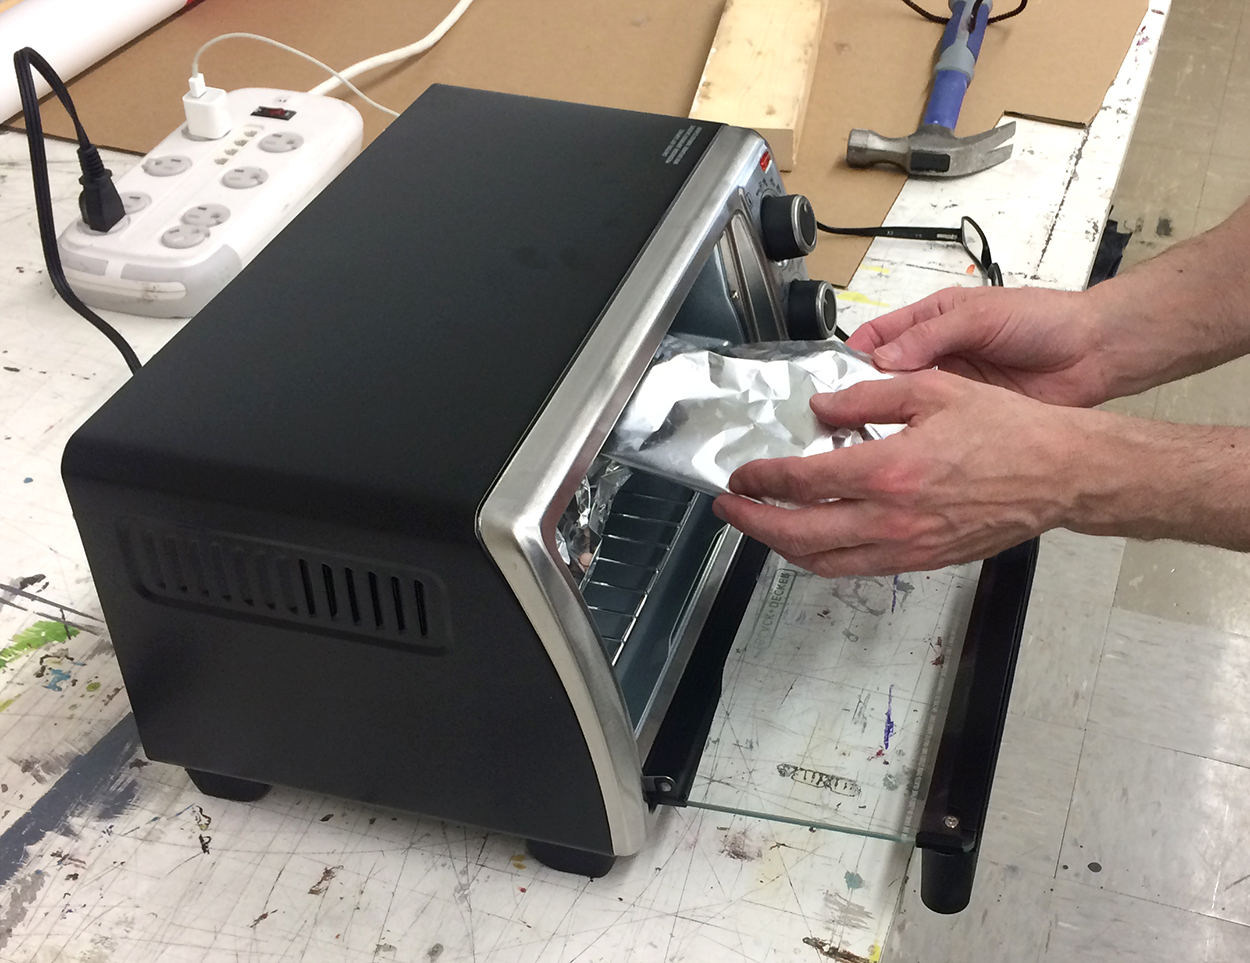
Small parts, like teeth and horns, were placed into a toaster oven to make them firmer, and easier to apply to the sculpture. The complete model would be hardened later this way.

Fernando showing how to use natural light to bring form and effect to a sculpture.


Photograph by Kisha Ravi.

A painted background, and some crumpled paper that will later become a rocky area in Photoshop.

Fernando tells us how a stop-motion animation of a whale can be created with simple paper shapes.

Students watch the master using his painting technique. There wasn’t enough time to paint the models, but color will be applied, either manually or in Photoshop, after the workshop. Several students told me that they intend to carry on with the projects, and develop them for their portfolios.

Photograph by Kisha Ravi.

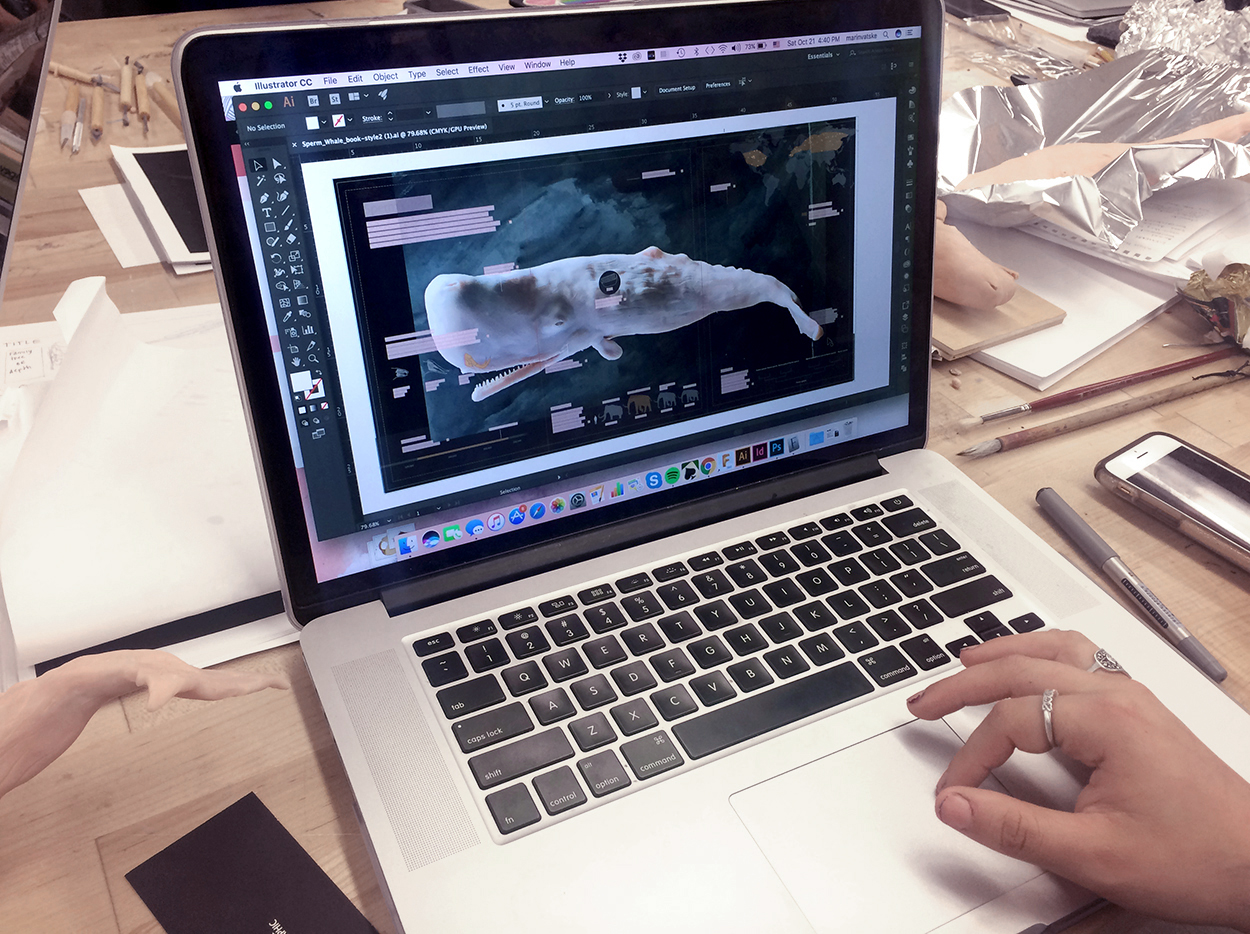
Starting to build a computer version of an infographic.

The workshop was a huge success. In no small part because Fernando put enormous effort into working with each student to help them move forward. It was tiring for me just to watch him assisting all those students for hour after hour. Thank you, Fernando!

Photograph by Kisha Ravi.

My overall impression: This is one of the best creative experiences we’ve ever offered our students. Fernando is a craftsman with a passion for information and explanation. And one of the nicest people in our entire field.

The School of Visual Communication: https://www.ohio.edu/viscom/
The School of Art + Design: https://www.ohio.edu/finearts/art/

VisCom on Instagram: https://www.instagram.com/viscomohiou/
Kisha Ravi on Instagram: https://www.instagram.com/kisharavi/

Clearview

A BATTLE BETWEEN TWO HIGHWAY TYPEFACES.

There are countless signs in the U.S. National Highway System, and the typeface that is used on them is the subject of a long-running argument about the attributes of two informational fonts.

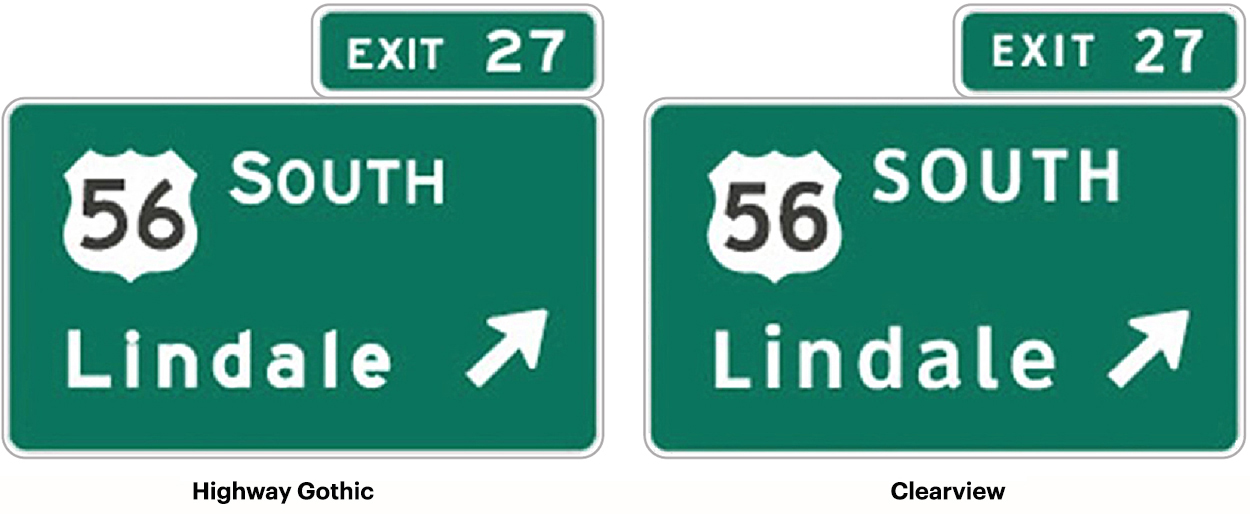
Typeface upgrade In the 1990s, Clearview (or ClearviewHwy) was designed to replace the existing road sign typeface, the Standard Highway Alphabet (or Highway Gothic). That font dates from the 1940s. Initial testing showed Clearview to be 2 to 8 percent more legible. A later test showed an improvement of as much as 12 percent. Unfortunately, further testing suggested that it might not be as effective at night as the original signs, despite the fact that a goal of the new design was to reduce excessive glow on reflective signs.

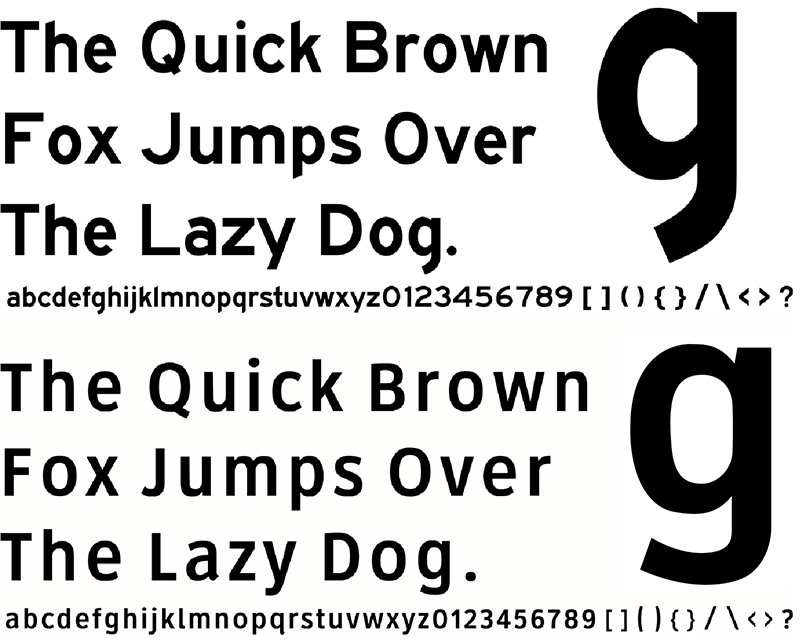
Upper and lower The existing road sign typefaces were used in a system where originally almost every word was capitalized. Clearview was designed to address the use of uppercase and lowercase characters with larger counter spaces and increased x-height. The space inside letters like “e,” “a” and “d” is much larger. The overall effect is intended to be increased legibility. Below, Highway Gothic and Clearview alphabets compared.

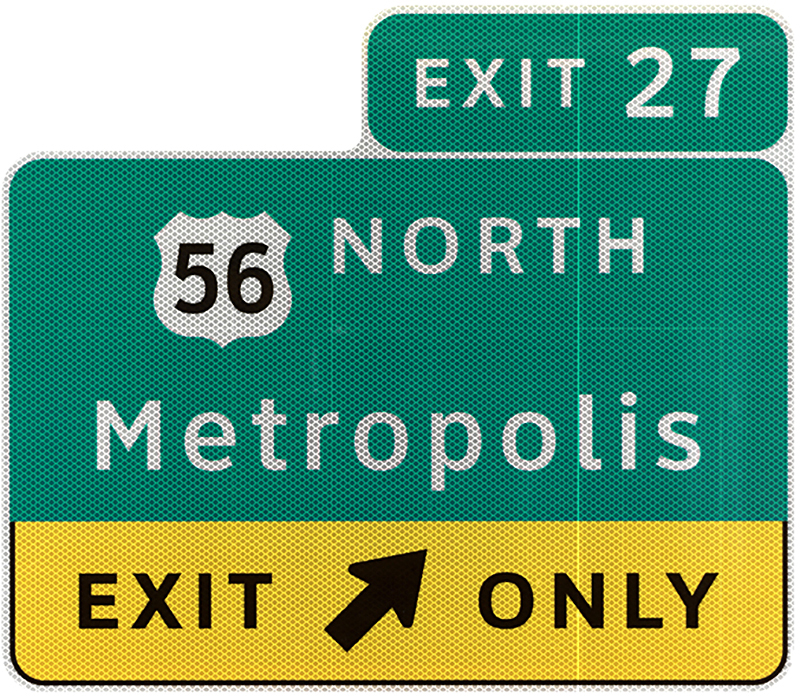
On and off In 2004, Clearview was provisionally approved by the Federal Highway Administration for use on positive signs (light characters on a dark background). But it was never approved for black on a light background, although some agencies used it this way. By 2014, there was a government-level move to stop using it, and by 2016 it was deauthorized. However, a bill was introduced in April this year asking Congress to approve Clearview for positive contrast signs.

In 2011, Clearview became the first digital font to be made part of the Cooper Hewitt, Smithsonian Design Museum. It has had some non-highway use, such as AT&T corporate applications and advertising, and signs at Dallas-Fort Worth International Airport.

Mixed signage Some states use Clearview and some states don’t. Ohio, where I live, had switched a lot of signs to Clearview, and now it’s started switching back to Highway Gothic (a process that will take decades). Many states have some signs in each font, due to the replacement of signs during different stages of the Clearview approval/non-approval process.

Money Clearview, unlike Highway Gothic, is not free. It’s licensed to state agencies. Is this a factor in it’s difficult path to acceptance? It’s been suggested that it might be the case.

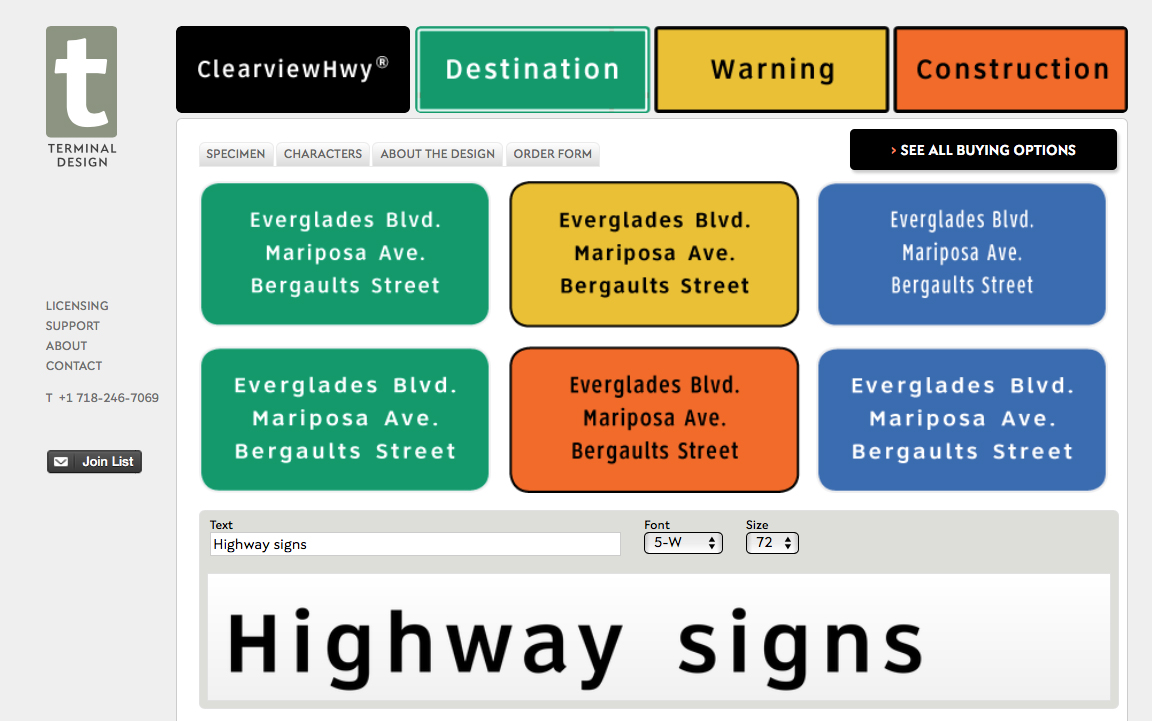
Clearview was designed by Meeker & Associates and Terminal Design: http://www.terminaldesign.com/fonts/clearviewhwy-complete-family/


Illusion

DECEIVING THE EYE.

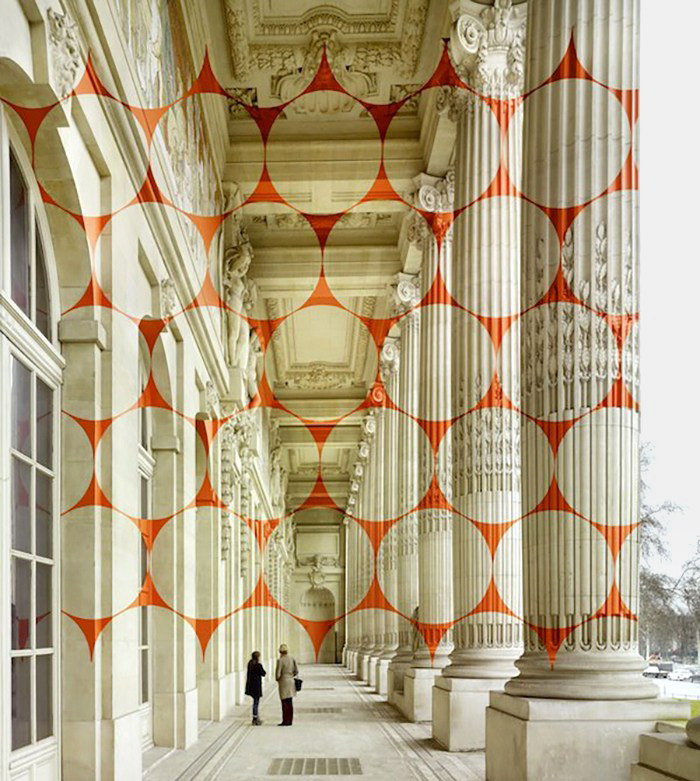
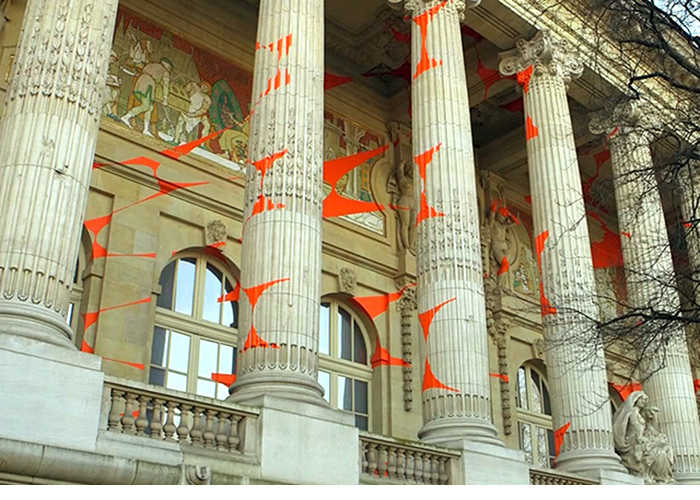
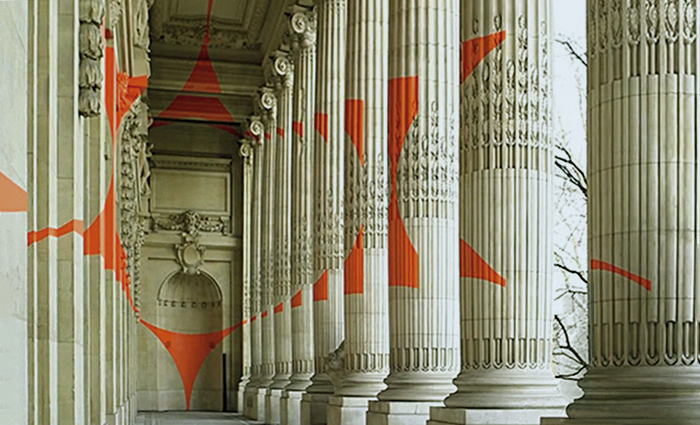
Space master Felice Varini creates geometric images, in public spaces, that defy our visual logic. His team uses a projector and stencils to painstakingly put each distorted component in the correct place. When viewed from a precise position, it all locks together for a spectacular effect. This example was installed on the Grand Palais in Paris. http://www.varini.org


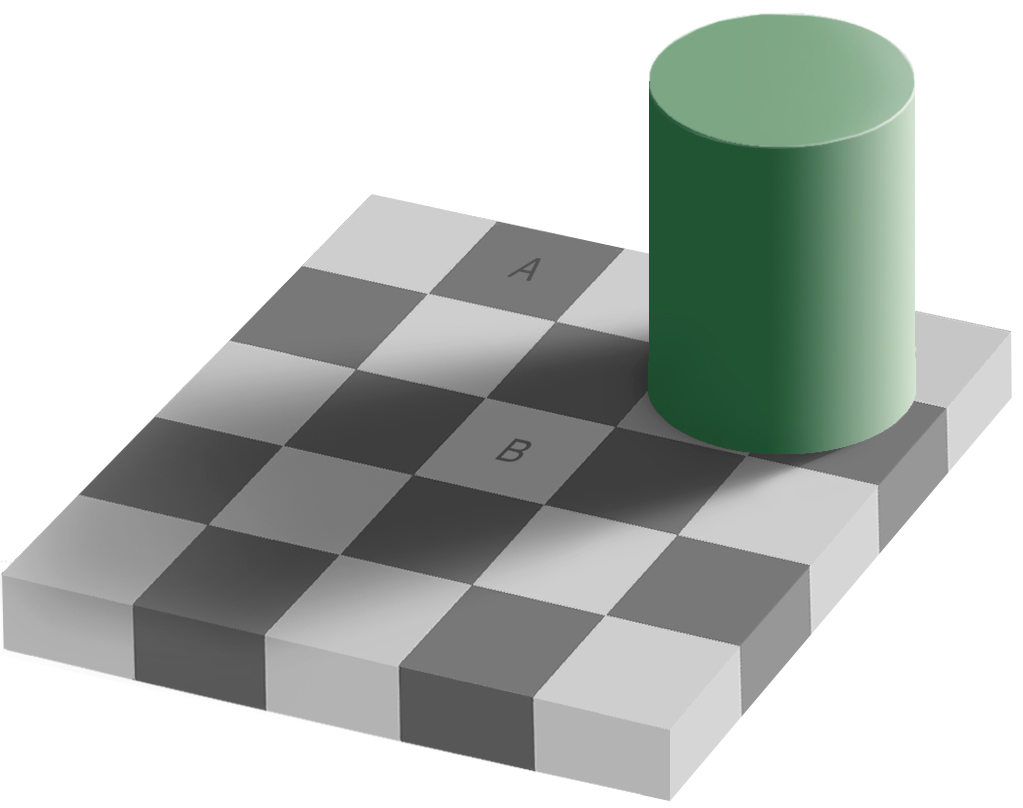
The same squares
A and B are identical. It’s all a matter of contrast.

Old favorite We all know this kind of image. Two faces or a white vase?


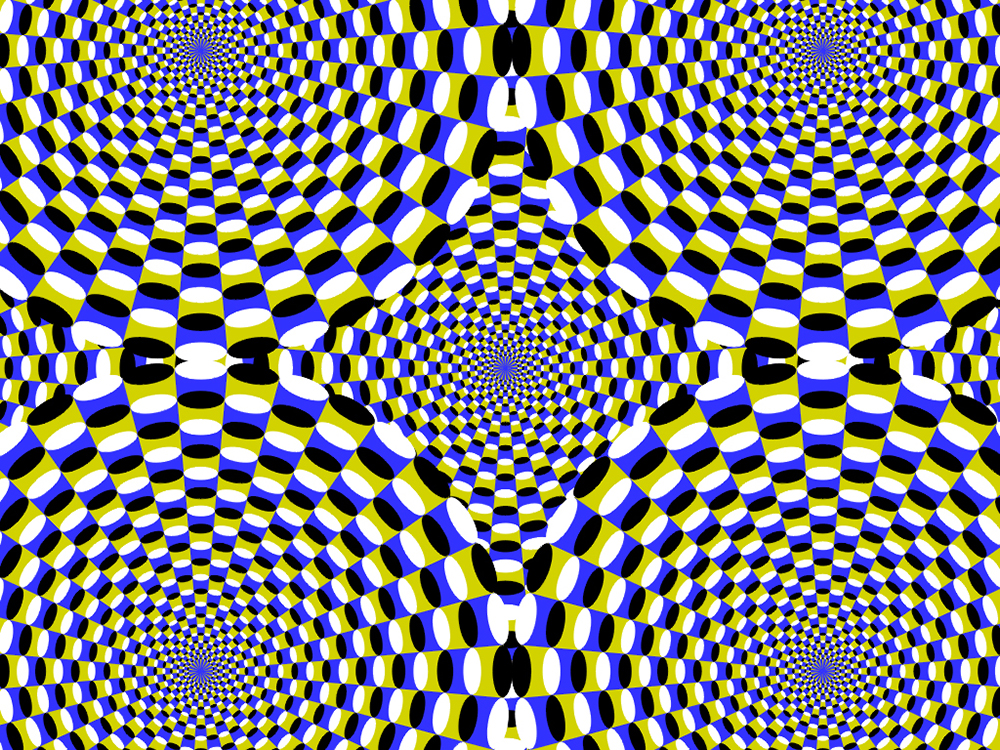
Motion
Strangely transfixing.


Not motion
 This is a static image. Where’s the Dramamine?


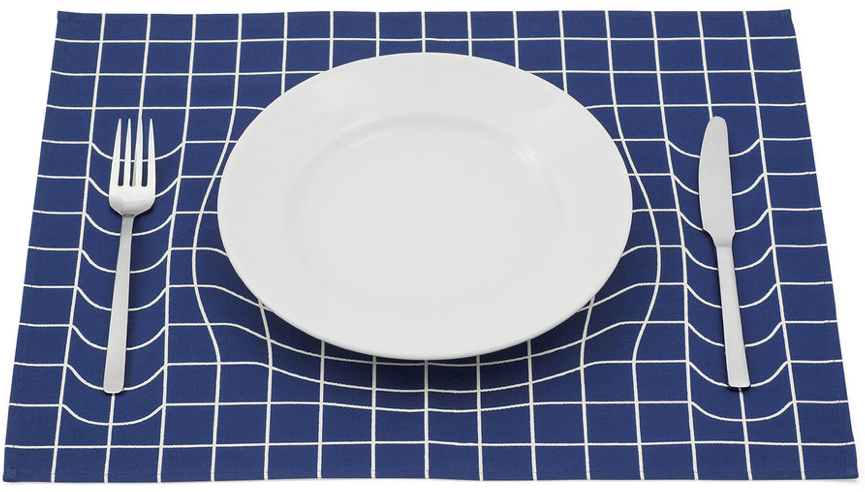
Dinner table
Everything appears to be sinking into the dining table with this completely flat placemat. goo.gl/VbQ3oY


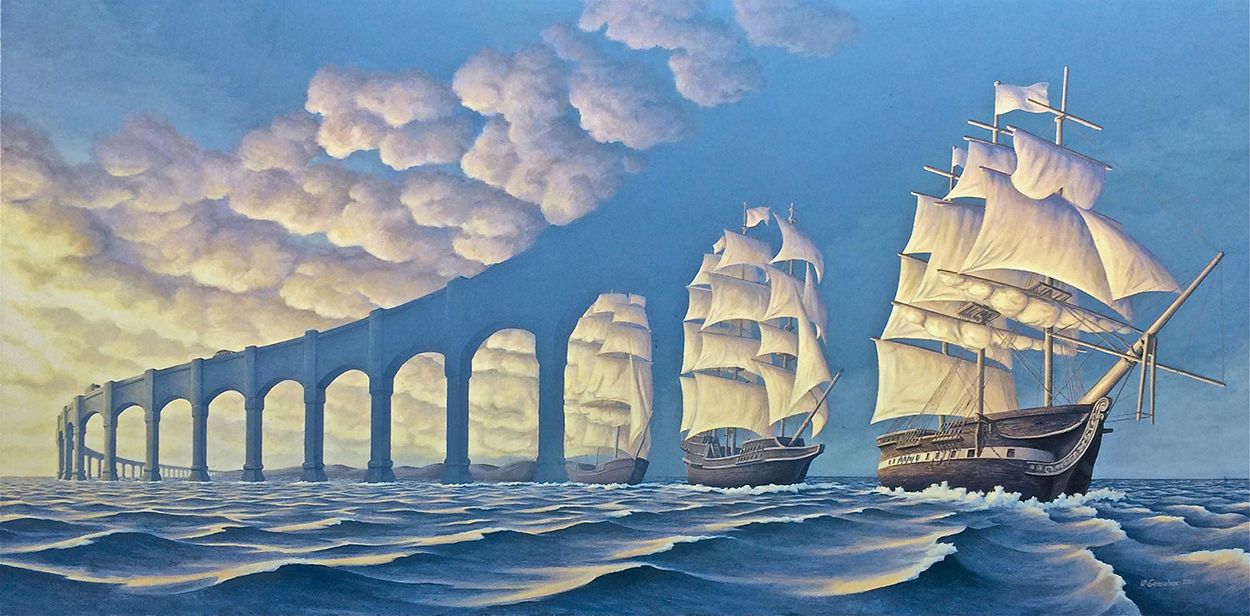
Illustrations that bend reality 
Below, by Robert Gonsalves.

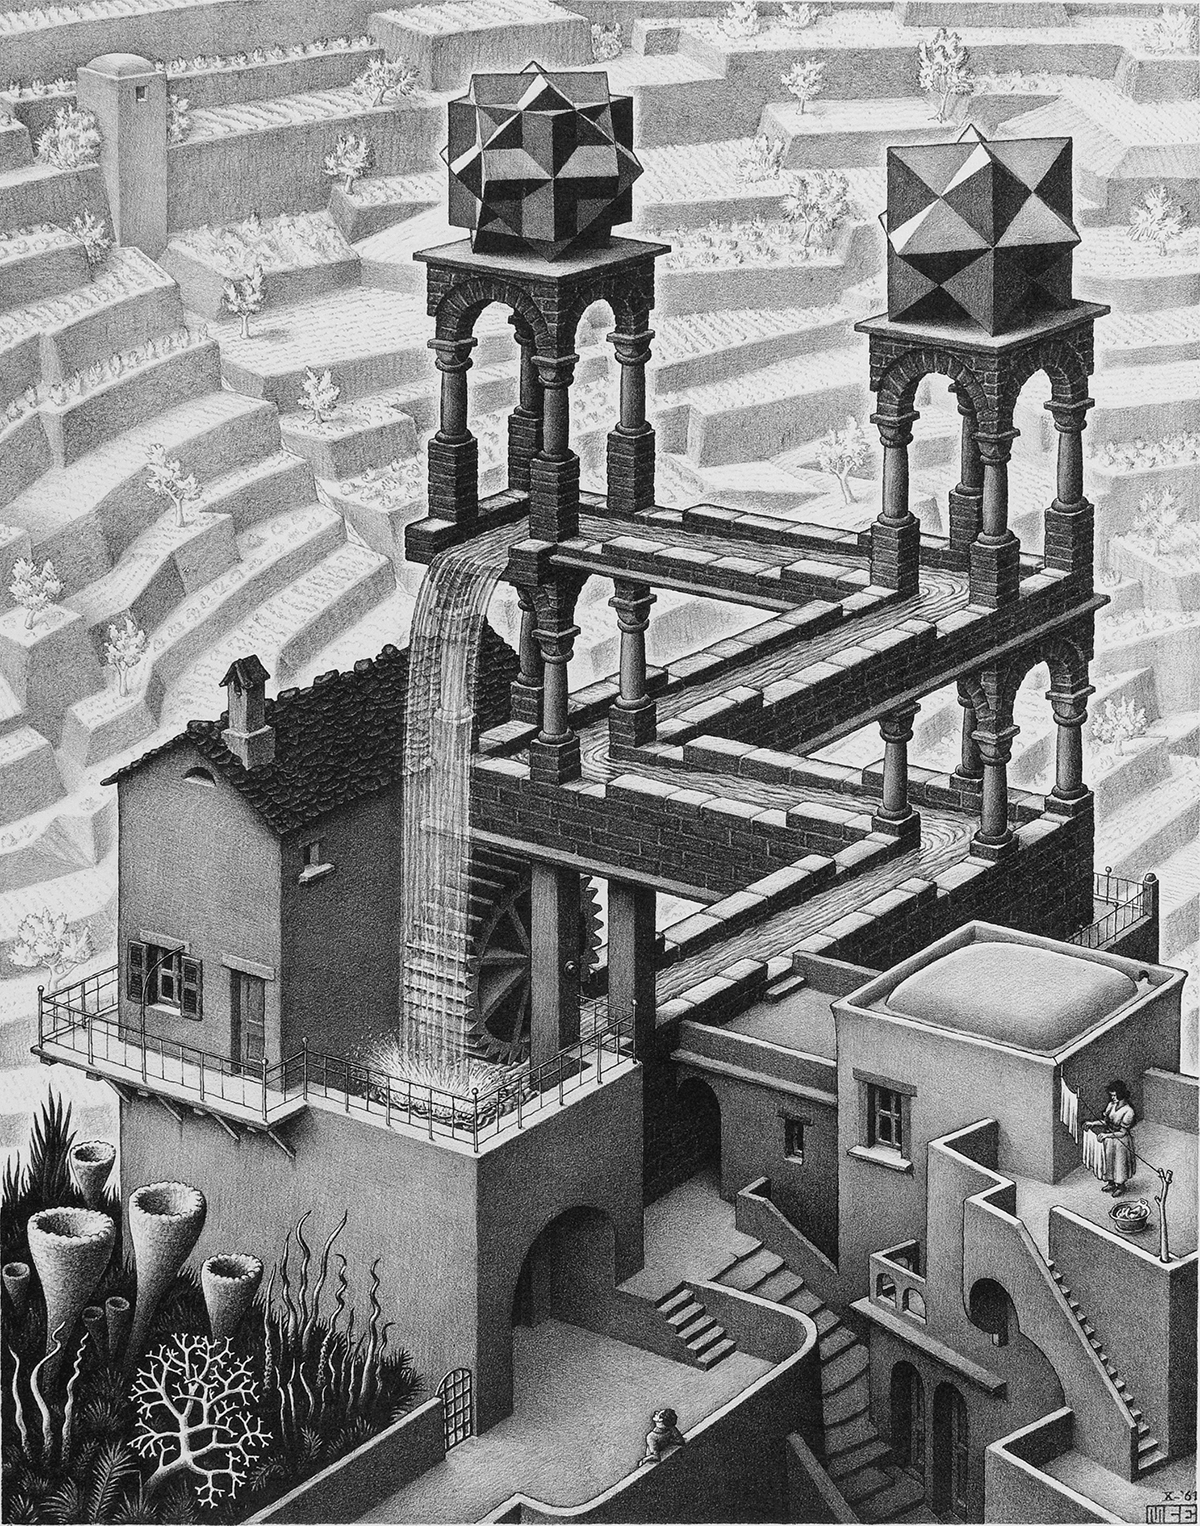
An example of the very popular work of M.C. Escher.

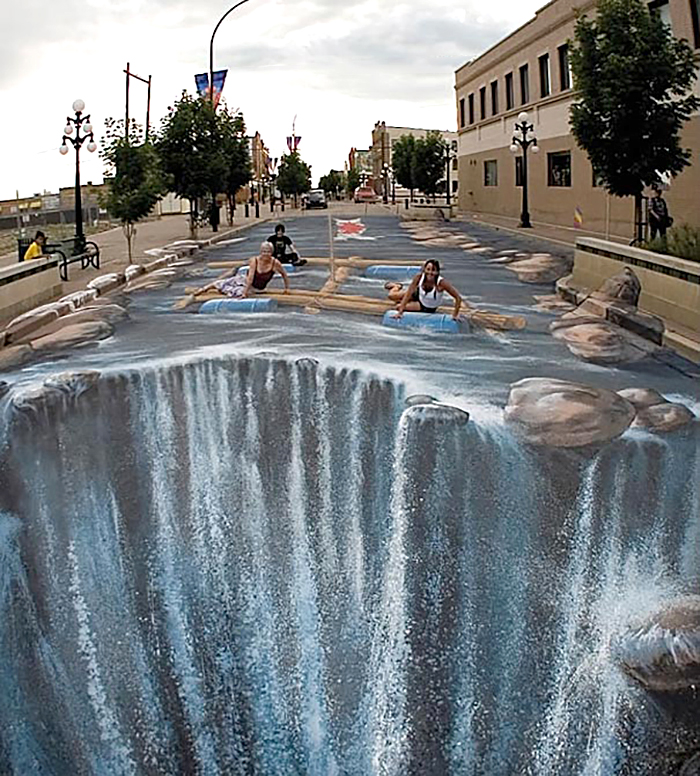
Chalk artists know how to manipulate perspective. By Edgar Mueller.

The $1,263 paintbrush

THE COMPLICATIONS OF EXPENSIVE ART EQUIPMENT.

I love a really good paintbrush, but I’ll never be able to buy the Da Vinci Maestro Kolinsky, size 50. Yes, it’s a very large brush, and of amazing quality, but the lowest price that I can find is $1,263 (on Amazon: goo.gl/XBfneP), and that’s with a 22% discount. Original price: $1,612.57.

Whether it’s worth that much money is another discussion, but there’s a story behind this type of brush. The brand is made in Germany from what is called winter male kolinsky red sable hair, which is not from a sable’s tail, but from the tail of the Siberian weasel. There is currently a ban on importing this type of hair into the US as the weasel is on an endangered species list (although to be fair, it’s low in that ranking). So if there’s a rush on this item when we get to the holiday season, stock could run out.

The smaller, and more affordable, size 16, Series 35 brush is around $300.

The cute Siberian weasel, which is killed for various reasons, not just for it’s tail hair.


Photograph © feathercollector/123rf

Some Da Vinci Maestro brush types that I’m only showing because I like good paintbrushes so much.

Equator

DIVIDING PLANET EARTH IN TWO.

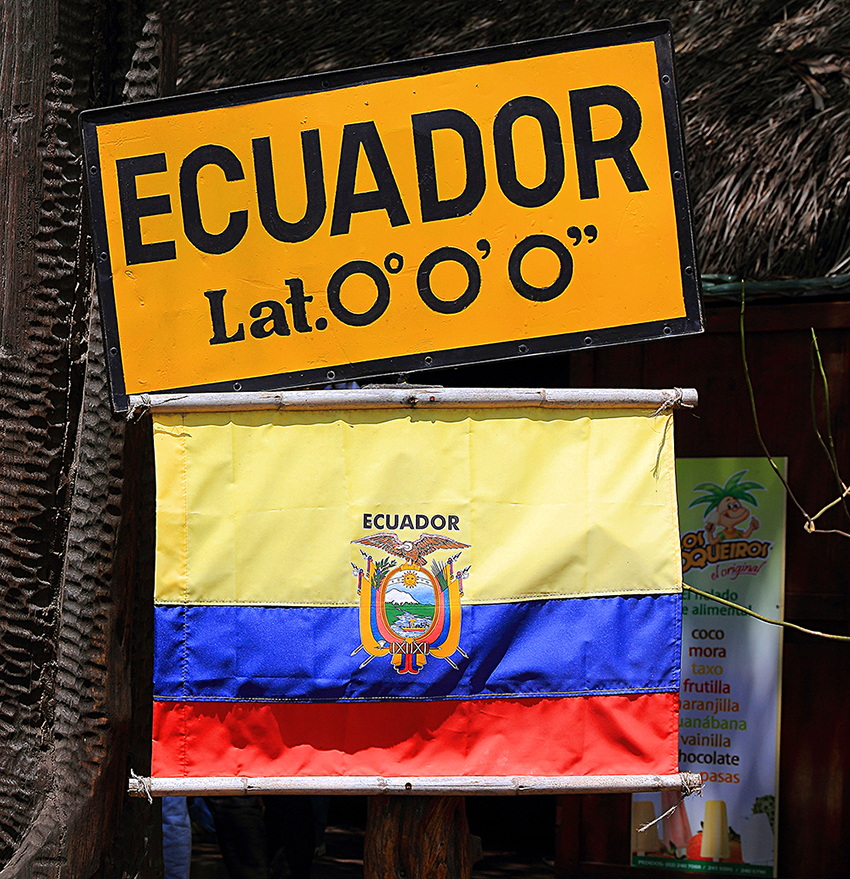
This post is the result of a conversation with Majo Carrasco, who is going to be a T.A. in my data visualization class next semester. She’s from Quito, Ecuador (which means Equator).

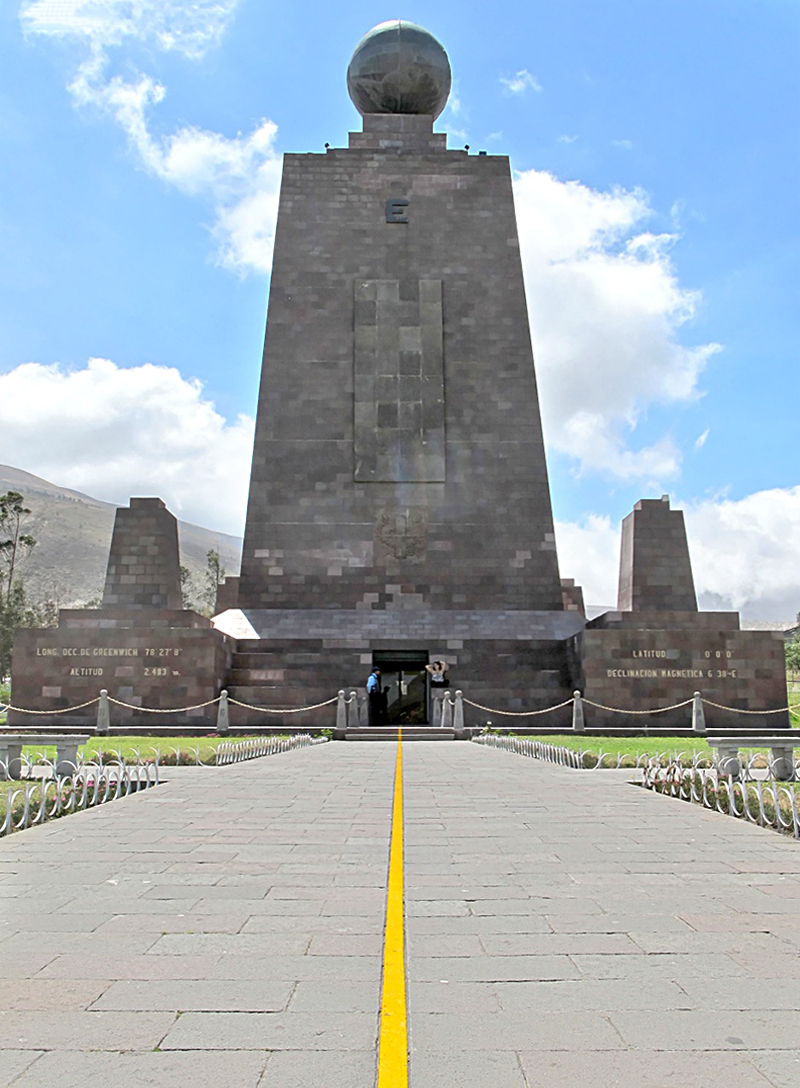
The Mitad Del Mundo (Middle of the World) monument, near Quito, sits on the dividing line between the Northern and Southern Hemispheres.

Well, almost. The real position is about 250 yards (229 meters) away at the Intiñan Solar Museum. GPS has provided a more accurate location than the one that was fixed by a French expedition in 1736. The Prime Meridian in Greenwich is also not in the right spot. It’s really 111 yards (102 meters) away from it’s marked location. Below, at the more accurate site. Photograph by C.T.Johansson.


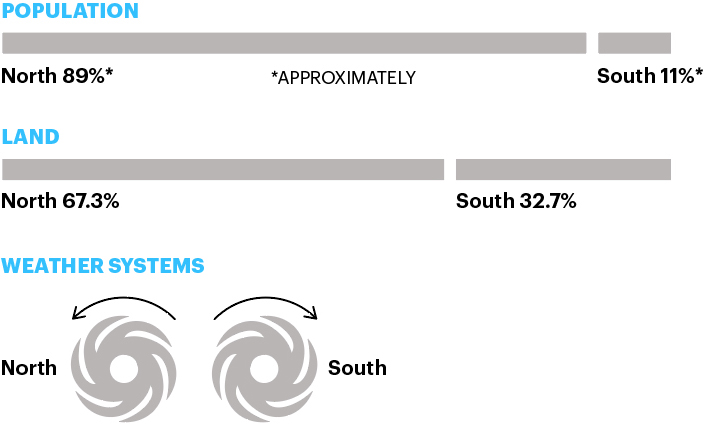
Some differences between the hemispheres:


I thought that the rotation principal also applies to water draining from a sink, but there seems to be considerable disagreement on this assertion: goo.gl/yRzjRr

Night sky The Southern Cross cannot be seen from most of the Northern Hemisphere, and Polaris, the North Star, cannot be seen from almost all of the Southern Hemisphere. But from the Equator, both are visible.
Below, the Milky Way from the Southern Hemisphere (La Silla Observatory in Chile).


Photograph by ESO/H.Dahle.

D.C. data viz

A WEEK OF DATA INSIGHT.

Six lessons from the experts A few weeks ago, I was in Washington with ten Scripps College of Communication students who are the pioneers of our “Semester in D.C.” program. We visited several top data visualization (and infographic) departments, who were very generous with their time. There were some common (and often encouraging) themes.

The points below are not great relevations to the people who read this blog, but perhaps it’s a good thing for us all to stop and reflect on the way forward for our field. They are skewed somewhat towards news outlets, as those were mainly the places we visited.


1. Mobile first Everyone is seeing their audience steadily migrating to mobile, so that has become a big factor in data design. Simpler, often static, displays with limited interactivity are common. Many of them are controlled by scrolling.

2. Limited interactivity On all platforms, if a tap or click is required it has to deliver something that feels worth it. Obviously, mobile (with it’s limited screen size) can be challenging for this kind of interaction anyway.


3. Design for the intended user 
Crucial when making decisions about the level of complexity, and the type of presentation. Often, displays of data are not well-enough refined for their target audience. For example, Vox aims for general consumption, especially through social media, and takes a more edited and popular approach, while the Pew Research Center provides a more comprehensive (“Fact Tank”) view for people who need more information.


4. Basic chart types are often the most effective The more challenging types of chart forms should be used with caution. Make sure that they are the best way to display the information. Often they look exciting, but are not good in terms of clearly visualizing a particular dataset.


5. Transparency Let your readers download the data that you’ve used. They can then see for themselves if the visualization clearly reflects the dataset. Even chart it themselves with their own preferred software.


6. Sketch out ideas Every department used rough visuals, drawn with pencil and paper (or it’s digital equivalent) to initially explore data presentation ideas. Great news for veteran infographic people like me who are always advocating this (to the point of being really annoying).


LINKS TO THE ORGANIZATIONS
(In the order that we visited them). The trends mentioned above are, of course, reflected in these examples.

The Urban Institute https://www.urban.org/data-viz

The New York Times (We visited the Washington Bureau.)
The cost of Hurricane Harvey: goo.gl/ZeJLdR
The UpShot: https://www.nytimes.com/section/upshot
A gallery of last year’s visual stories and graphics: https://www.nytimes.com/interactive/2016/12/28/us/year-in-interactive-graphics.html

5W Infographics (Juan Velasco led a one-day workshop at the National Press Club.) http://www.5wgraphics.com/en/gallery.php

The Washington Post http://postgraphics.tumblr.com

Vox Calories in booze: https://www.vox.com/2016/7/25/12251286/calories-alcoholic-drinks-chart
Map projections: https://www.vox.com/world/2016/12/2/13817712/map-projection-mercator-globe

NPR Gun violence: http://www.npr.org/sections/goatsandsoda/2017/10/06/555861898/gun-violence-how-the-u-s-compares-to-other-countries

The Pew Research Center http://www.pewresearch.org
How voters switched candidates: http://www.people-press.org/interactives/gop-candidate-switching/
http://www.people-press.org/interactives/dem-candidate-switching/

National Geographic http://www.nationalgeographic.com/science/2017/09/cassini-saturn-nasa-3d-grand-tour/

Maze and labyrinth

WAYFINDING PUZZLES.

Classic hedge maze The Longleat Maze in Wiltshire (England) has viewing bridges that give people an overview before they return to the pathways between tall hedges. Photograph by Niki Odolphie.

Definitions A maze has multiple entrances and exits, choices of direction, and dead-ends. A labyrinth has only one way in and one way out.

Garden labyrinth Below, the Edinburgh Labyrinth (Scotland) in George Square Gardens. Photograph by Di Williams.

World’s largest The Guinness Book of Records lists The Maze of Butterfly Lovers in Ningbo, China, as the largest permanent hedge maze, with a total path length of 8.38 km (5.2 miles). It opened in April this year. Designed by Adrian Fisher, it contains the shapes of two butterflies. Adrian has designed hundreds of mazes and puzzles (in various formats) all over the world. Image from Google Maps.


Labyrinth project
As a celebration of the 150th anniversary of the London Underground in 2013, Mark Wallinger created a unique enamel labyrinth for every one of the 270 stations. They’re a connection to the system’s history of classic graphic design, and reflect the idea of entering the labyrinth of walkways and tunnels that make up a journey.


Photograph by Jack Gordon.

All of them are photographed here: http://labyrinthtubephoto.tumblr.com