Bayer’s masterpiece

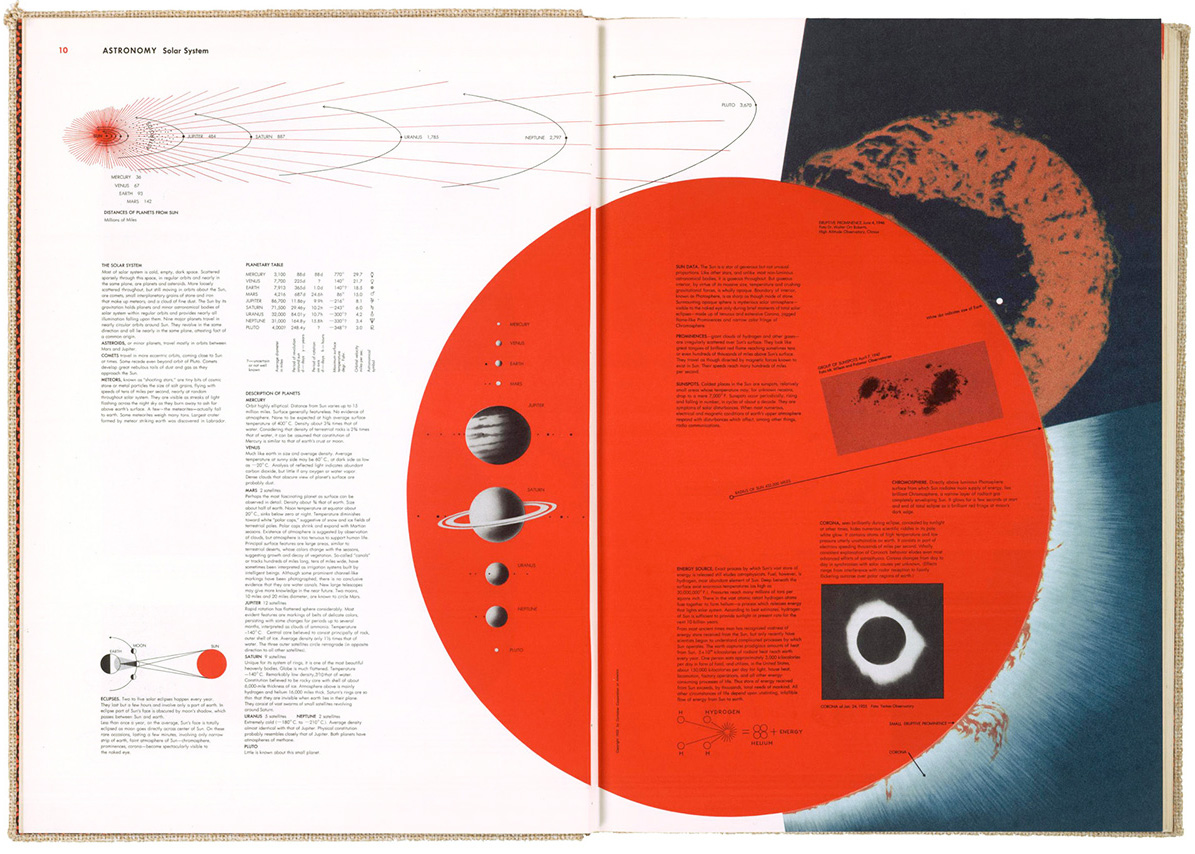
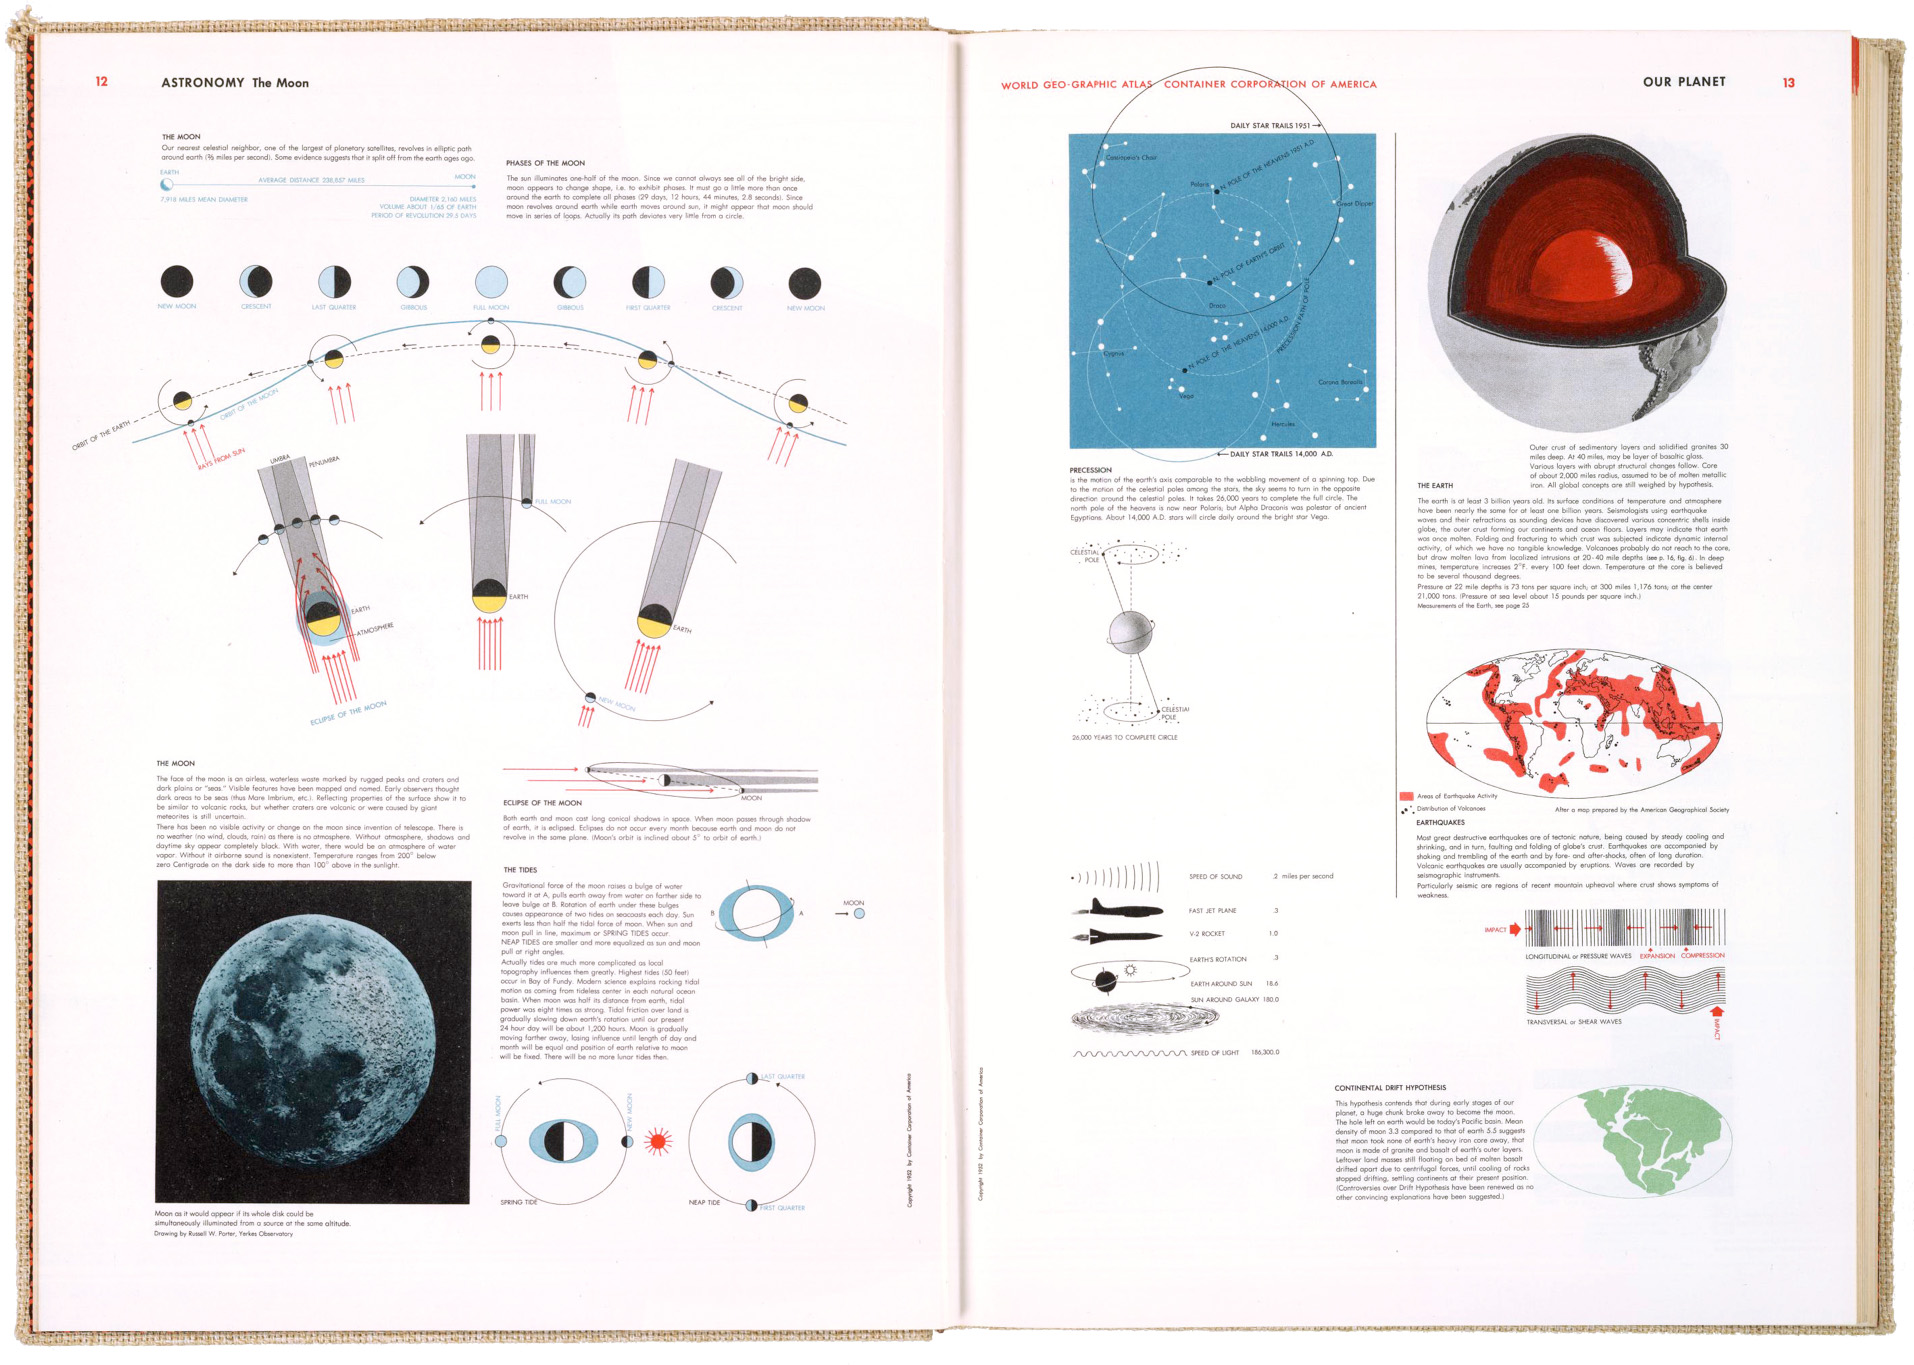
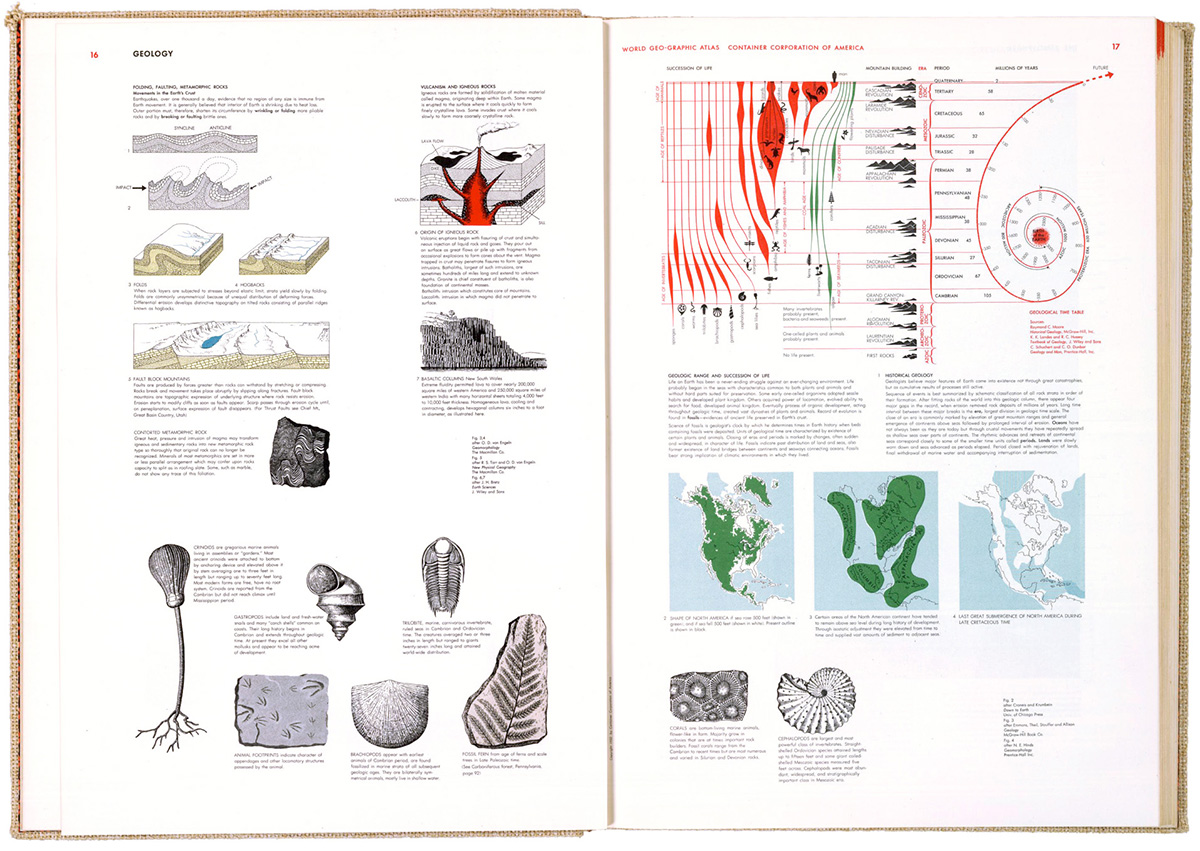
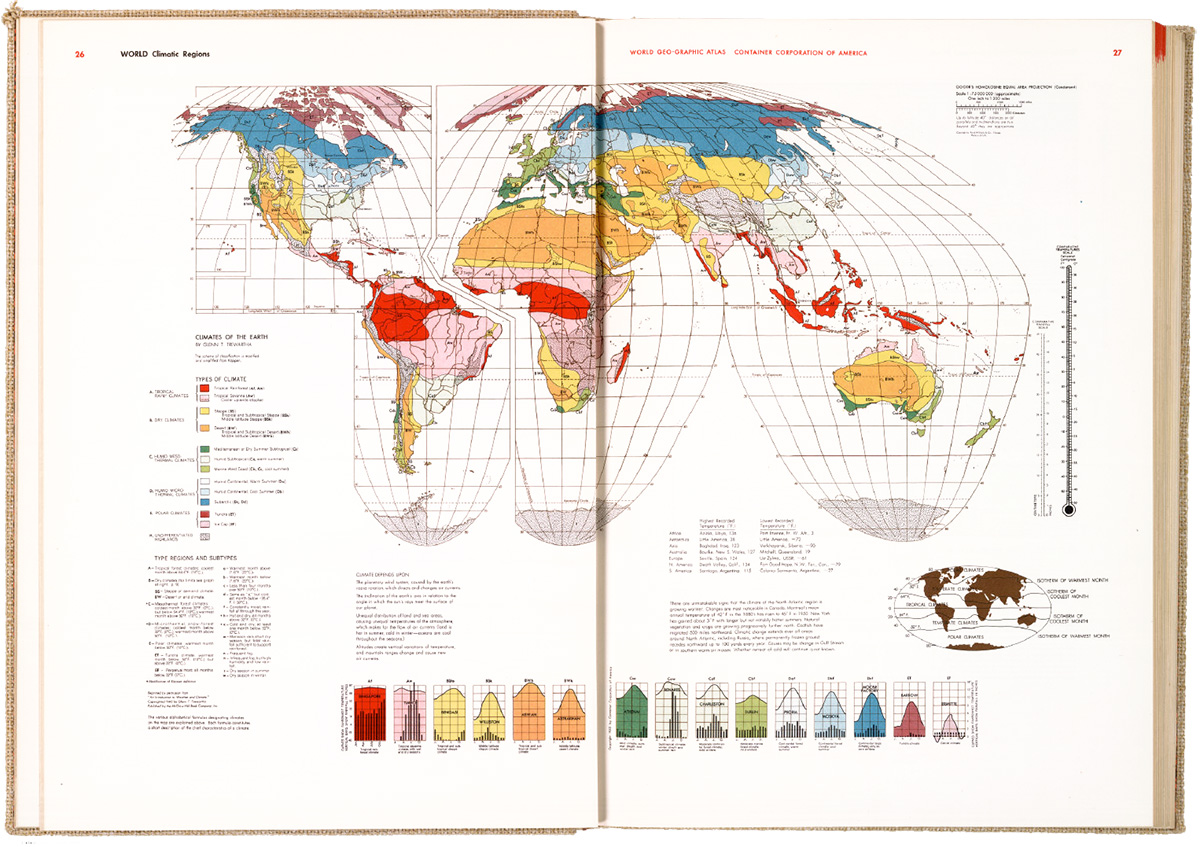
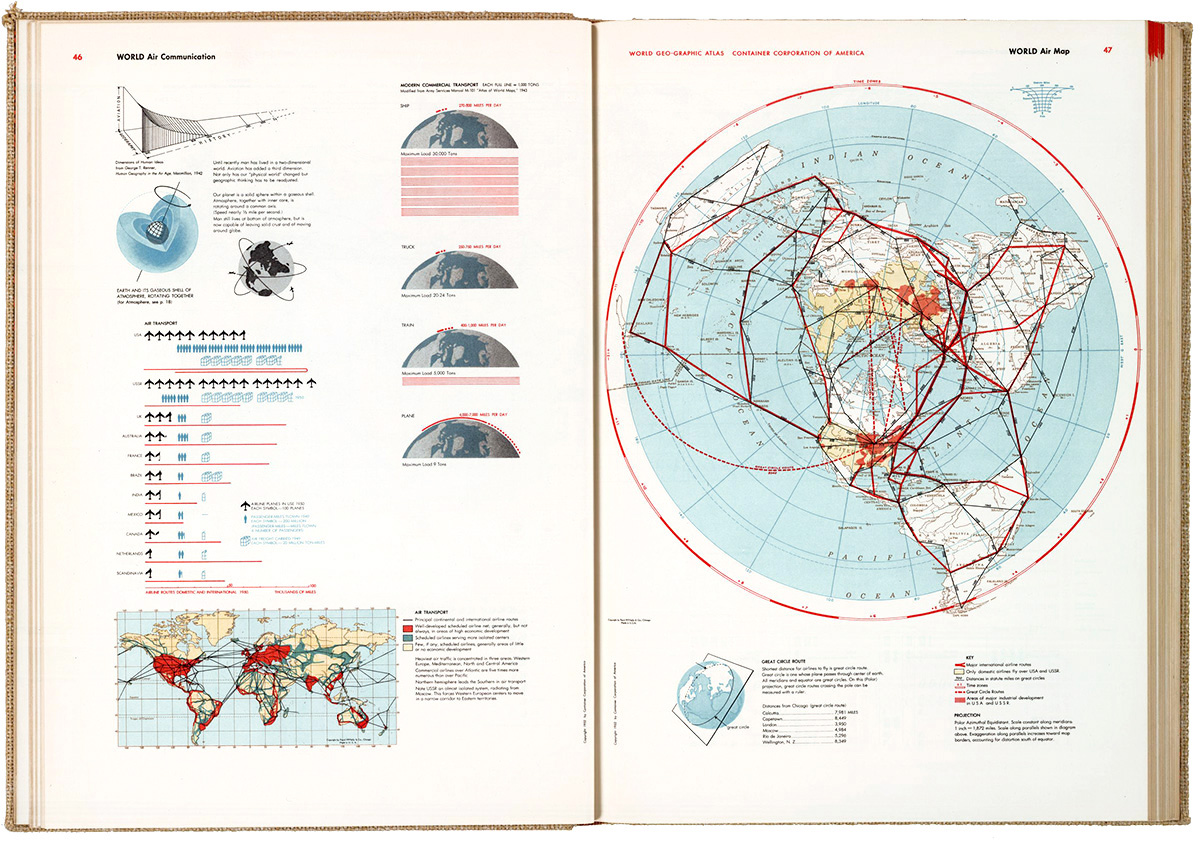
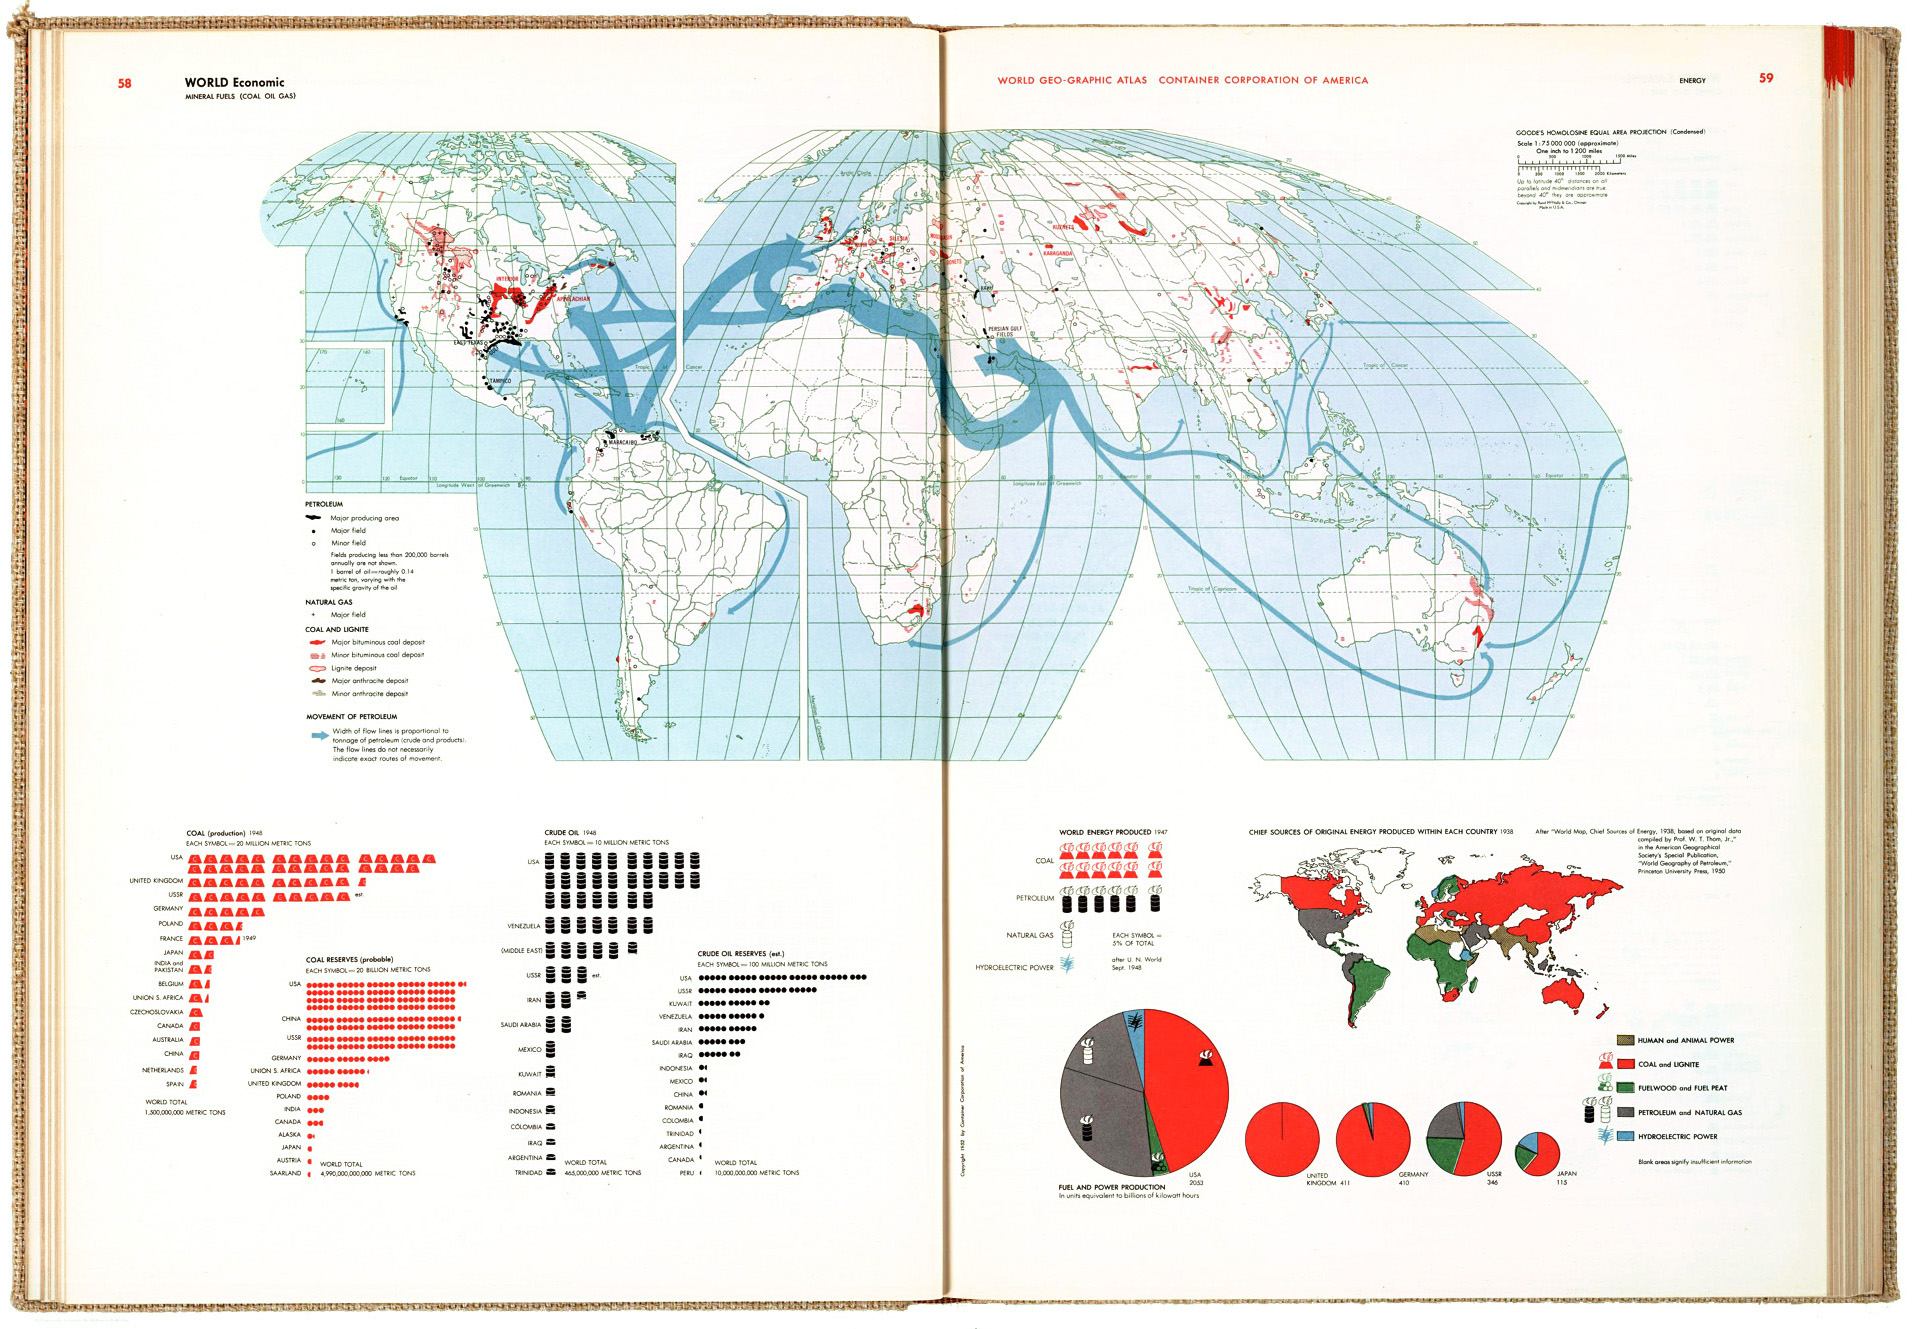
THE 1953 WORLD GEO-GRAPHIC ATLAS.

astronomy_hb1

This informational gem took five years to produce and contains a few thousand infographic items. I don’t own a copy, but Michael Stoll, who I mentioned in an earlier post (https://www.johngrimwade.com/blog/2016/10/06/atlas-heaven/ ), has one (naturally) in his superb collection of historical information design. I was in Augsburg two weeks ago, and was able to examine the real thing, instead of looking at digital images. Seeing design in it’s original format, as opposed to looking at different sizes and variable image quality online (or in this blog, for that matter) is a vastly different experience. Often difficult to achieve, but worth the effort.

themoon_hb

The atlas was produced for the Container Corporation of America to commemorate their twenty-fifth anniversary. 30,000 copies were printed. They were distributed to customers as a gift, and given to numerous colleges and universities. It was never produced commercially, or reprinted, so original atlases in good condition are quite rare, and thus expensive to acquire.

A team of three designers worked under Bayer to develop a graphic language for the book, using the color system that had been developed for CCA by Egbert Jacobsen. Bayer did his own research, traveling widely to assemble the information. There are many design influences to be seen in the pages, like the Isotype system of pictograms. I’m struck by how it looks so modern, sixty-three years after publication. It shows the staying power of precise, clear information design.

geology_hb

Herbert Bayer was a Renaissance Man. A graphic designer, typographer, photographer, artist, interior designer and architect who studied and taught at the legendary Bauhaus school. He emigrated to the U.S. before the Second World War, and produced all kinds of impressive design across many fields.

climate_hb

airconnections_hb4

economic_hb3

These images are from the David Rumsey Map Collection. See the full atlas in high-res there: goo.gl/gpd8nV

Actually…

CLASSROOM DATA REVEALS GRIMWADE’S TEACHING PROBLEMS.

actually_palomino1

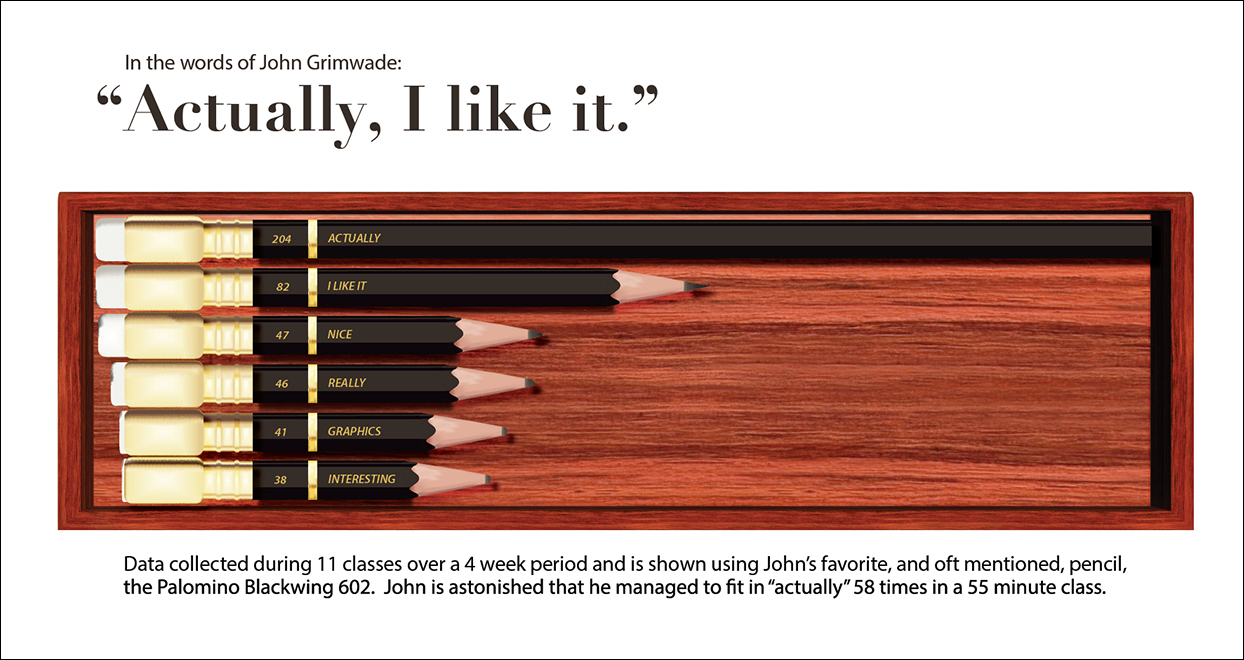
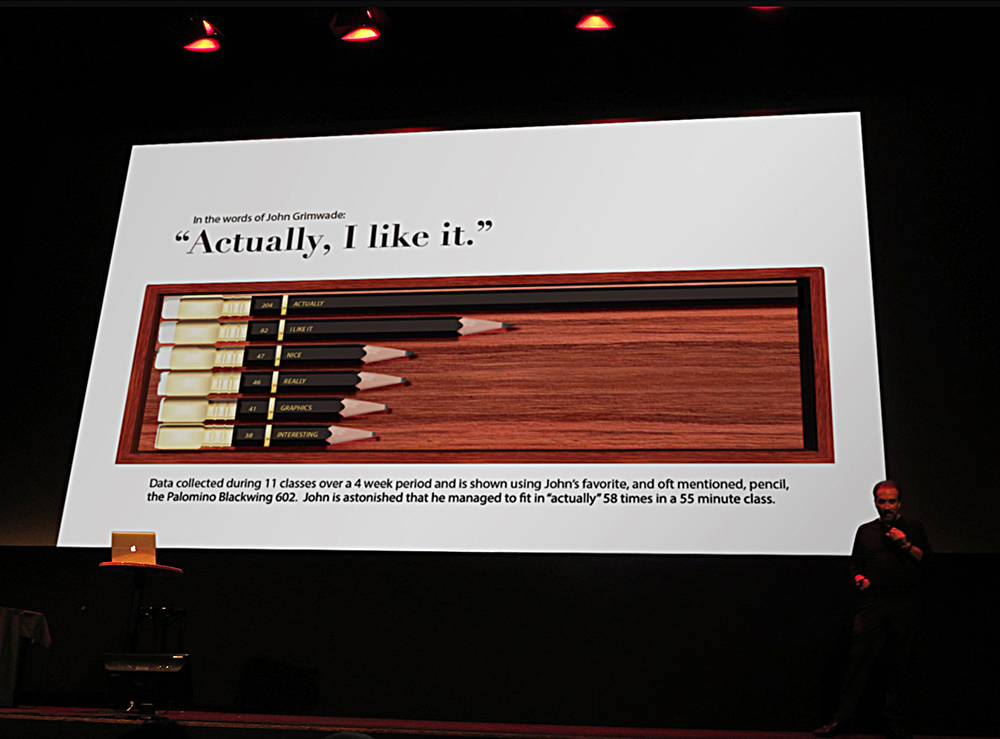
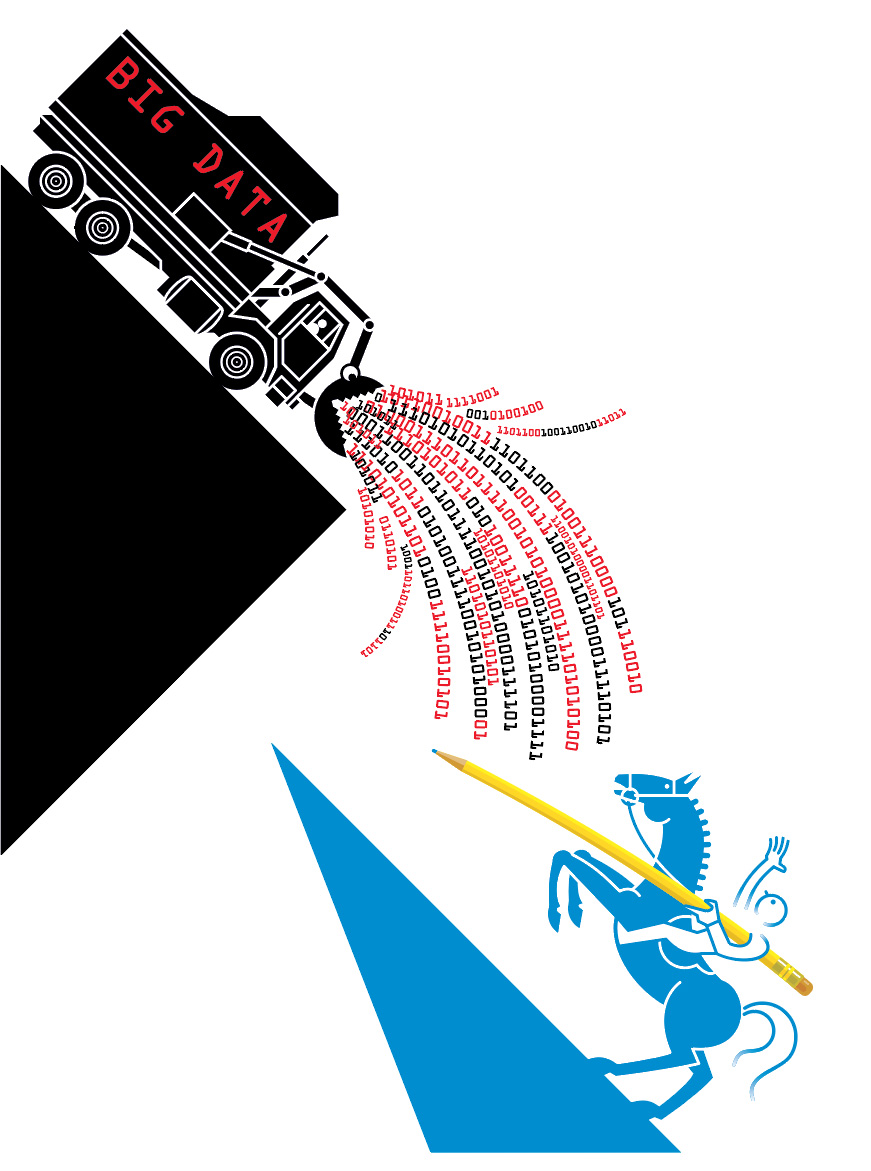
I’d been talking about data visualization off and on for weeks in my infographics class, so perhaps I should not have been surprised when this infographic surfaced. A student, Shanna MacRostie, decided to track my vocabulary. Yes, I had told the students to collect data, but I did not intend it to be about me. The clever use of my favorite pencil, the Palomino Blackwing 602, is a reference to that frequently mentioned item. (https://www.johngrimwade.com/blog/2016/09/05/the-ultimate-pencil/)

Shanna’s comments: “It was a bit of a running joke in class that you often repeated certain words. You even commented on it yourself several times. I thought it would make a fun infographic project, so I decided to keep track of how often you used certain words/phrases over a four-week period. I simply marked down every time you said something that was on the list, and I ended up with two very full pages of data”.

Anyway, in terms of teaching, perhaps the worst terms to be using are: actually, I like it, nice, really interesting graphics. That is not useful feedback for students. Clearly, I will not be winning “Professor of the Year” anytime soon.

Please note: I said “actually” 58 times in a 55-minute class, and I have now developed a complex about it. But therapy can probably fix that.

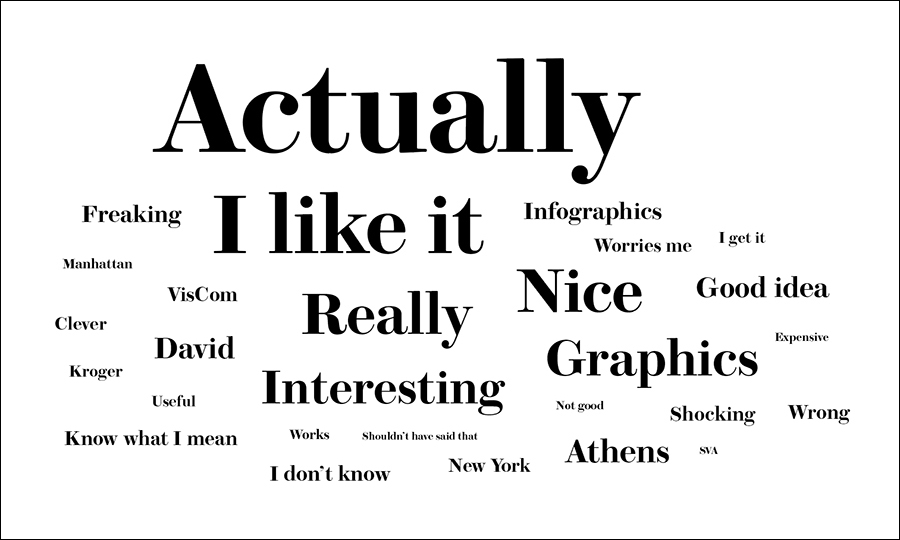
This is my word cloud version from the full dataset.

actually_wordcloud_a

actually_ic16

I presented Shanna’s graphic at the IC16 conference in the Netherlands last March.

Now which room is that “How to teach” seminar in?


Pictographic

DESIGNING A SET OF SYMBOLS.
business_card

The pictograms on the back of my business card are part of a set that was designed for Managing Automation magazine. More about them later in this post.

ICONIC DEVELOPMENT

I’ve always appreciated the graphic simplicity of pictograms (or icons, or symbols, or whatever else we may call them). They can convey an effective visual signal, and if necessary, do it in a very small space. But, as all information designers know, symbols are not as easy to create as they look. An elegant, unified set, particularly when it contains some fairly abstract subjects, probably gives no hint of the many hours of work involved. The same thing could be said about a lot of good design. 

I usually go through the rough sketch process that I’ve mentioned in earlier posts. It’s a good way to try out the options. Email it to the client, get some feedback, and move on from there. Incidentally, there’s often one symbol in a set that is difficult to solve. Either because no one understands it, or because it doesn’t look like it is from the same family as the others. That one can end up taking as long as all the rest.

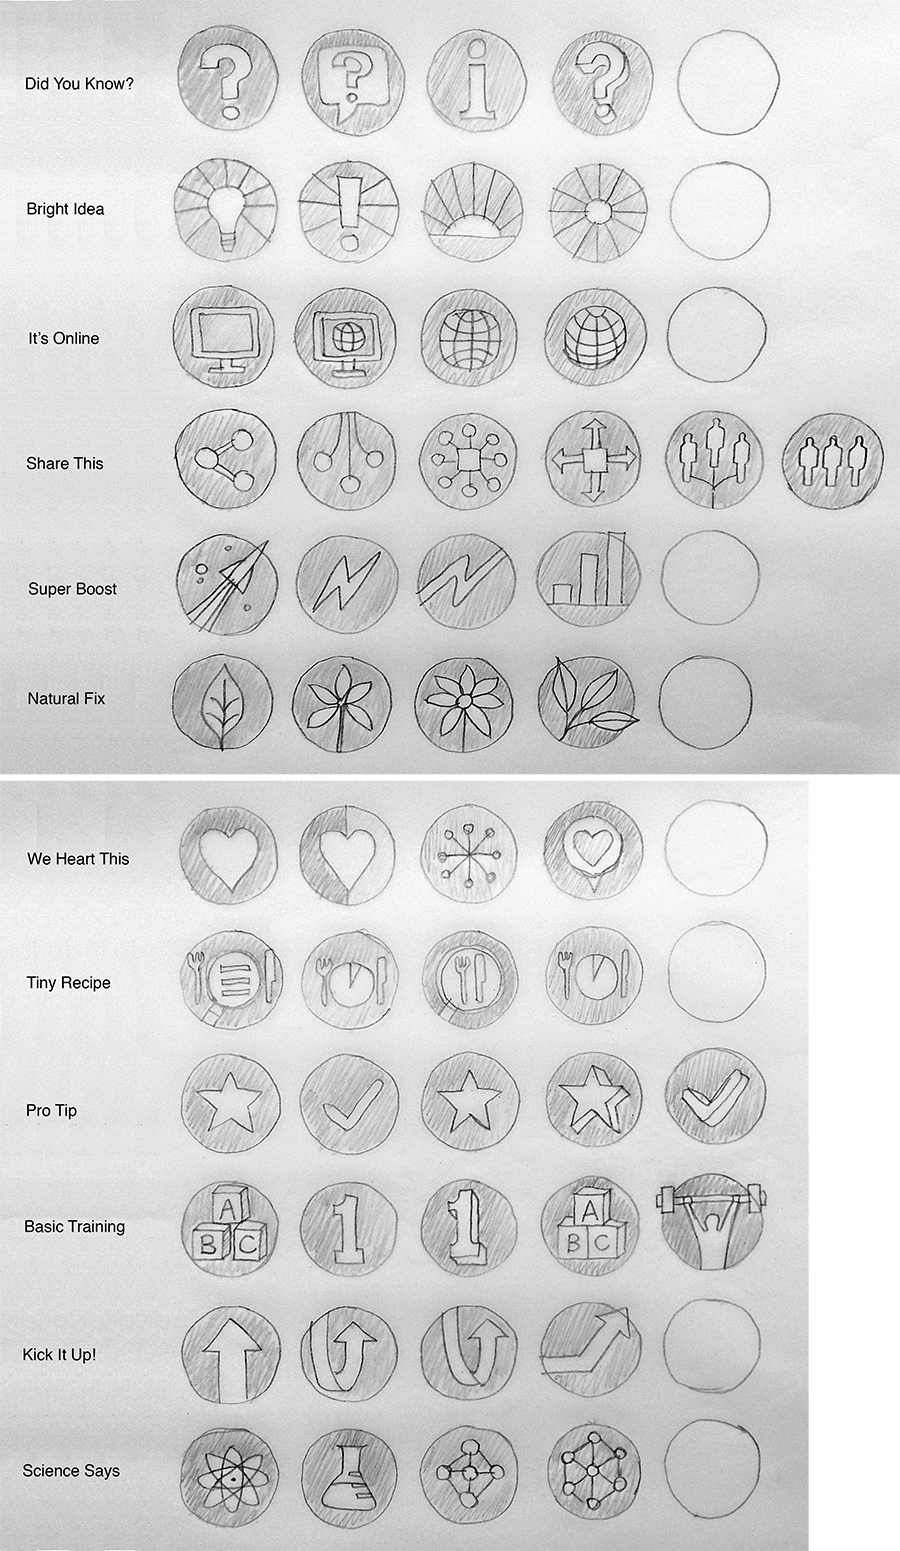
Below is the complete development of a set of icons that I designed last year for The Good Life magazine. First came the rough ideas. This image is the second stage of the pencil sketches.
goodlife_rough

Next came the refinement of the style. These symbols needed to work at a small size. I started with circles holding the icons, and tried some bold color in the test below, but the project gradually headed towards a line style with free shapes on white. Note: In any set of pictograms, it’s important to keep both a consistent line weight and even spacing.
goodlife_style

goodlife_color

Possible line styles without the circles.
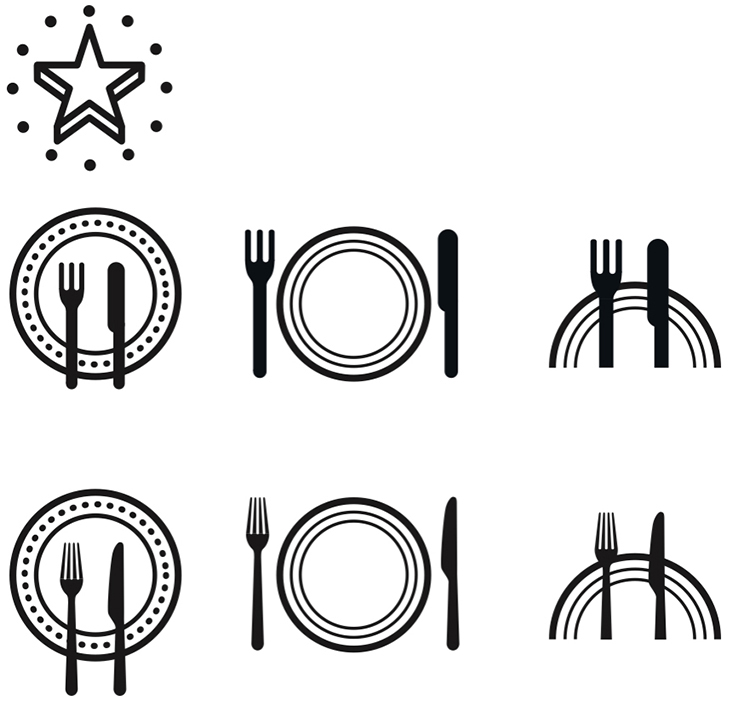
goodlife_styledetail2

Getting closer in the version below. “Share This” and “Super Boost” were giving me trouble. Especially the latter. Clearly!
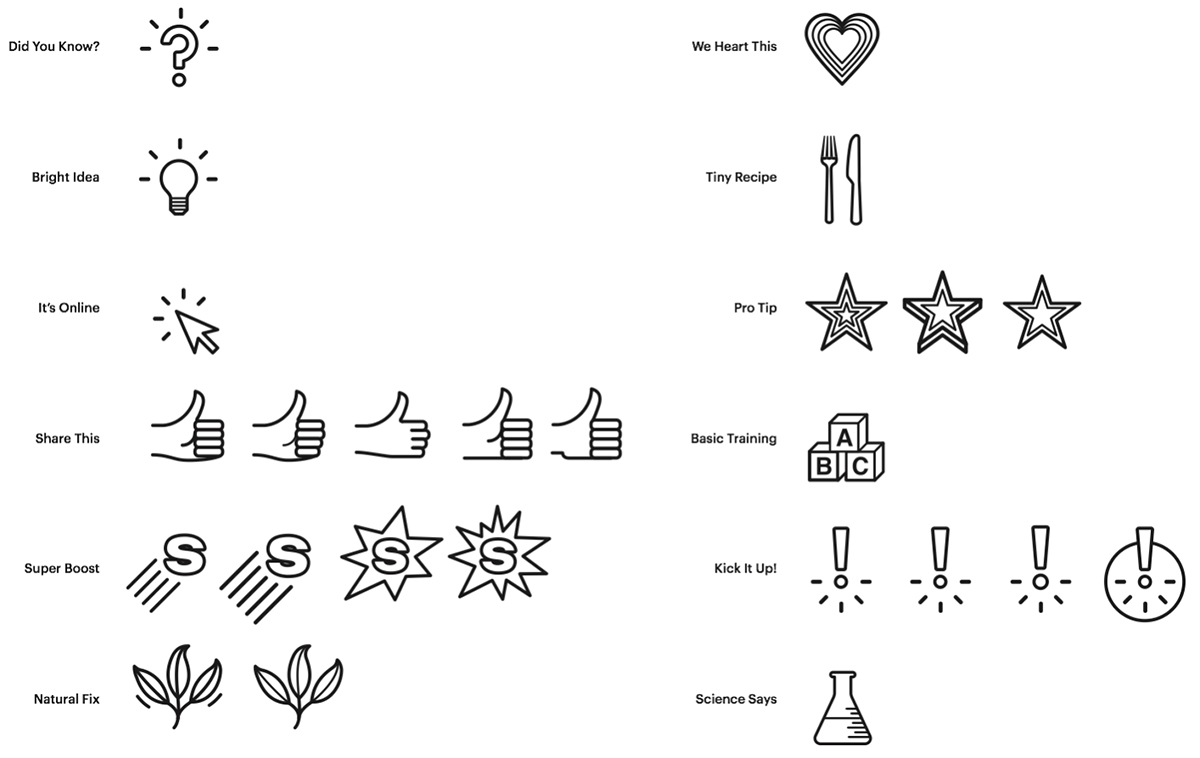
goodlife_prefinal

This is a nearly-final stage. I was refining the symbols with the magazine’s editorial and designer input (which had accompanied each step). As with all infographic elements, pictograms have to work well at the final size and in the intended format. By the way, collaboration is always good, and many of my projects owe a great deal to the smart thinking of design departments.
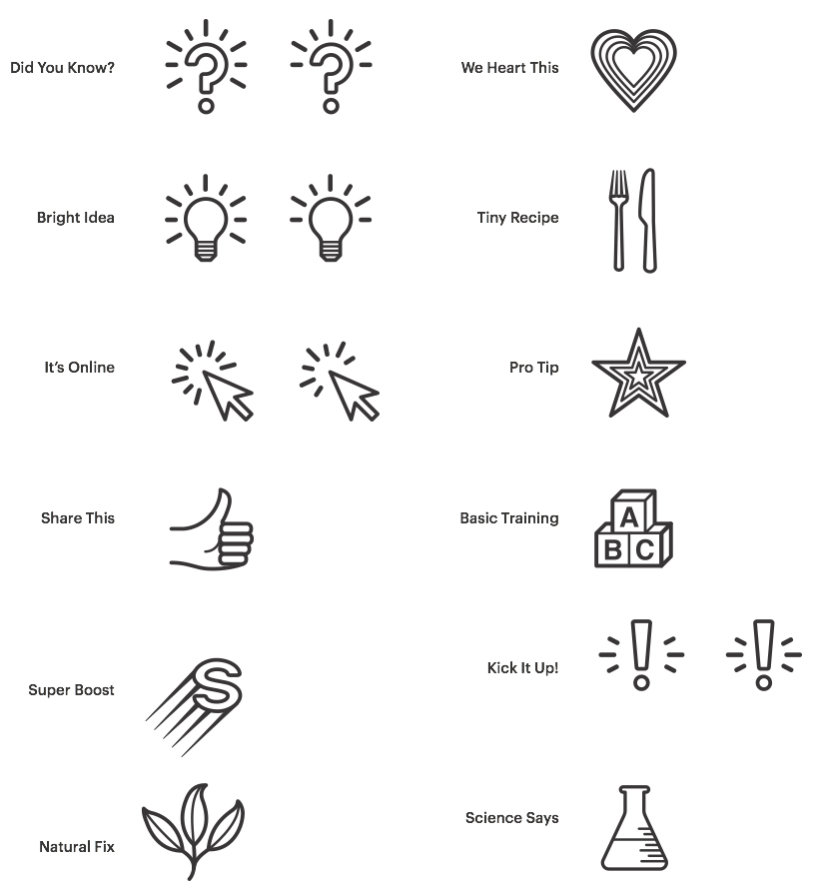
goodlife_almostfinal

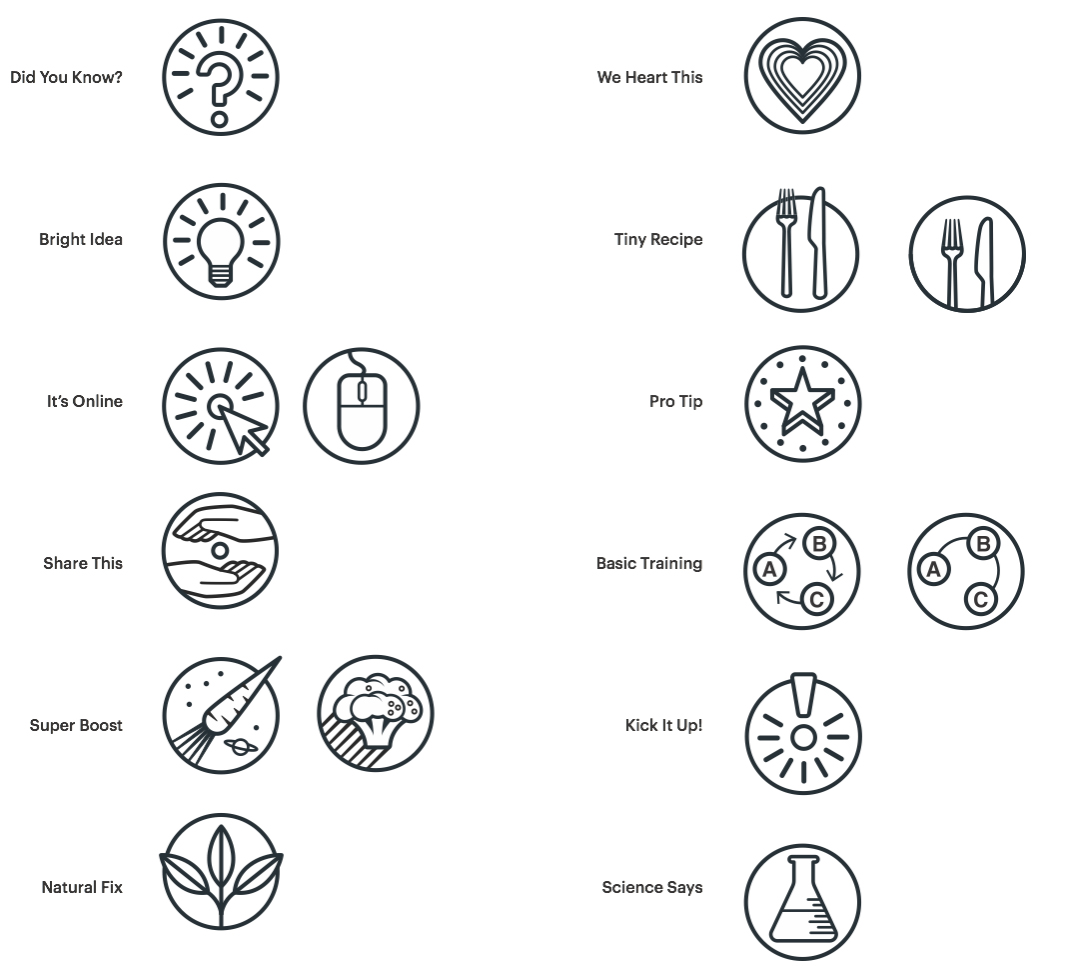
Examples from the final set (below). This is just one possible color that would be used depending on the issue.

goodlife_final1

Below is the second stage of development for the Managing Automation pictograms shown at the beginning of this post. There was (of course) once a pencil rough on paper, but long ago it was probably recycled into a lampshade.
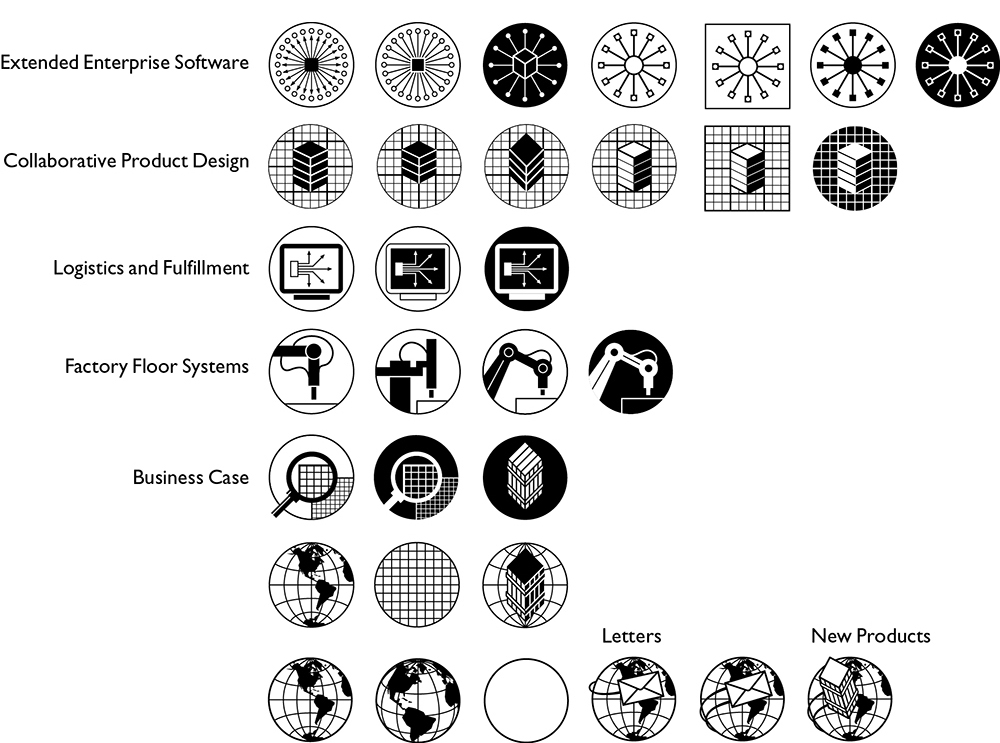
ma_all1

Final version.

ma_icons1

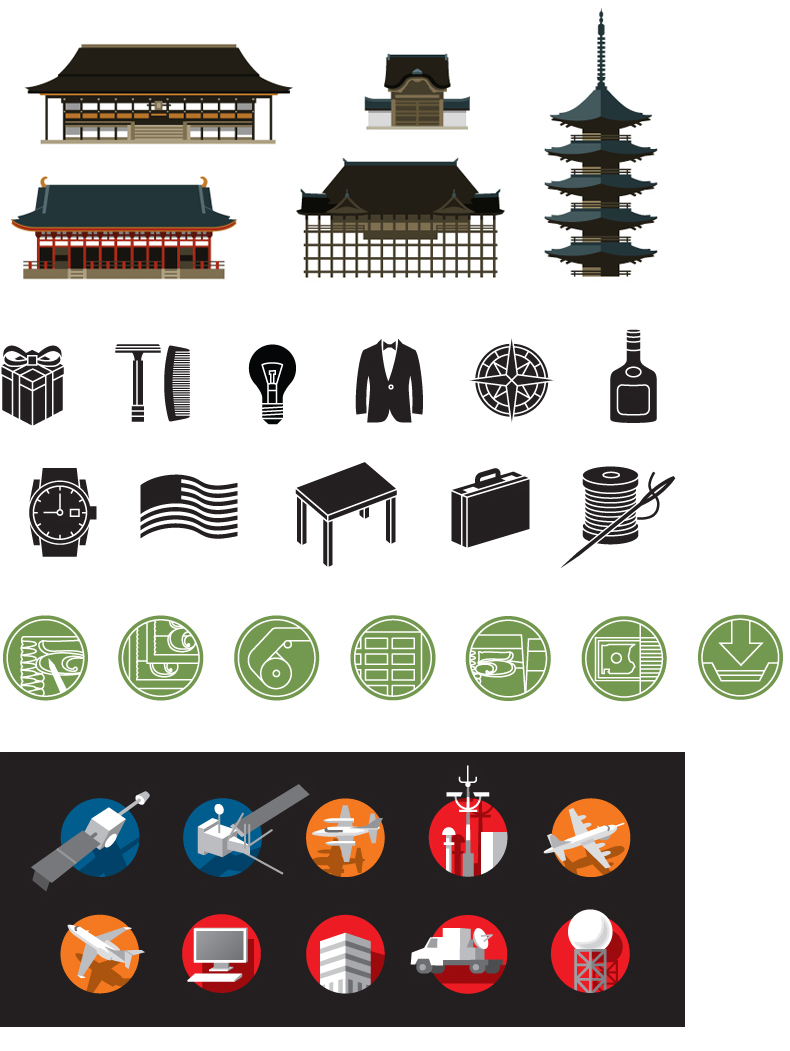
Some other sets for various clients. Flat color, line art, dimension, drop shadows, I’ve tried it all.
icons

See a lot more here: http://johngrimwade.com/ICindex.html
Grimwadia

THE WORLD OF TRAVEL INFOGRAPHICS.

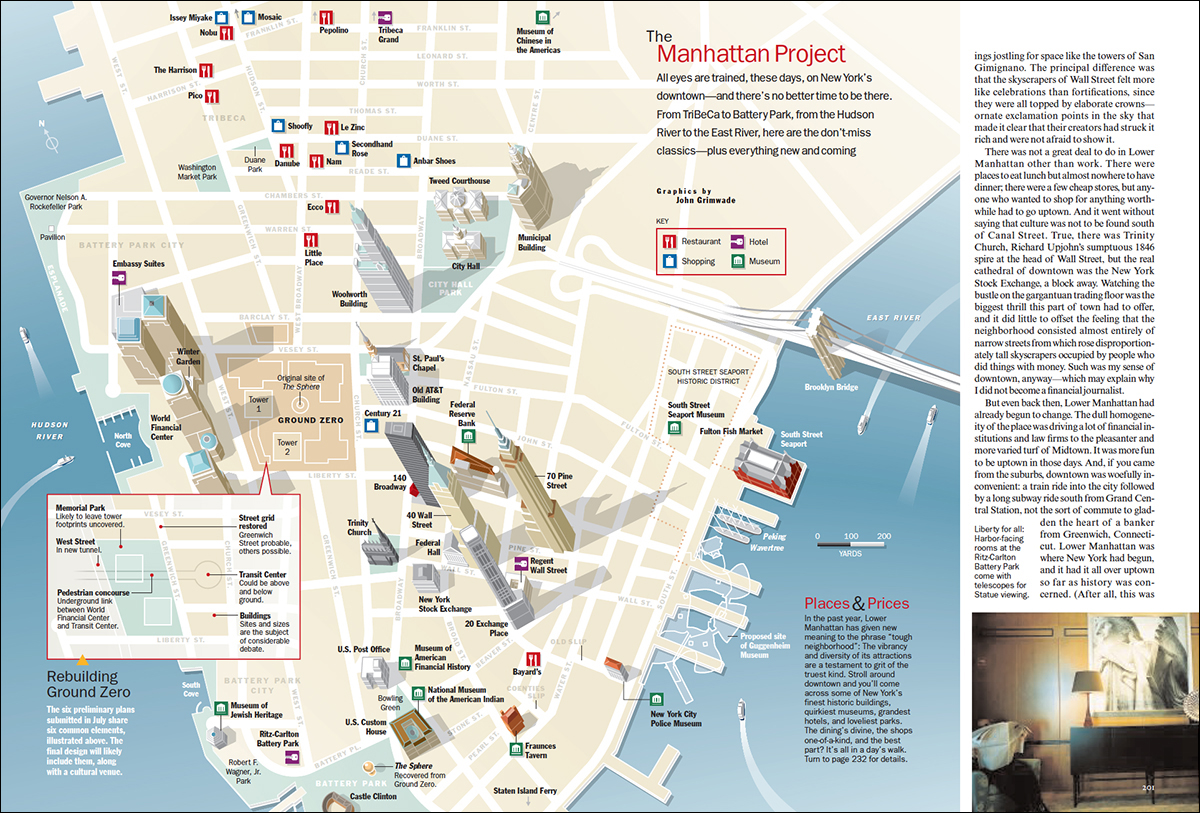
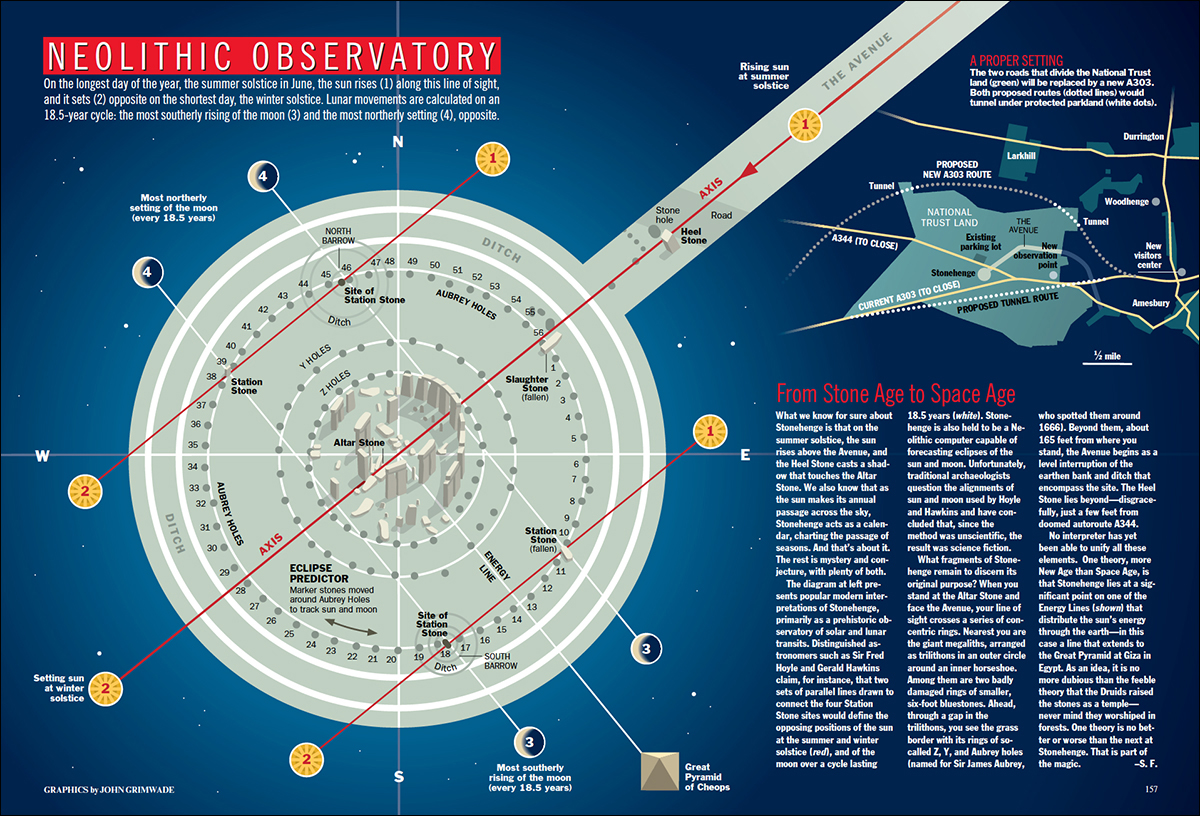
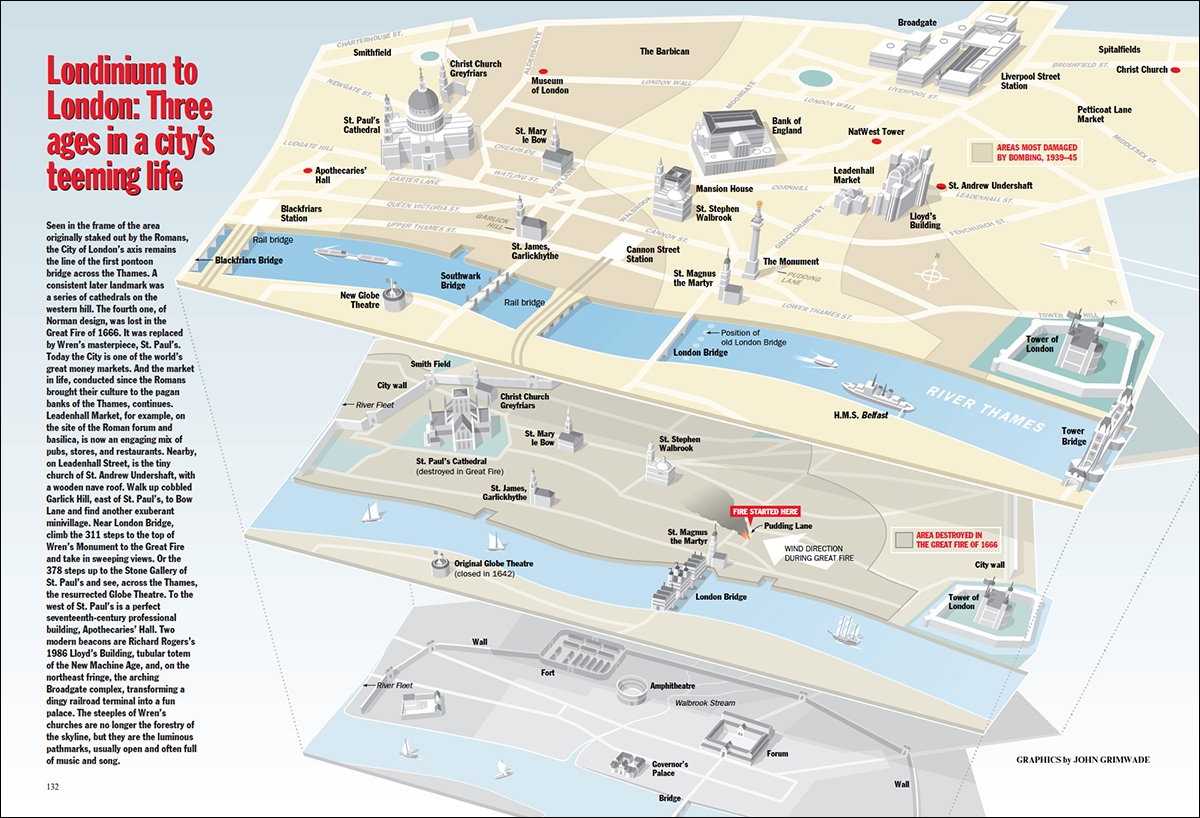
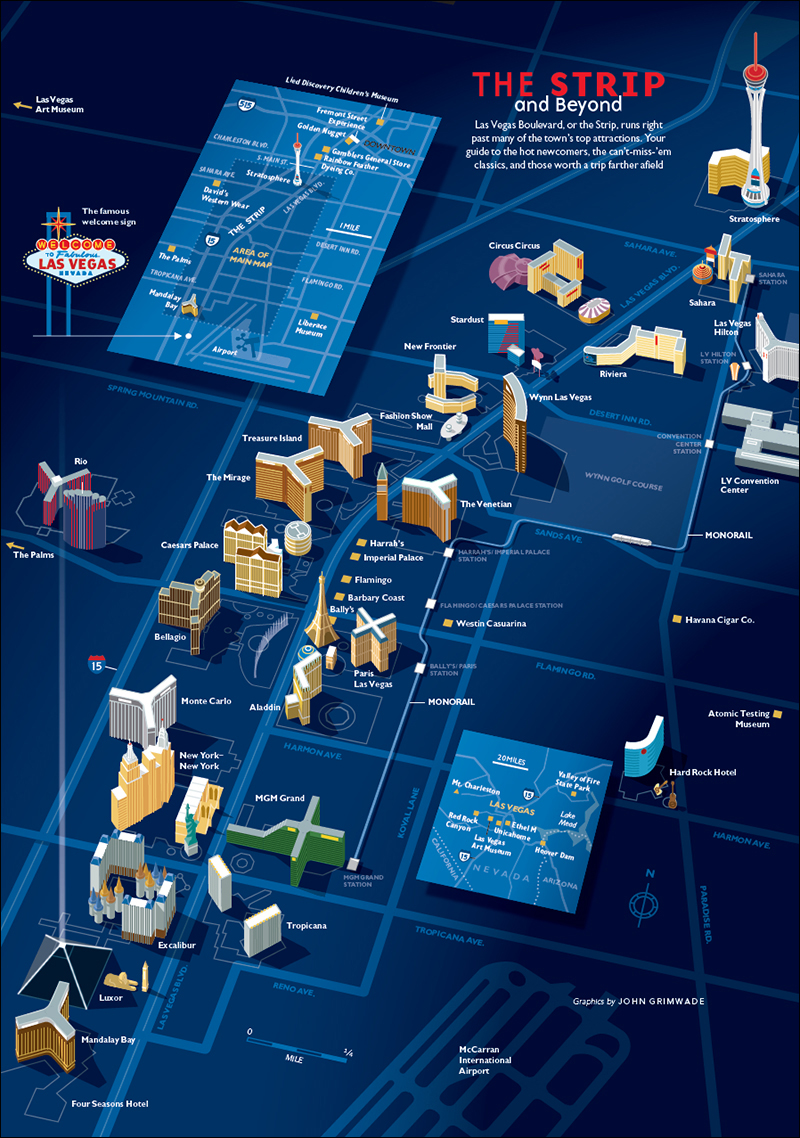
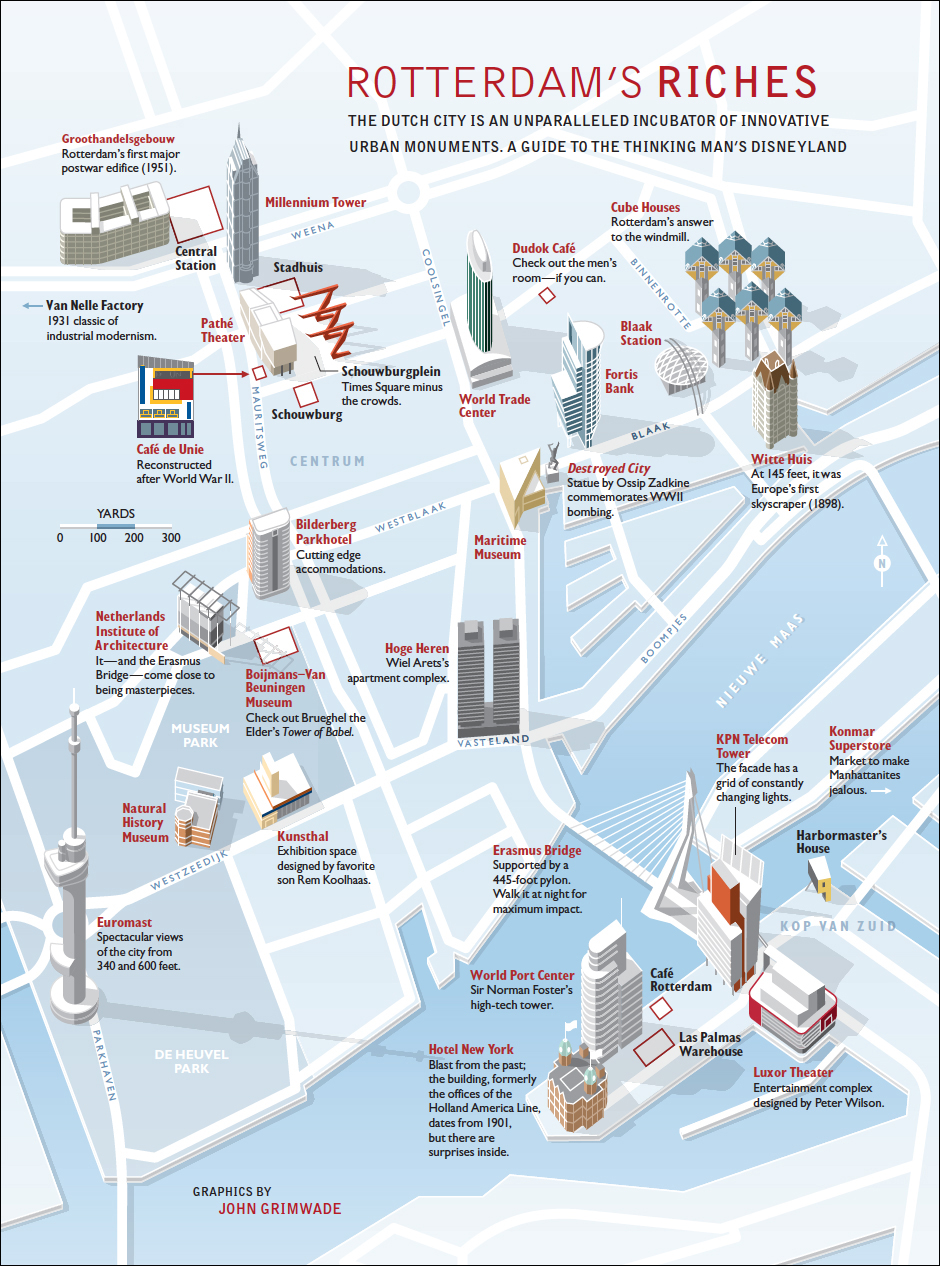
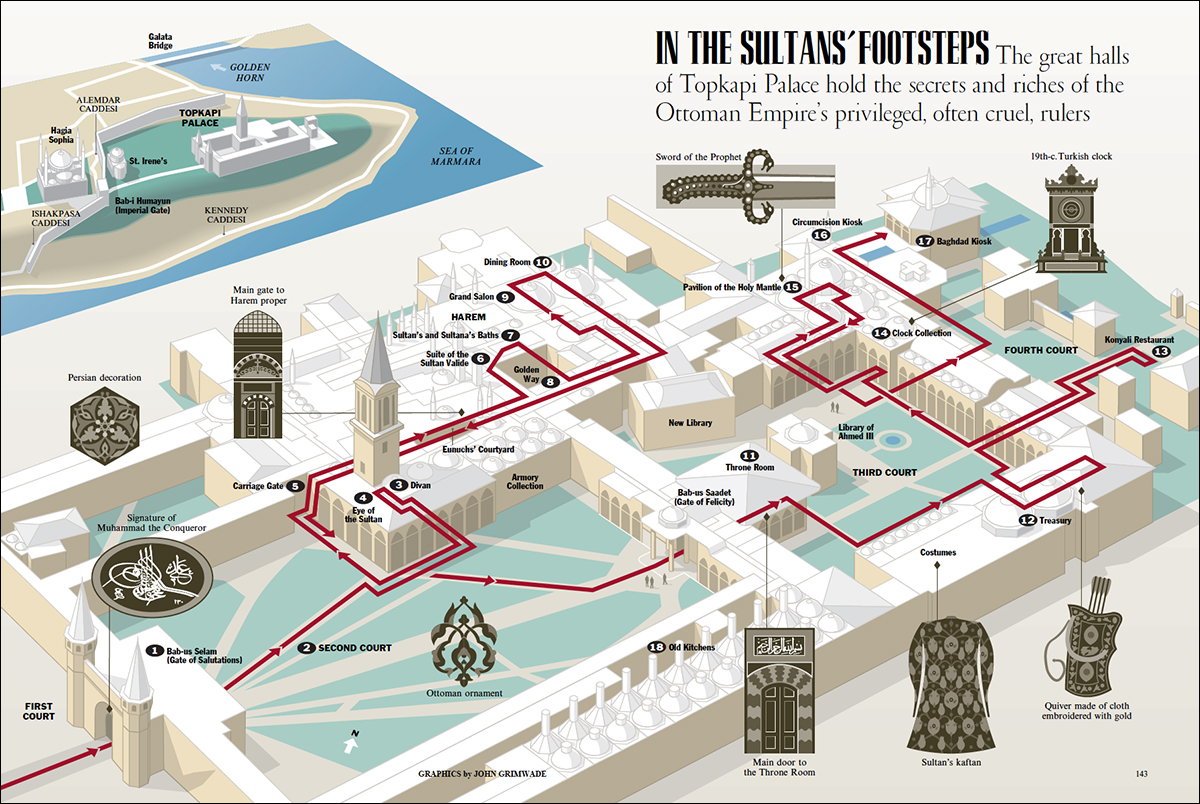
Clive Irving (who is the most infographic-minded editor I have ever worked with) coined the term Grimwadia (pronounced grim-way-dia) to describe the kind of infographics we were running in Condé Nast Traveler magazine. Soon editors there were announcing, “We need some Grimwadia in this feature,” as if that was a normal thing to be saying. I found it slightly odd, to be honest, but loved the implication that infographics had become part of the brand.
icecrown

I tried very hard to compliment the features that contained these graphics. A huge amount of work in the research and copy-editing departments, and super-smart editorial support, went into these pieces. Then there was the vital input of the design department. The people who worked with me are very much a part of this, especially Clive, whose infographic intelligence, superb crafting of headlines and text, and unfailing enthusiasm for the projects made them happen.

I think all people making infographics hope to find like-minded individuals on the editorial side who realize the value of visual explanation. When you have that support, everything works. When you don’t, infographics can be a big struggle.

So here are some examples from that period, mostly from the 1990s and early 2000s.  Although these graphics are the rear-view mirror now, I have a soft spot for them.

manhattan

stonehenge1

london

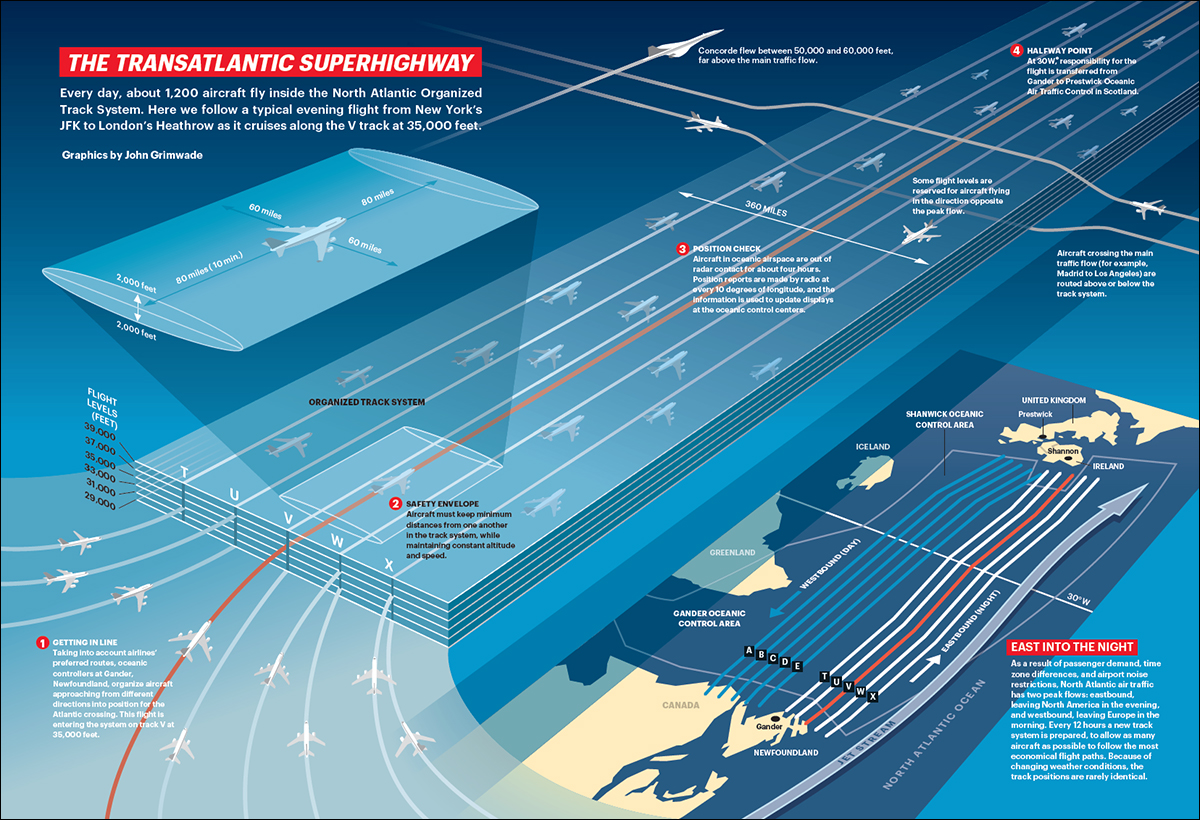
transatlantic

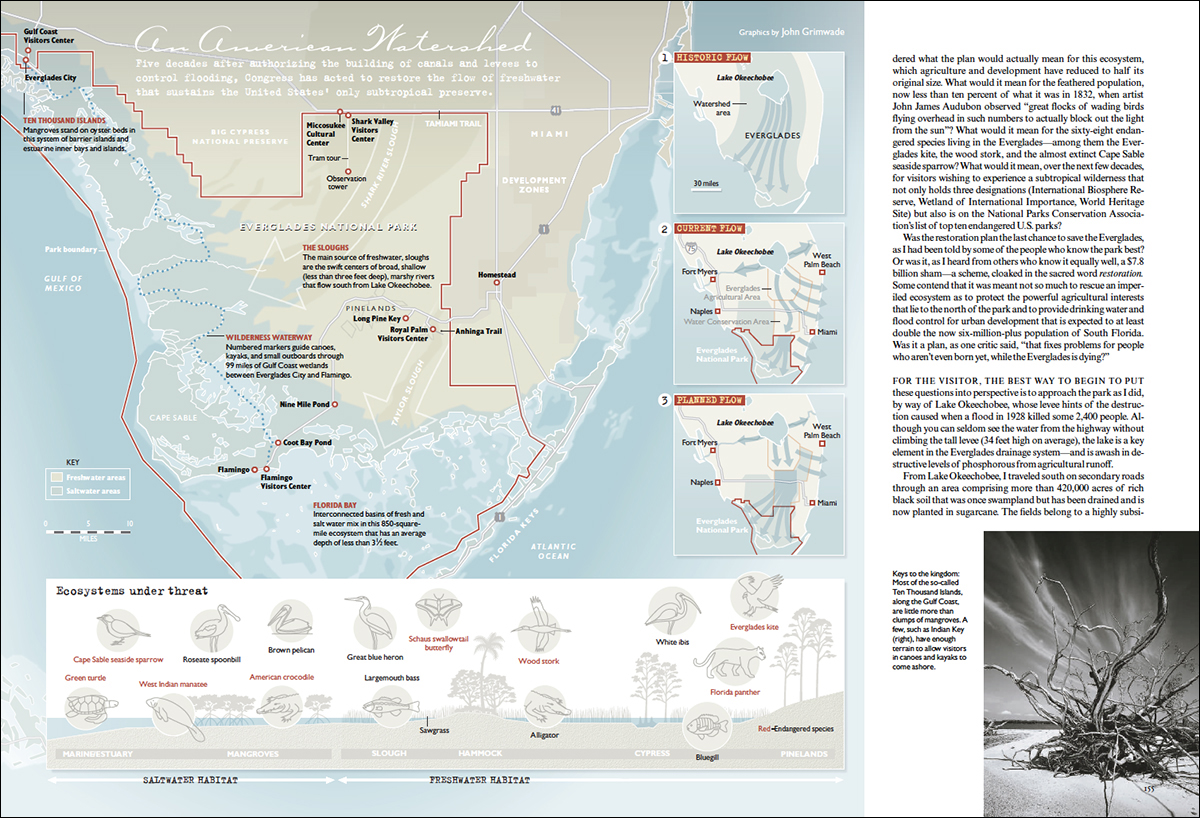
everglades

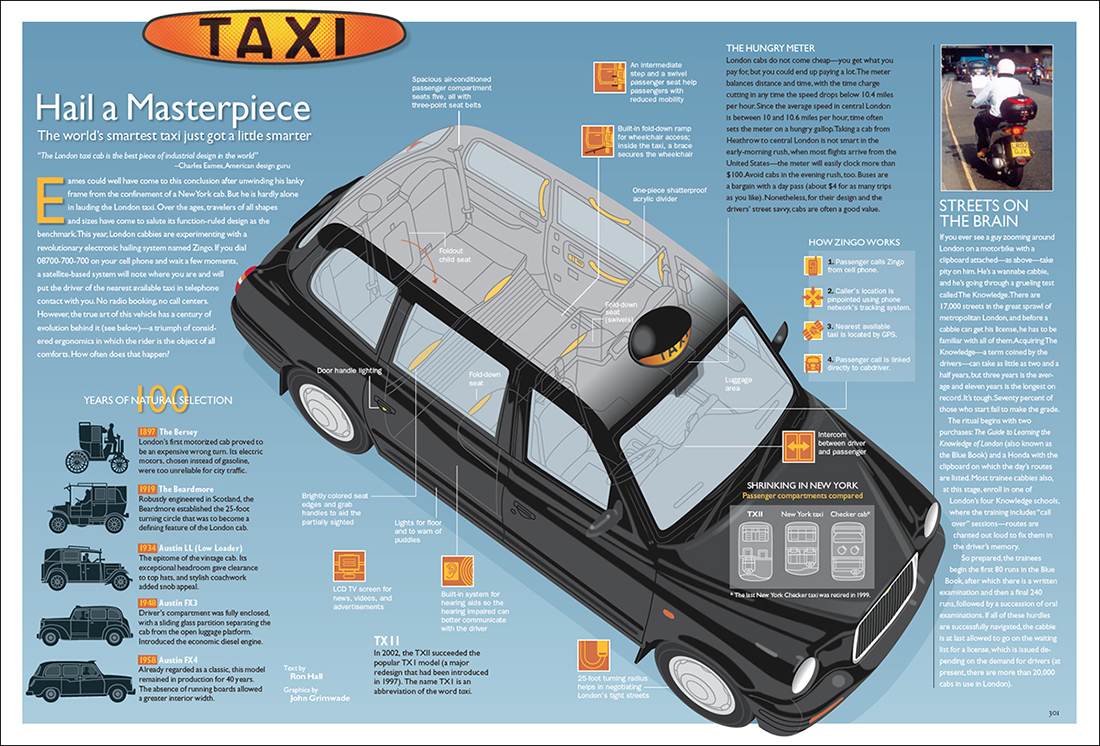
taxi1

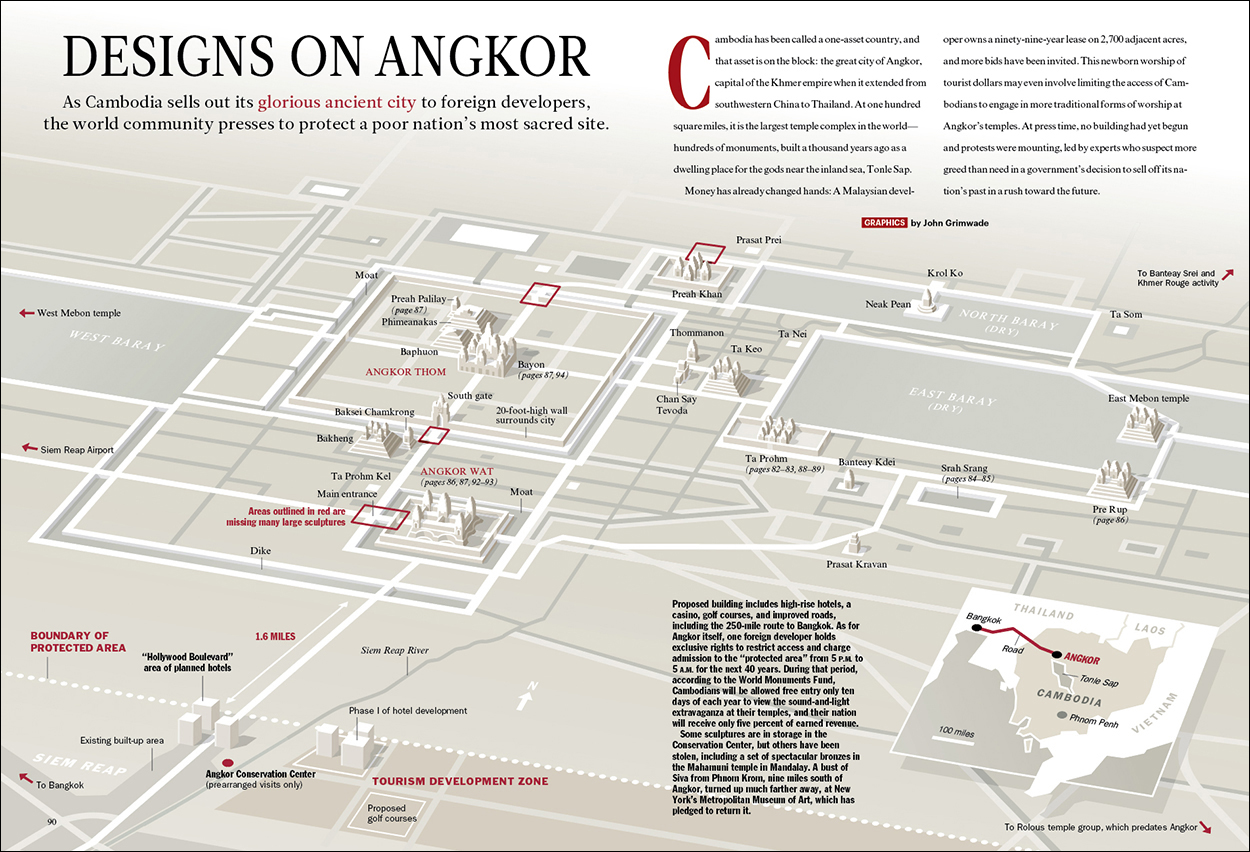
angkorwat

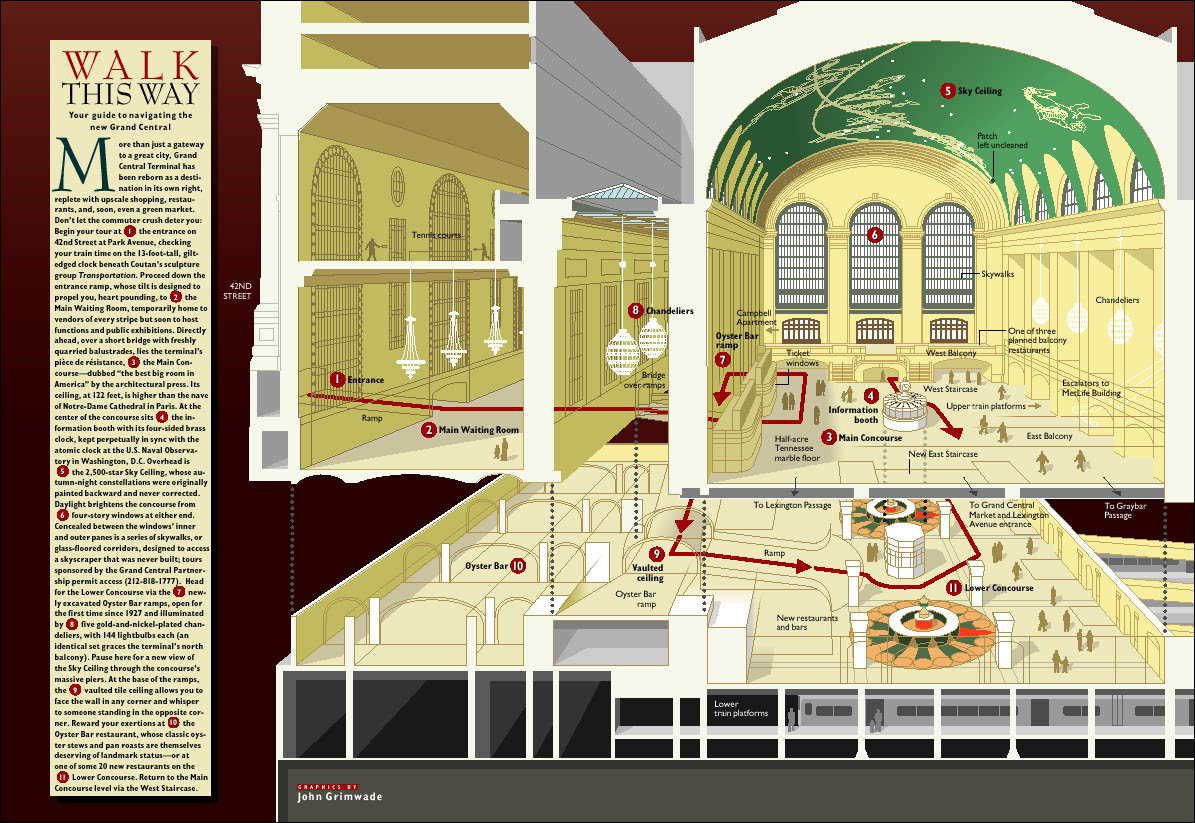
grandcentral

topkapi

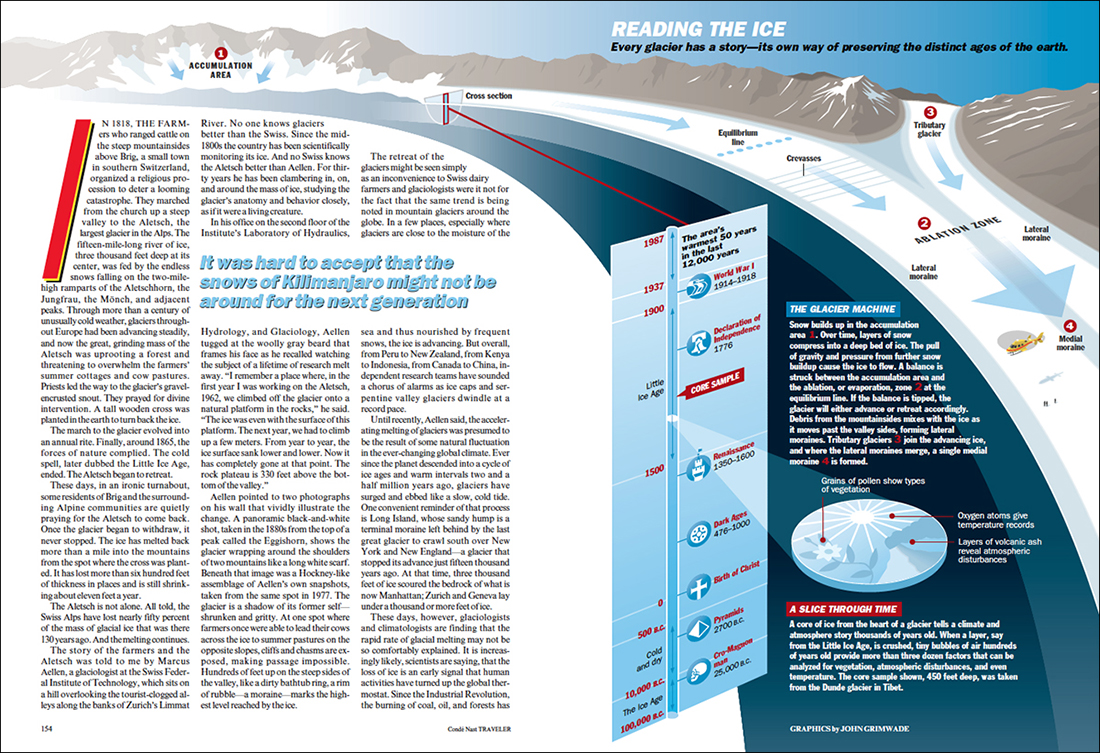
glaciers1

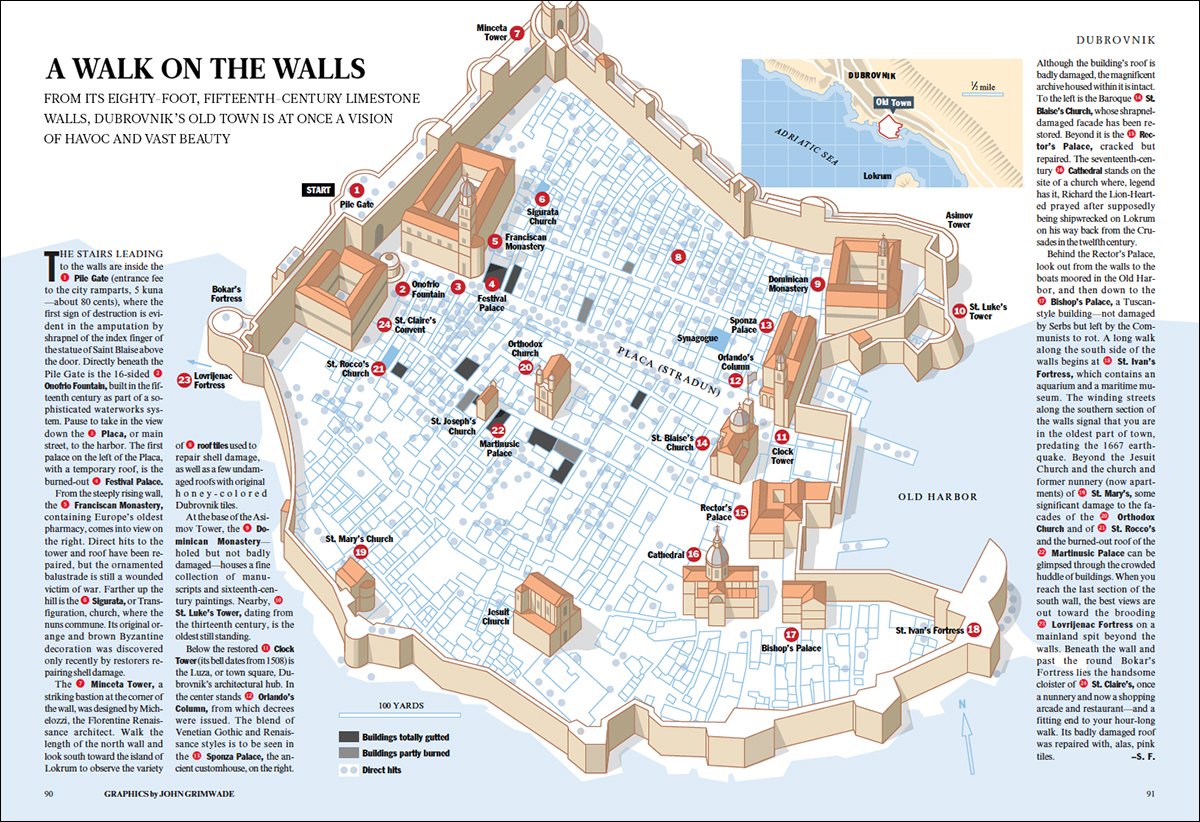
dubrovnik1

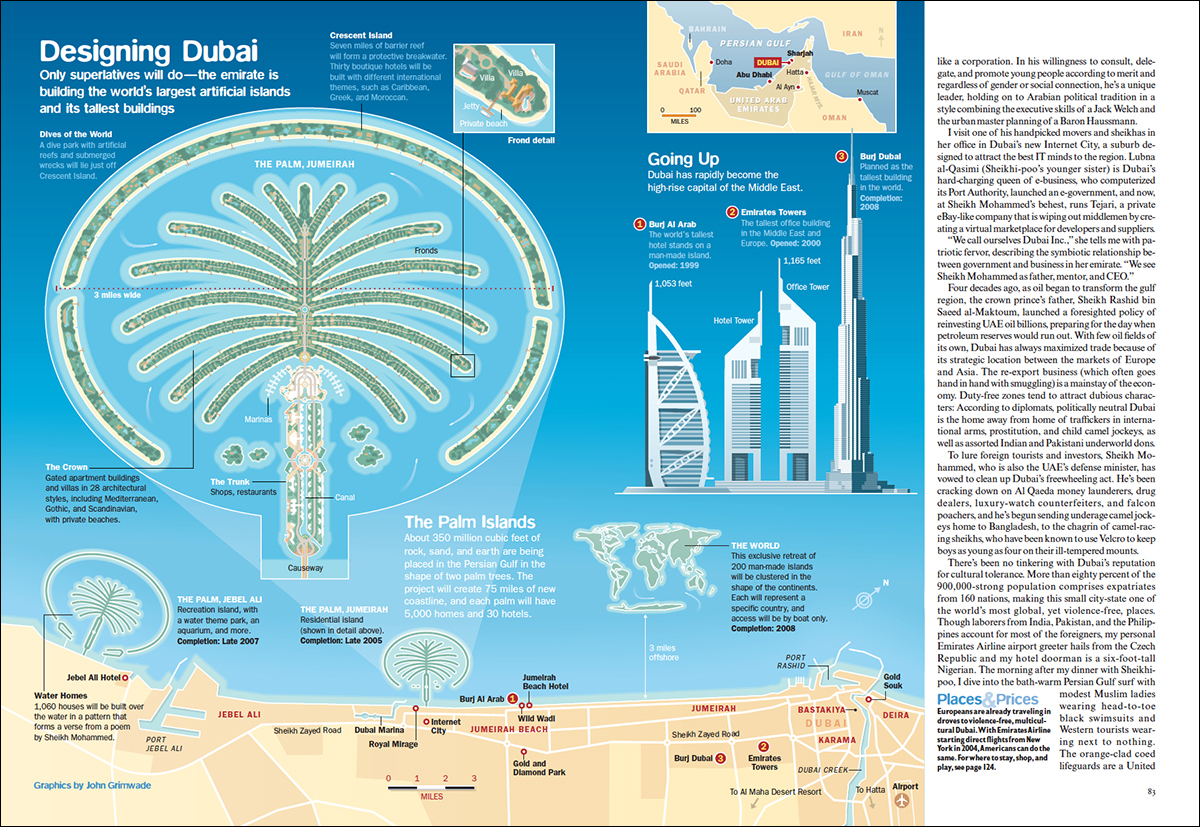
dubai

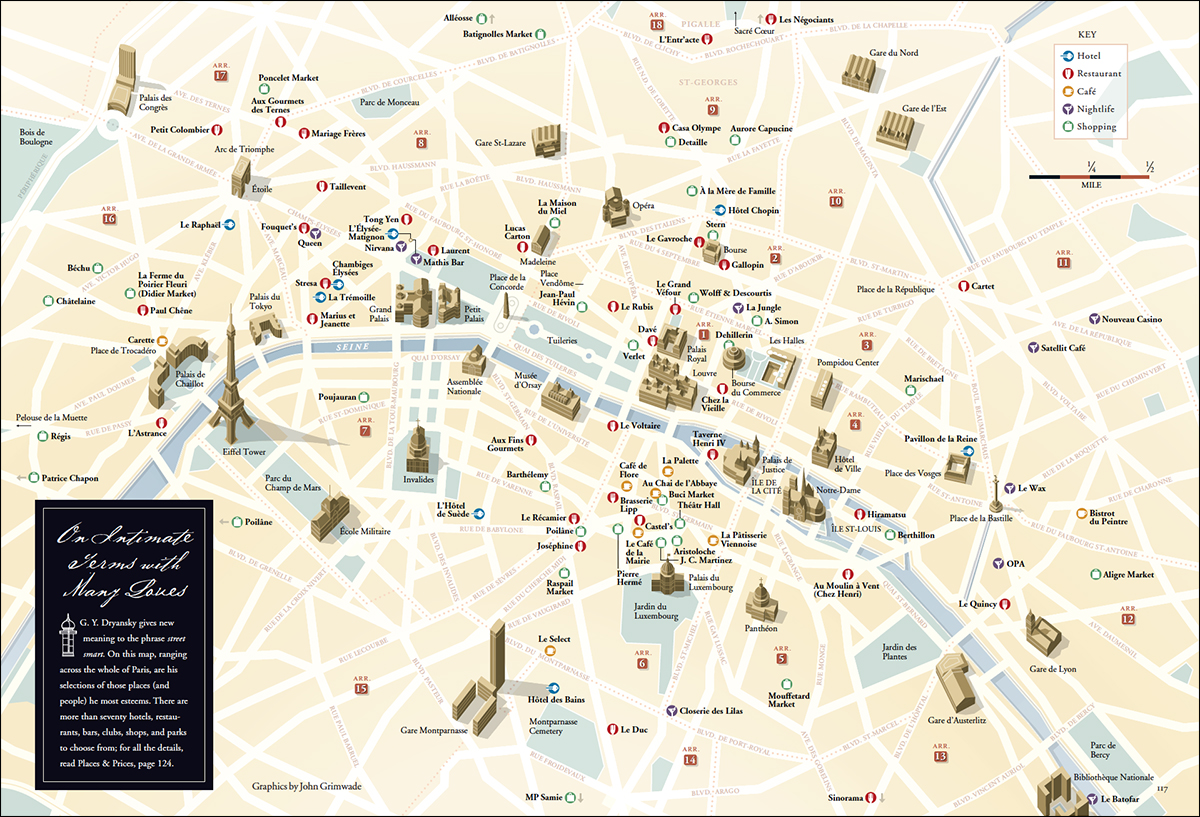
paris

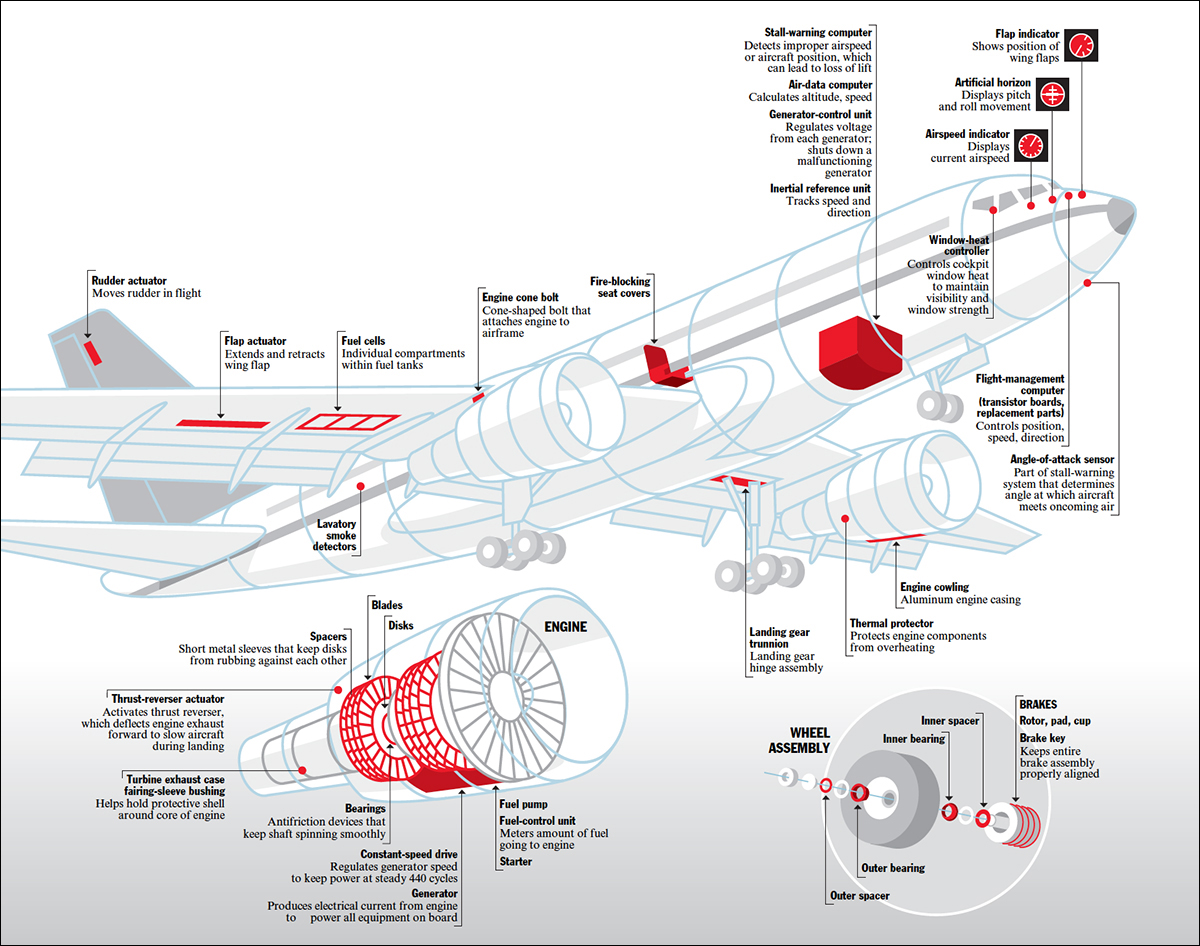
airports

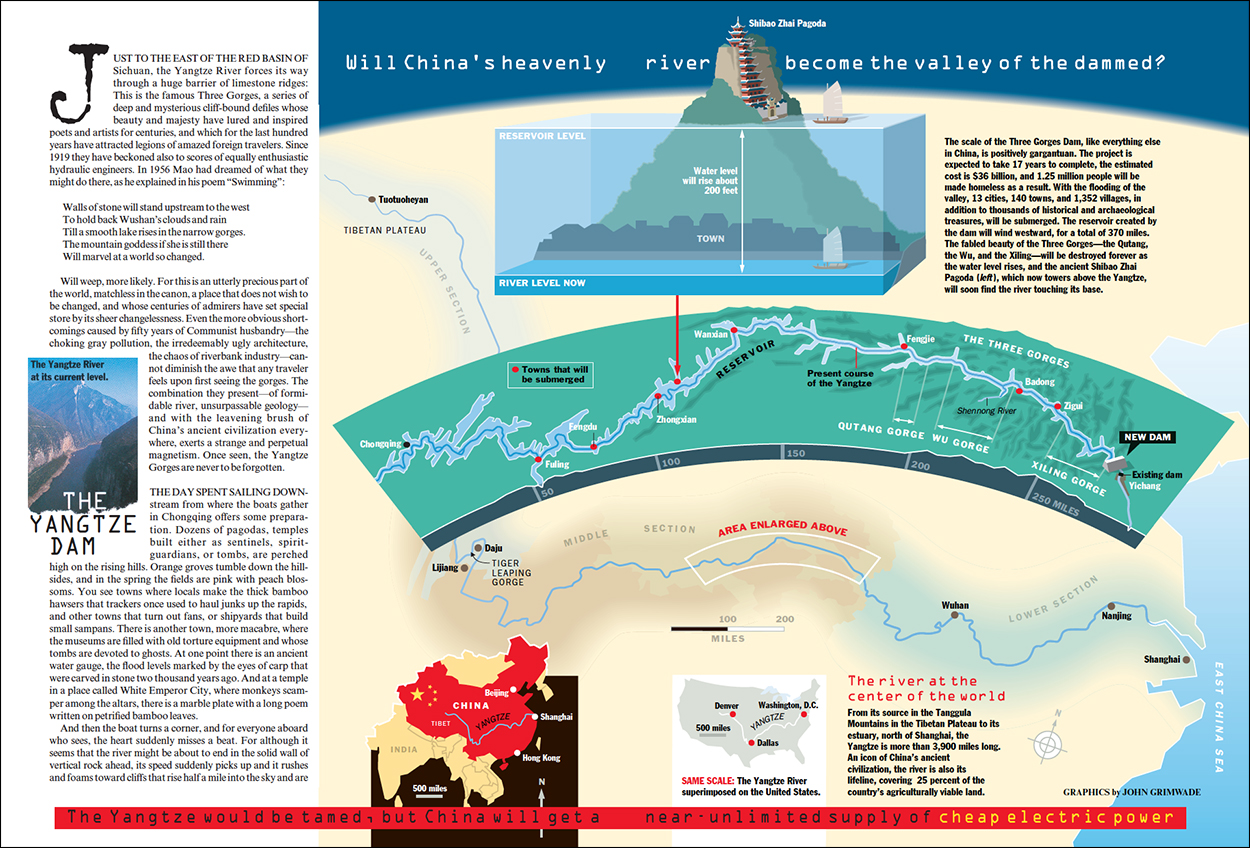
yangzte2

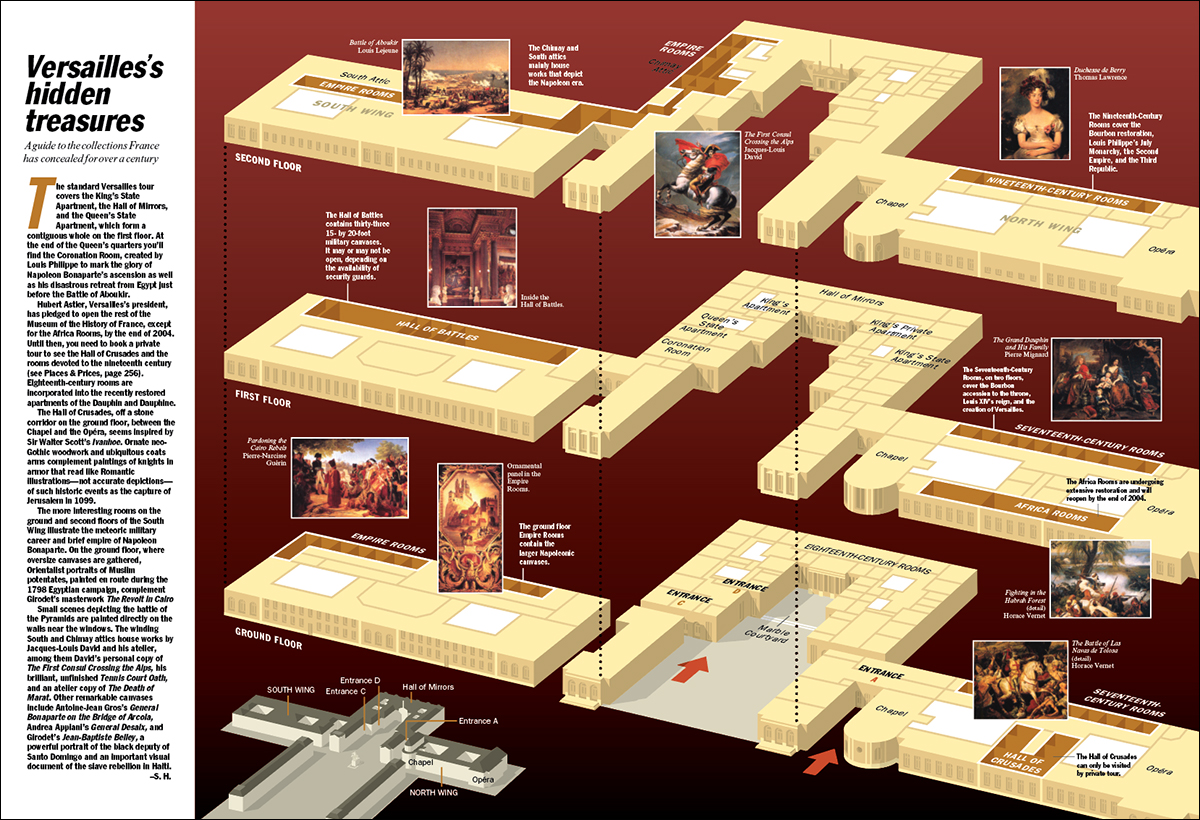
versailles

counterfeit

vegas

rotterdam1

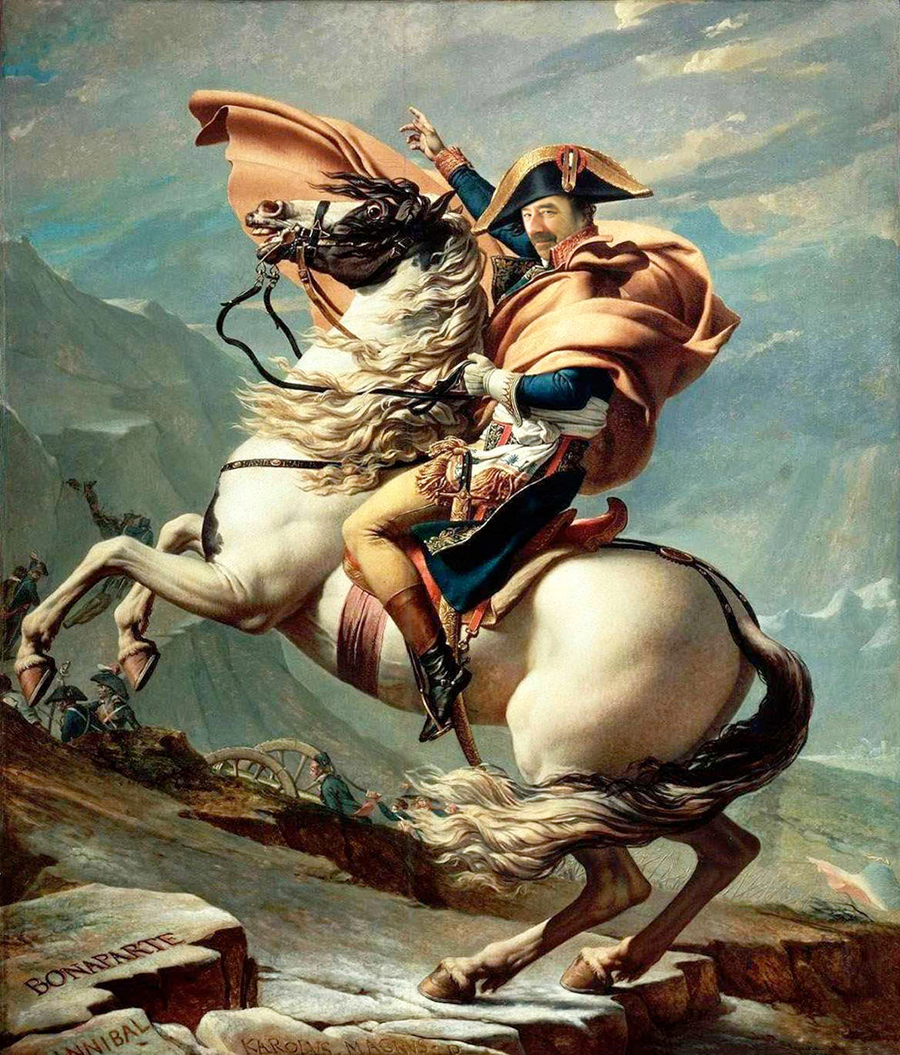
And sometimes I imagined Grimwadia as a small nation full of infographic-minded citizens. I was the king, looking something like this. Riding my faithful horse, Adobe.

napoleon1

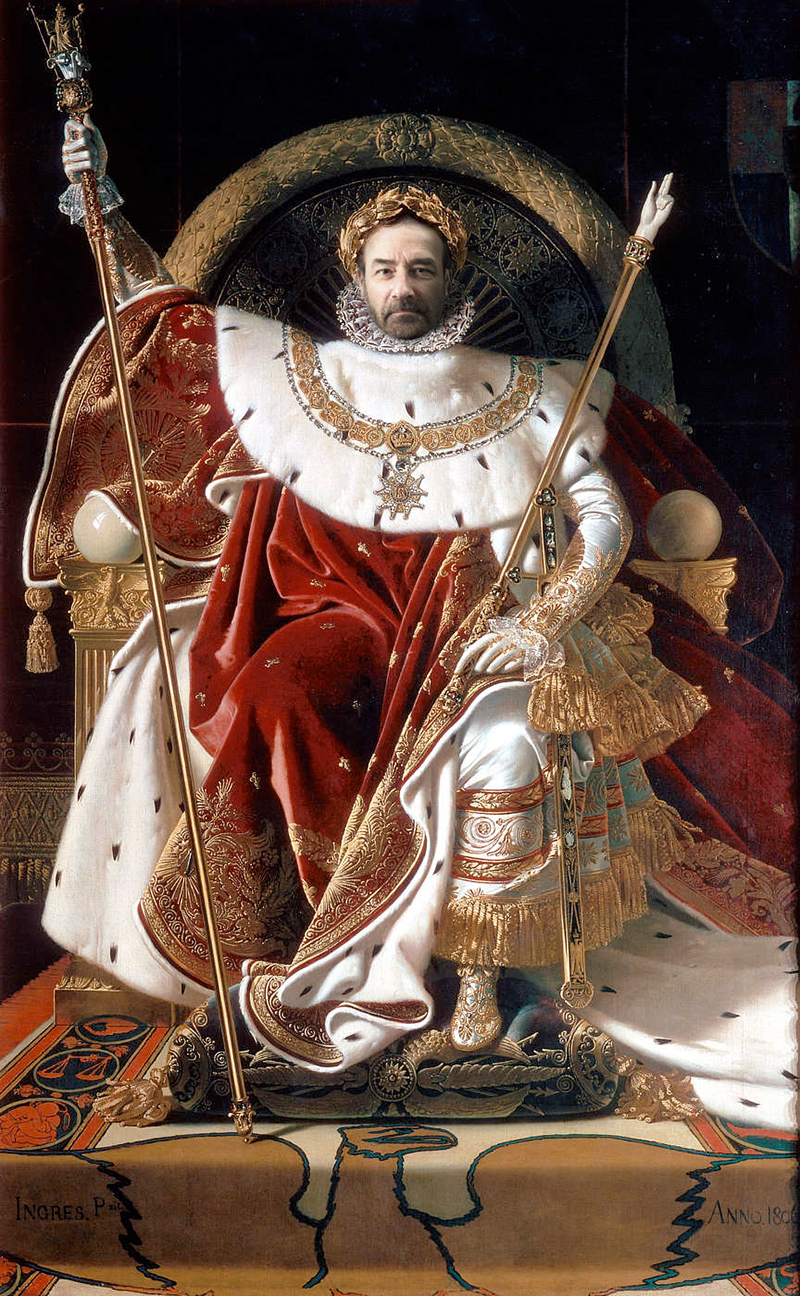
Or the emperor, on my imperial throne.

napoleon2

The globemaker

CUSTOM HANDMADE GLOBES OF THE HIGHEST QUALITY.


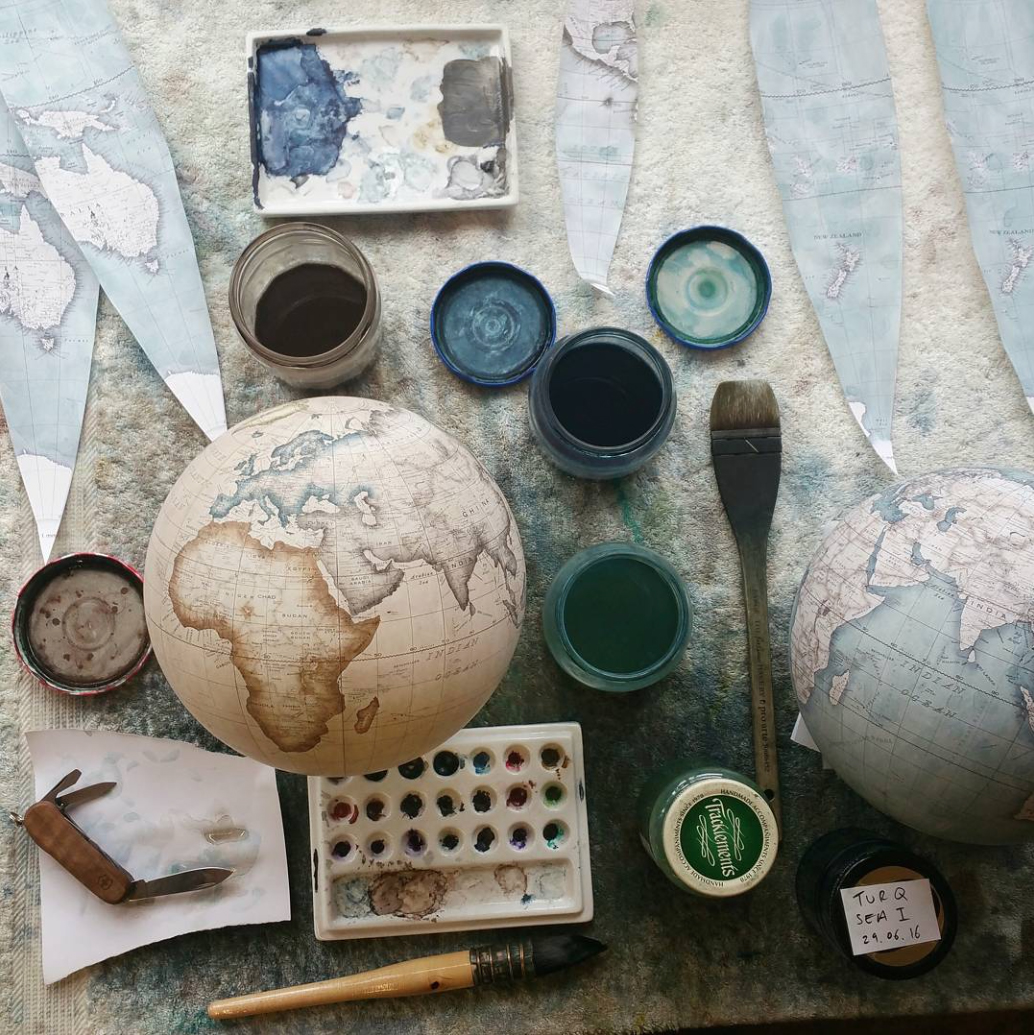
paints

Quotemark1  When you can’t find it, why not make it yourself? QuoteMark2

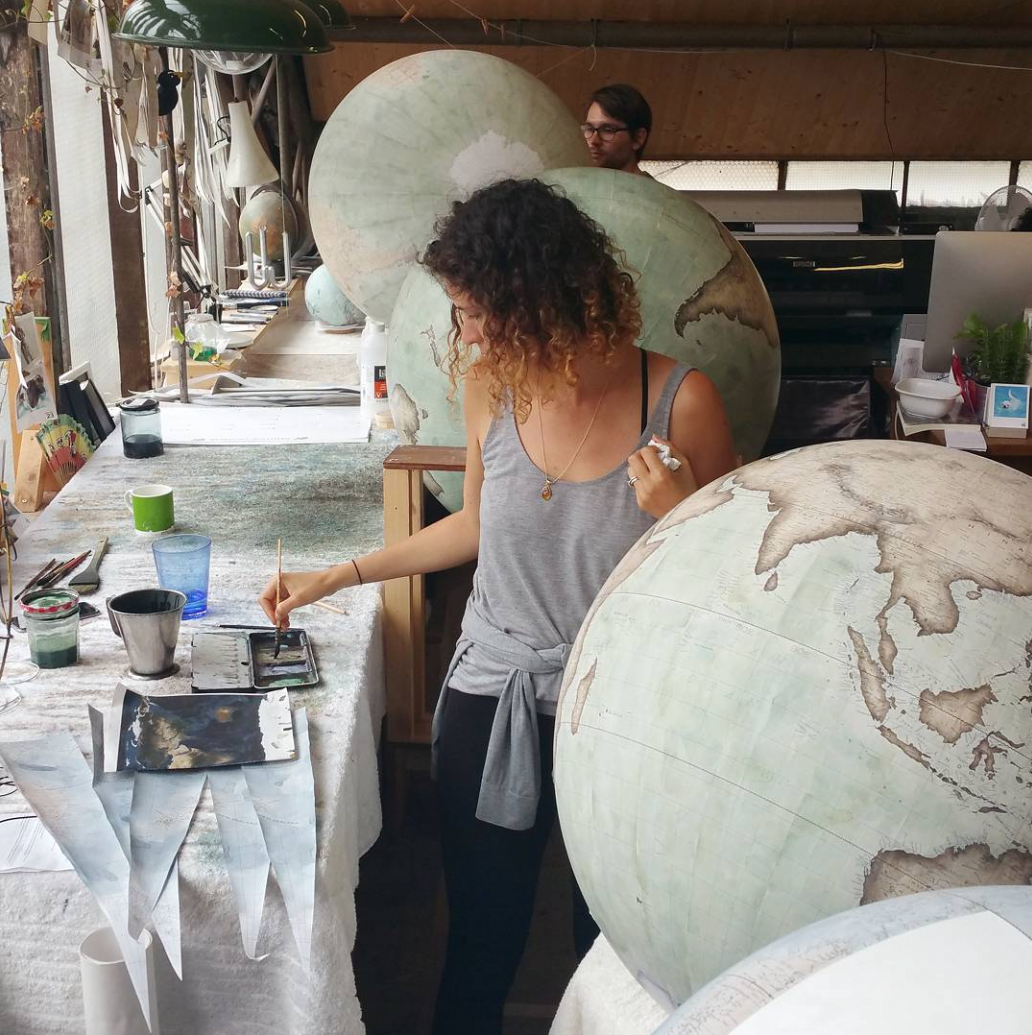
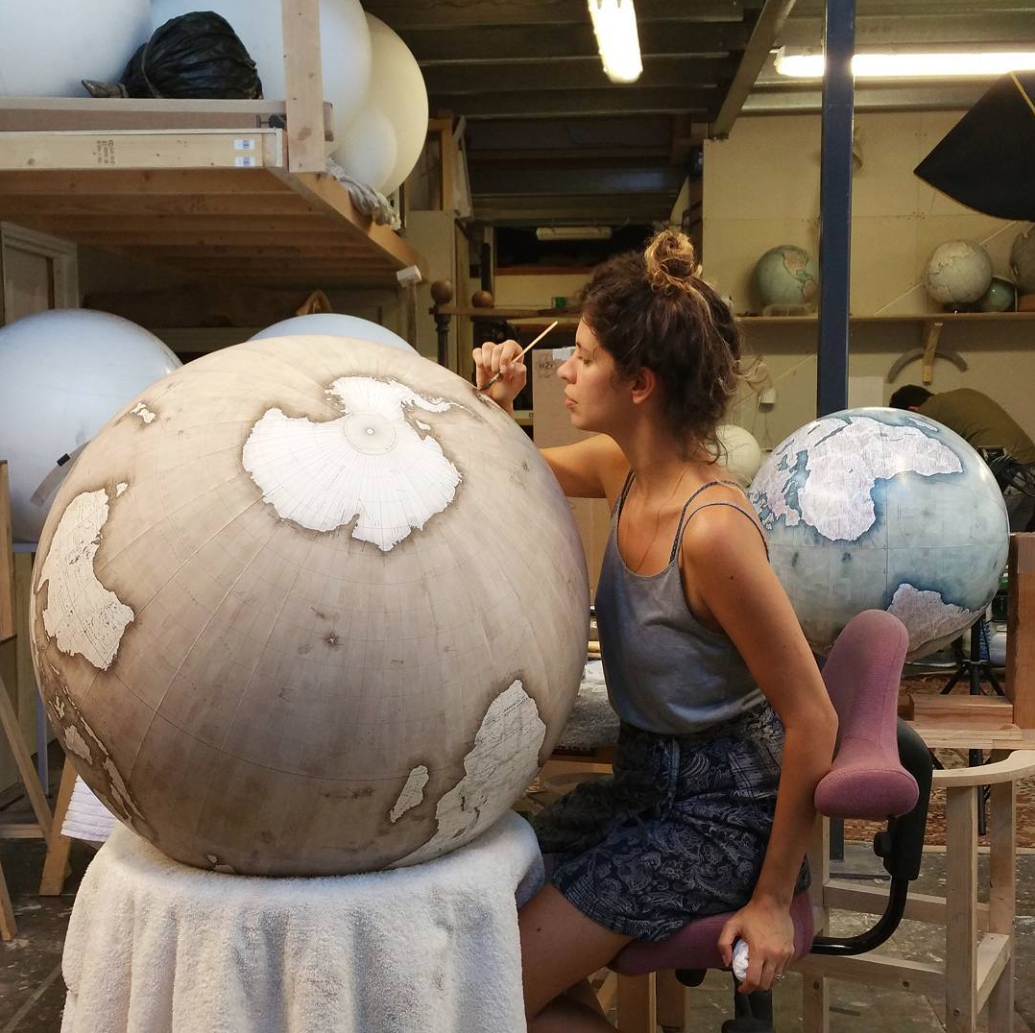
Peter Bellerby was looking for a globe to give as a gift for his father’s 80th birthday, but couldn’t find the right one. So he decided to try and make a globe for his dad, and perhaps another one for himself, and that would be it. But from that limited beginning, he expanded to a small business that was based in his house. Now, he and his team create the globes in a north London studio. (http://www.bellerbyandco.com)

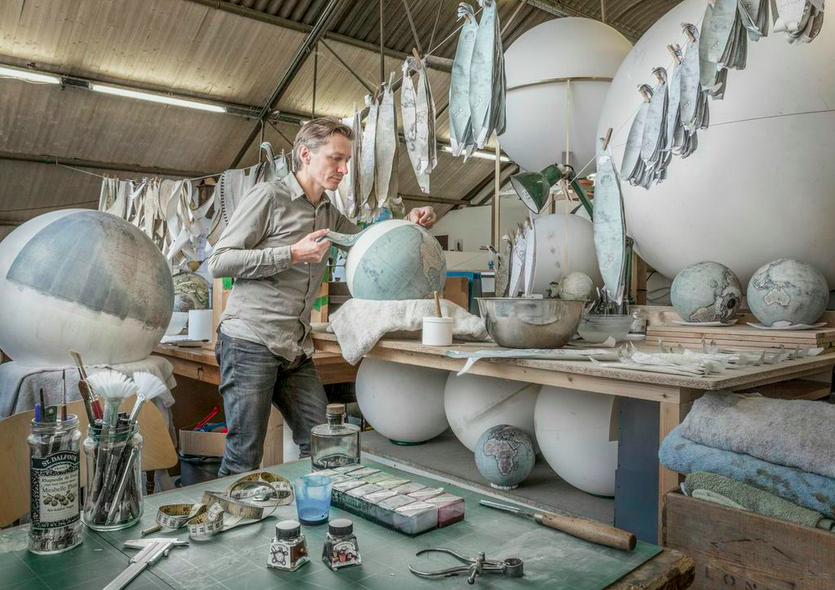
I met Peter at the IC15 conference in Zeist (the Netherlands) and, like everyone else there, I was captivated by the beauty of these hand-crafted globes. Apparently there are only two businesses in the world that make globes by hand. (All photographs courtesy of Bellerby & Co.)

logo

bellerby_a

Peter in the studio. (Photograph by Julian Love.)

largesphere

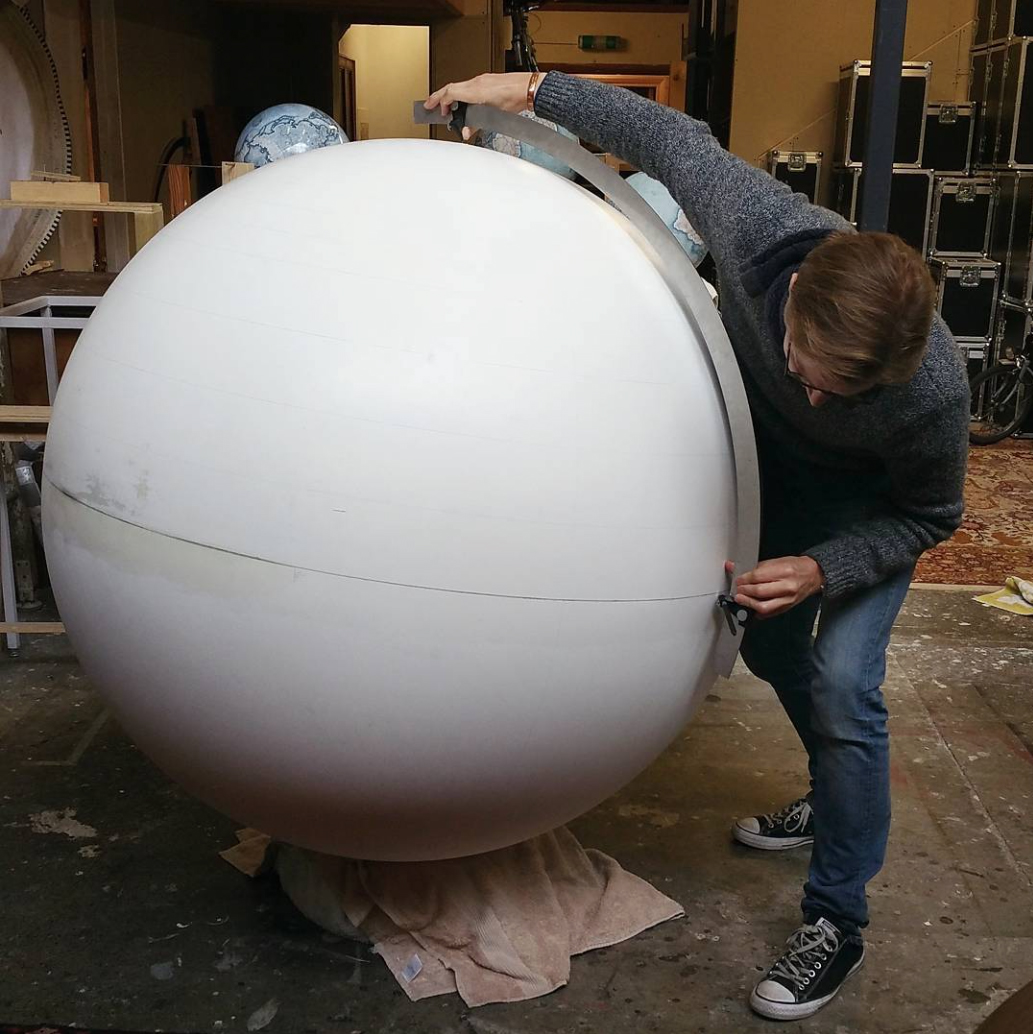
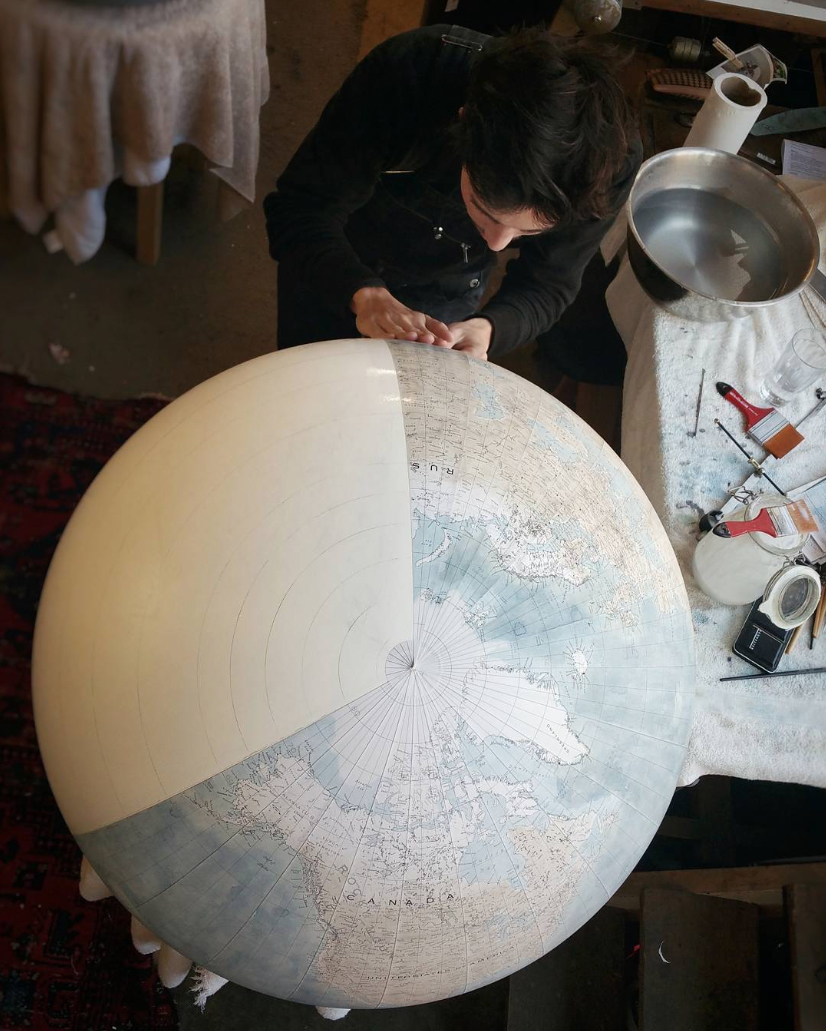
At work on a plaster of paris sphere (above). Below, the process of applying the gores.

gores

Painting the globes.

spheres2

painting2

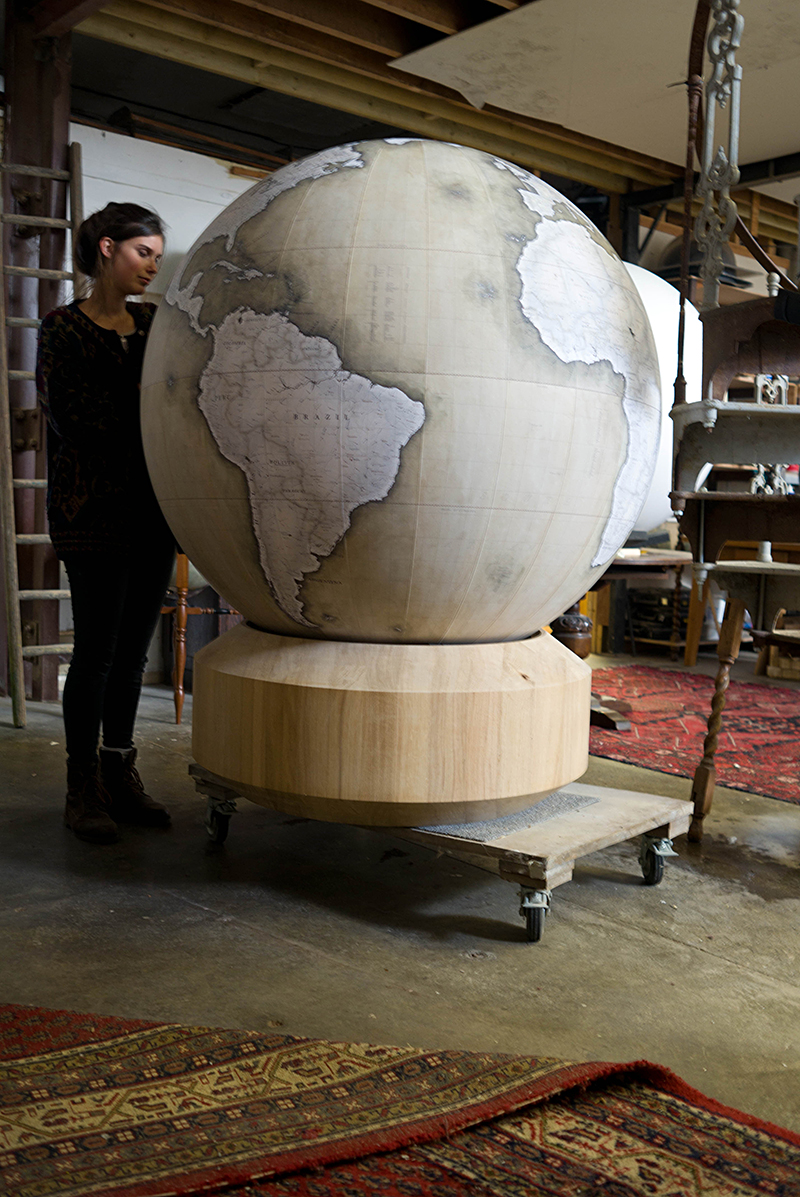
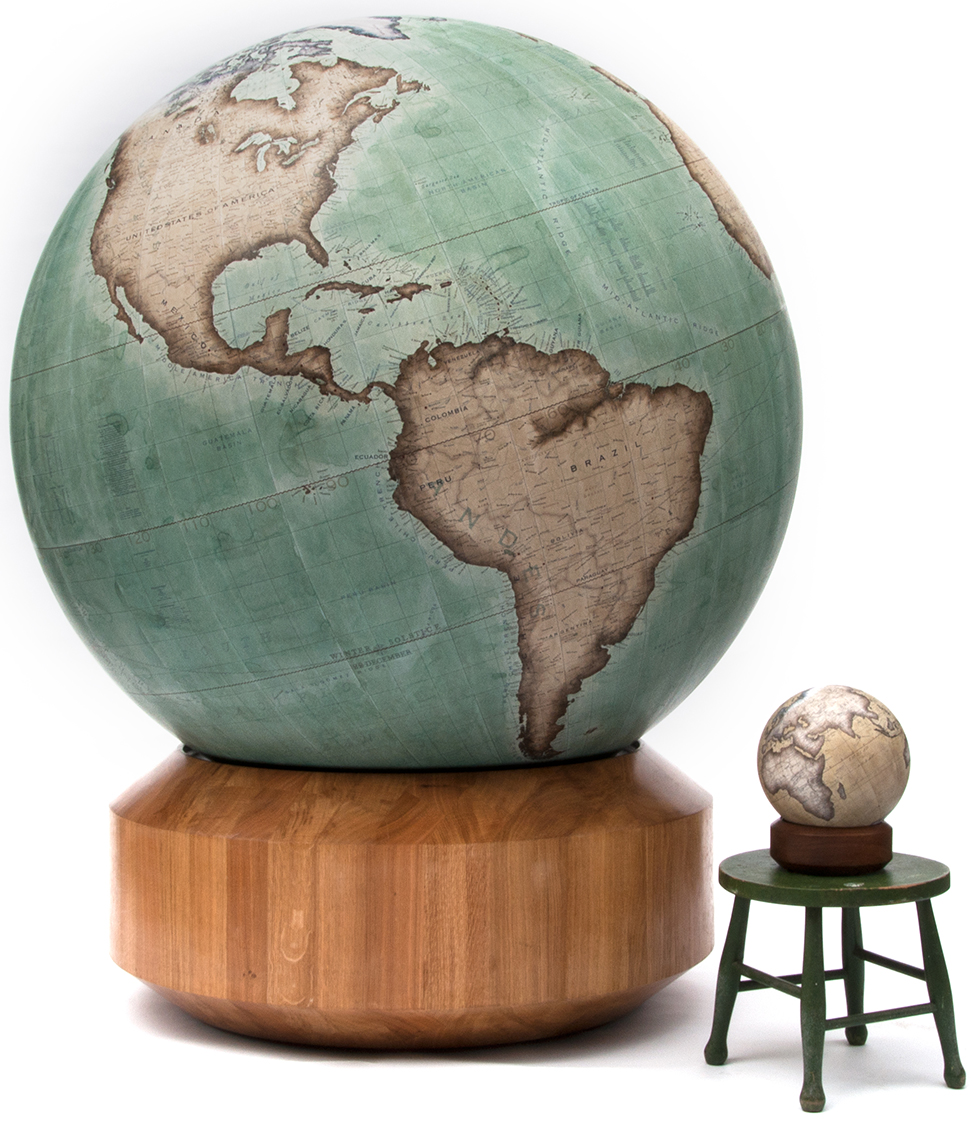
The biggest Bellerby globe.

churchill

churchill

The sizes range from small desk models, which are 9 inches in diameter, to the biggest one in the catalogue, The Churchill, a 50-inch giant that costs £59,000 ($72,000). They plan to make only one of these per year. All the globes have bases with roller bearings for completely free movement.

A really well-made video about the company and their work: https://vimeo.com/63511505


Anatomical

THE HUMAN BODY DIAGRAMMED.

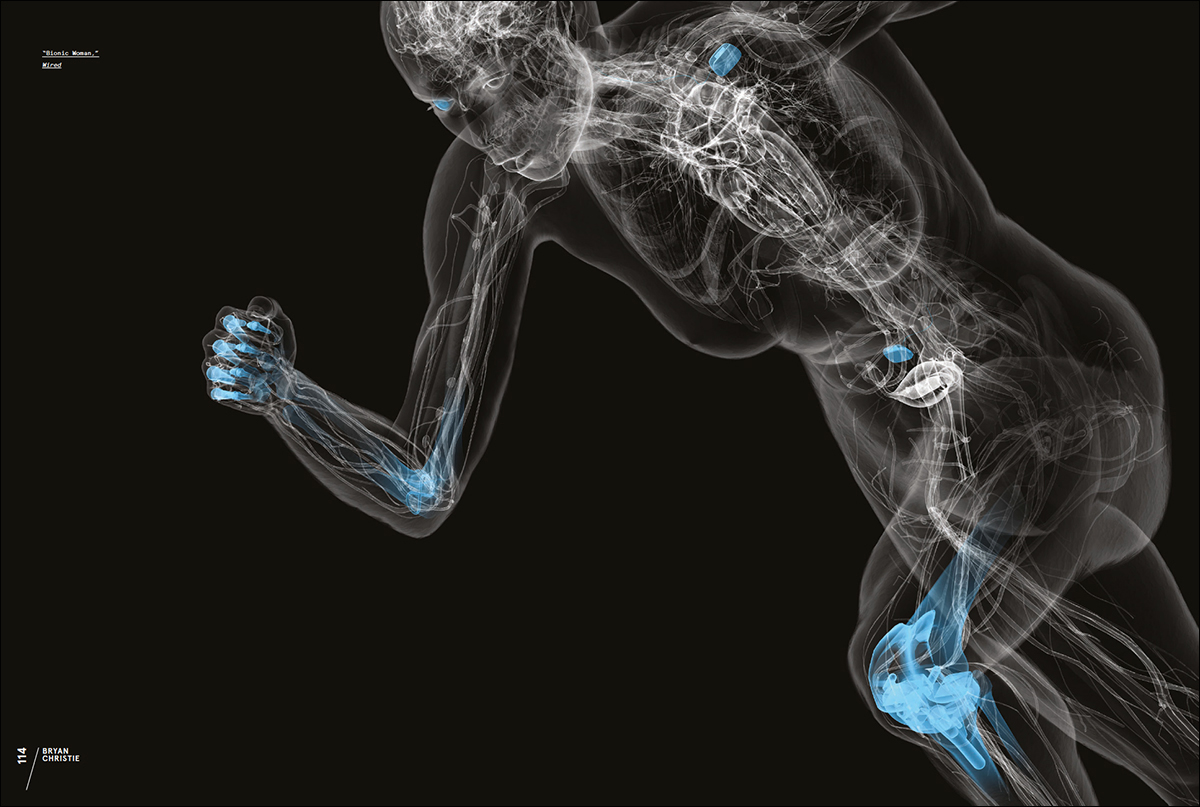
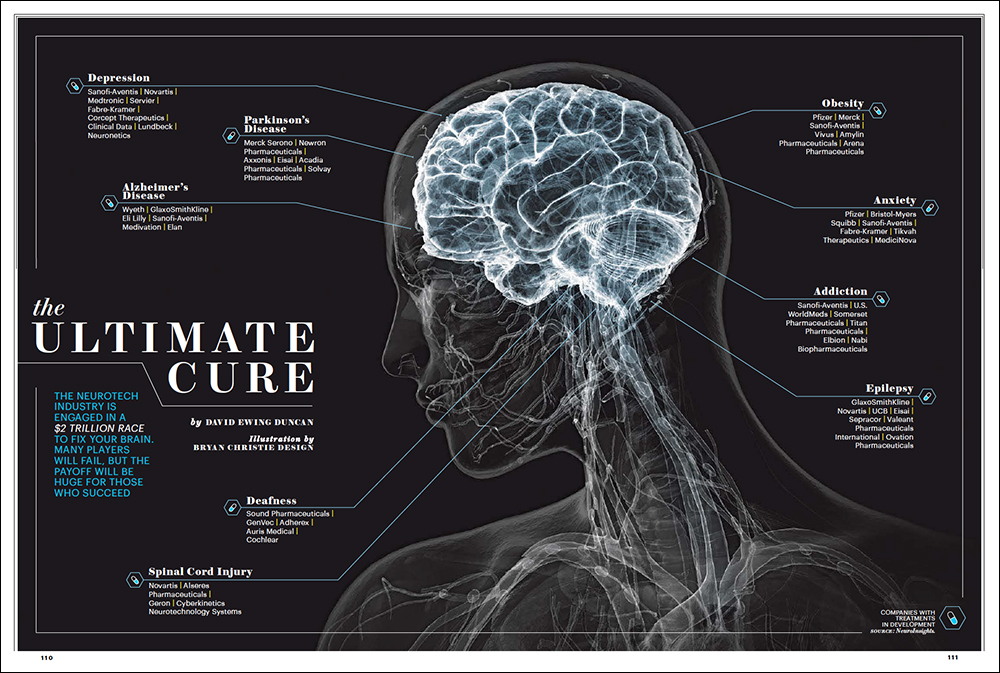
These examples from Bryan Christie Design speak for themselves. Spectacular 3D rendering. Superb control of color to highlight the featured areas. Careful viewpoint and cropping. This is the gold standard.


muscles2


lung_cancer


heart


brain_portfolio2

neurotech


shoulder


wired_cover

Click on the image to see the animation.


CLASSICAL INFLUENCE.

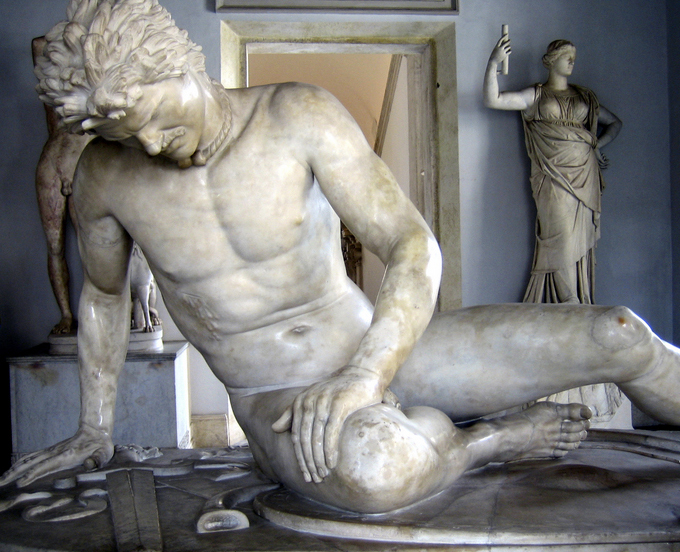
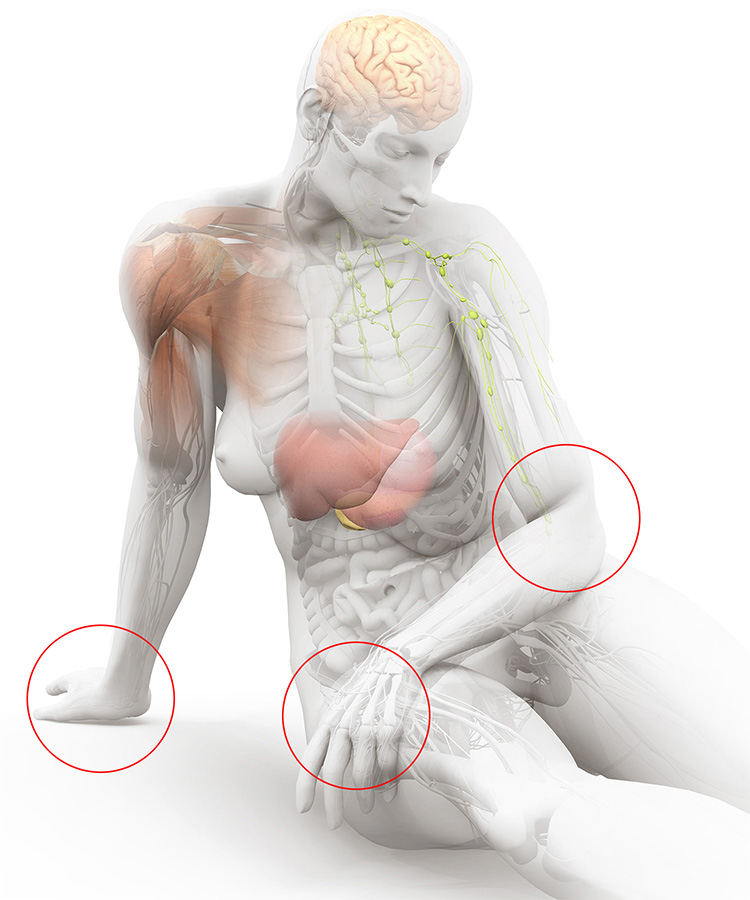
The development of a diagram for a feature on the effects of sleep deprivation on the body. It appeared in the October 2015 issue of Scientific American magazine. The pose was loosely based on the “Dying Gaul,” a Roman copy of a lost Hellenistic sculpture. Classical sources have been a considerable inspiration for Bryan in terms of deciding how to set up particular poses and viewpoints.

dying_gaul1

sleep_deprivation_01

sleep_deprivation_02

sleep_deprivation_03

sleep_deprivation_04

sleep_deprivation_05

Some areas that were not anatomically correct (circled) were fixed in the final version above.

See the studio’s portfolio at: http://www.bryanchristiedesign.com/projects


Color code

REFLECTIONS ON THE UBIQUITOUS PANTONE SYSTEM.

pantone_matthew

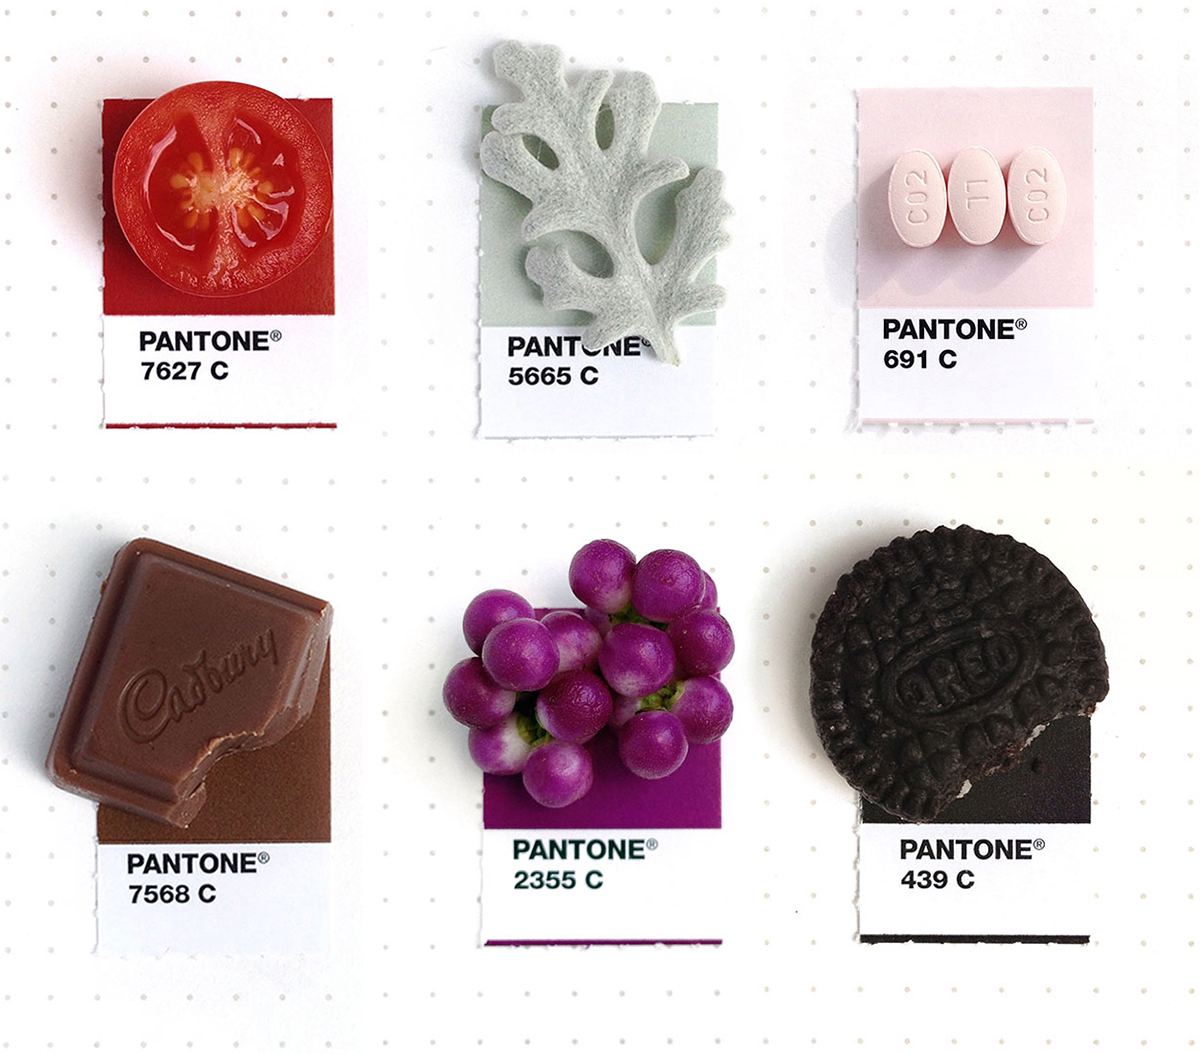
PANTONE MATCH

A brilliantly simple project by Inka Matthew. Why don’t I have great ideas like this? Don’t answer that question, please. Anyway, more examples can be seen here: http://tinypmsmatch.tumblr.com


ornament

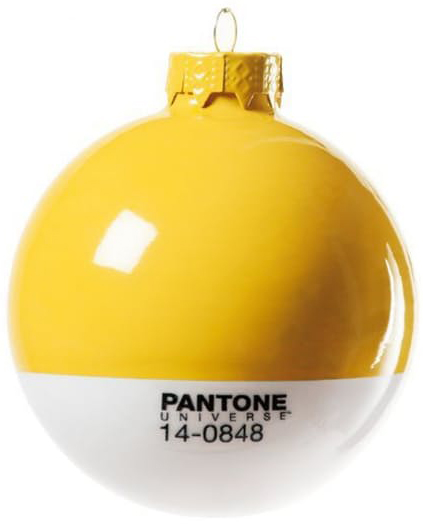
CHRISTMAS CHEER

With the holiday season approaching you might want to start thinking about a designer tree: https://www.shopspring.com/search?query=seletti+pantone

More stuff at Pantone Universe: https://www.pantone.com/pantone-universe


pantone448

THE WORLD’S UGLIEST COLOR

In a 2012 market research survey, 1,000 smokers selected Pantone 448 as the world’s most repulsive color. The Australian government was looking for a suitably awful color to mandate for cigarette packaging. They combined this with shocking images of the effects of smoking in an attempt to reduce cigarette use. Other countries are now following the same track. In May this year, the United Kingdom introduced the same approach.


pantonehotel

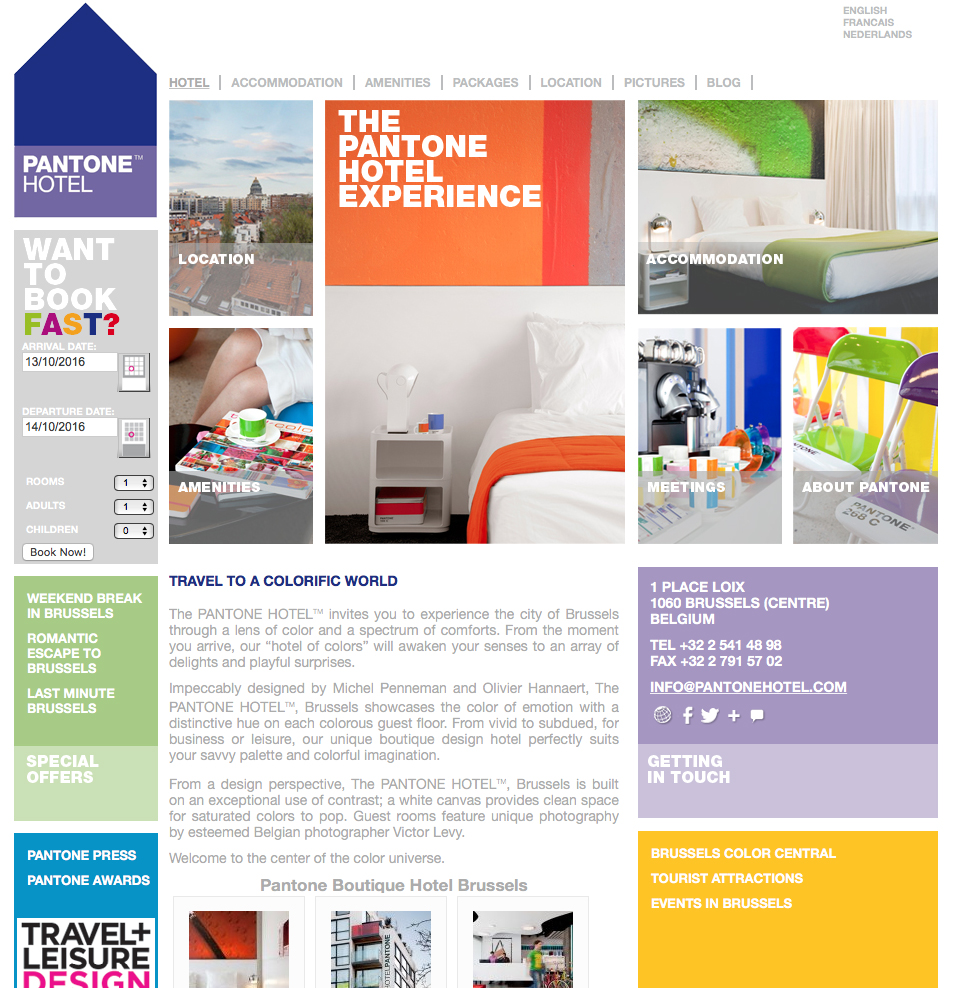
THE PANTONE HOTEL

Next time you’re in Brussels, stay at a hotel that’s a tribute to the color system.

https://www.pantonehotel.com


Old school

ANOTHER TRIP DOWN INFOGRAPHIC MEMORY LANE.

I’ve been looking at my old, pre-computer artwork again. All created with pens, ink, and a fair amount of white paint. In terms of quality, it’s a mixed bag. Not all greatness, by any means, but it has a certain hard-to-resist appeal.


landmark

A selection of architectural items that are protected by English Heritage. (Click on the image to see a larger version.)

I wanted to see what was inside this boxing glove, so I cut it in half with an expensive kitchen knife, which ruined both items.

boxing_gloves

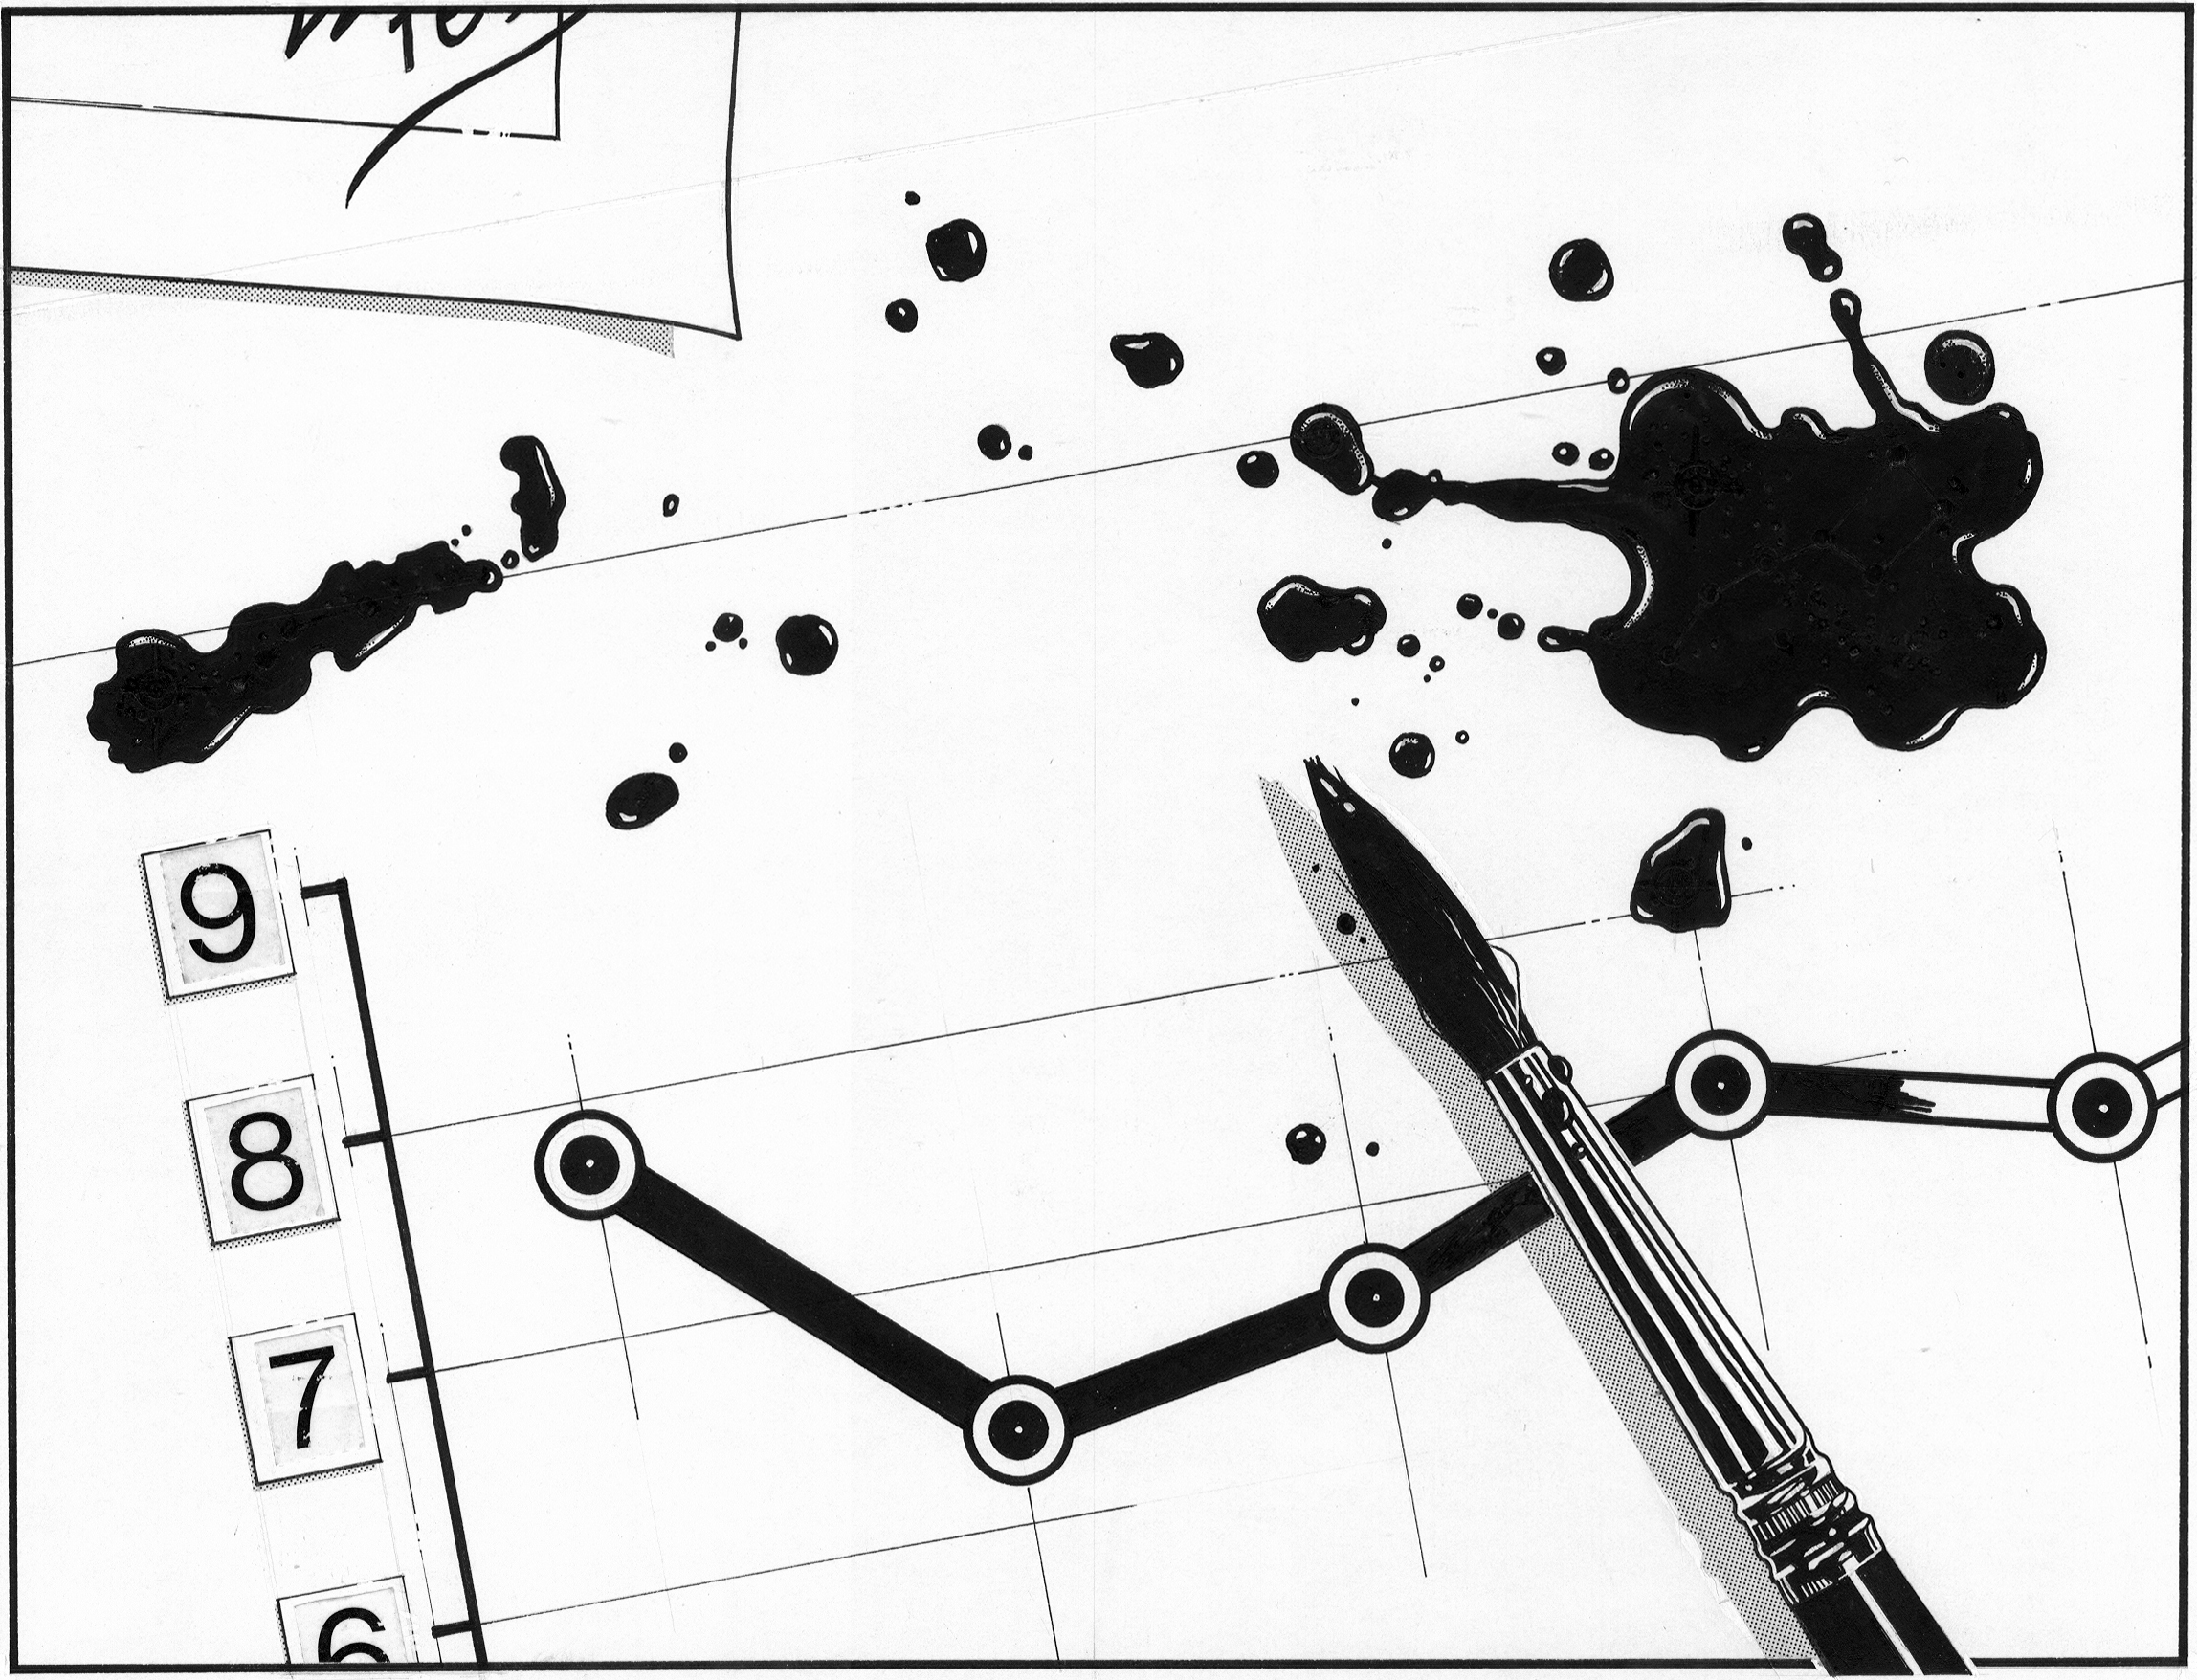
With ink around, sometimes there would be an accident. I had an unfortunate spill over a business chart, so instead of starting immediately again, I illustrated the event. And I have no idea why.

accident1

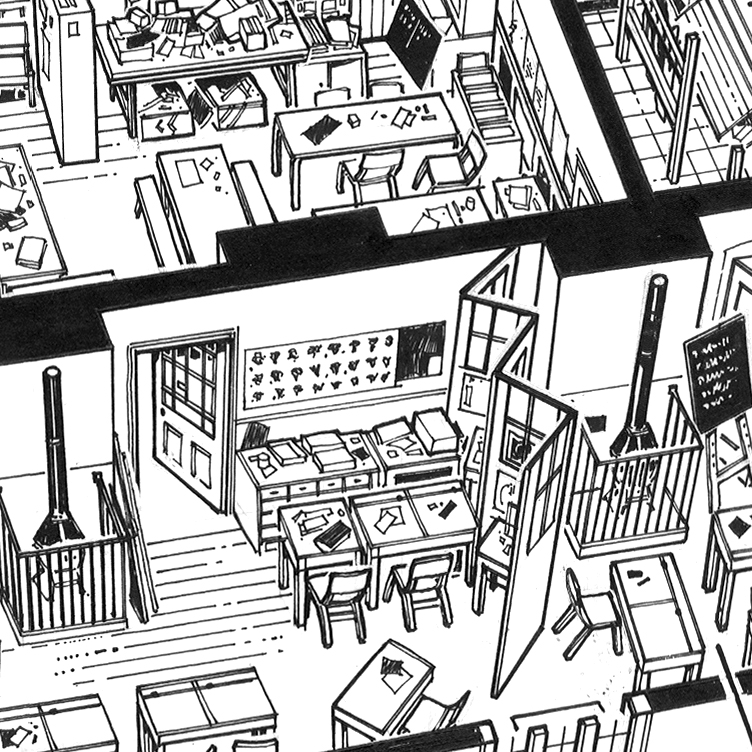
This kind of village school was disappearing. Unfortunately, it looks like all life has disappeared too. That is a problem.

school1

Detail.

school_detail1

cue

Snooker cue Illustration.

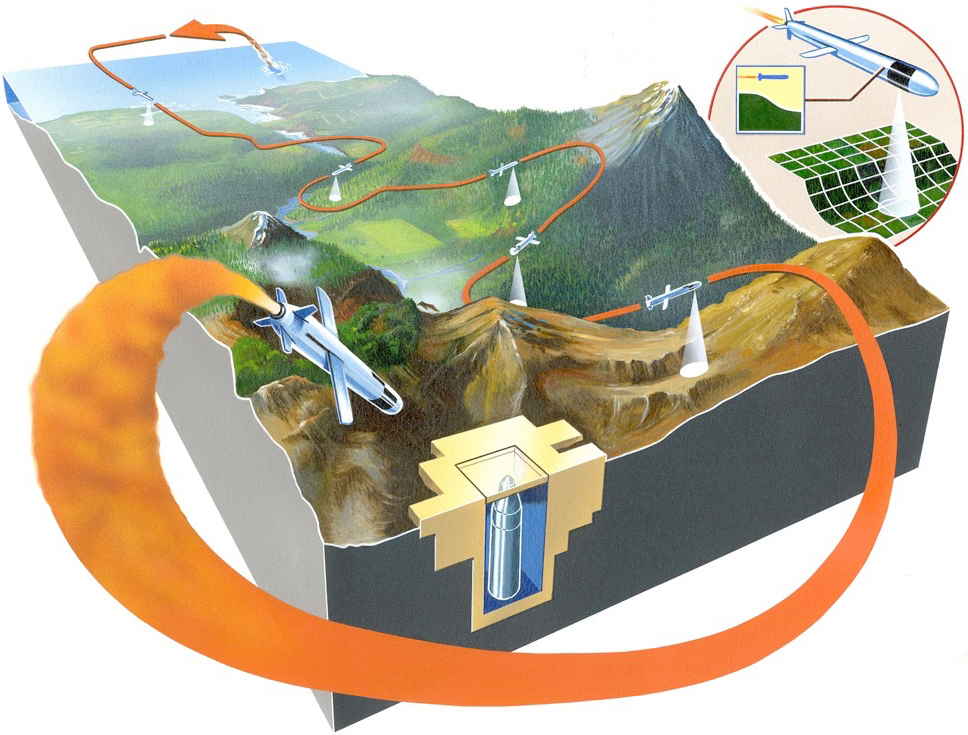
Below is a cruise missile diagram painted with gouache, and airbrushed, that seems somewhat over-worked now. But bear in mind that it was very hard to go backwards in those days. There was no “Command-Z.”

cruisemissile


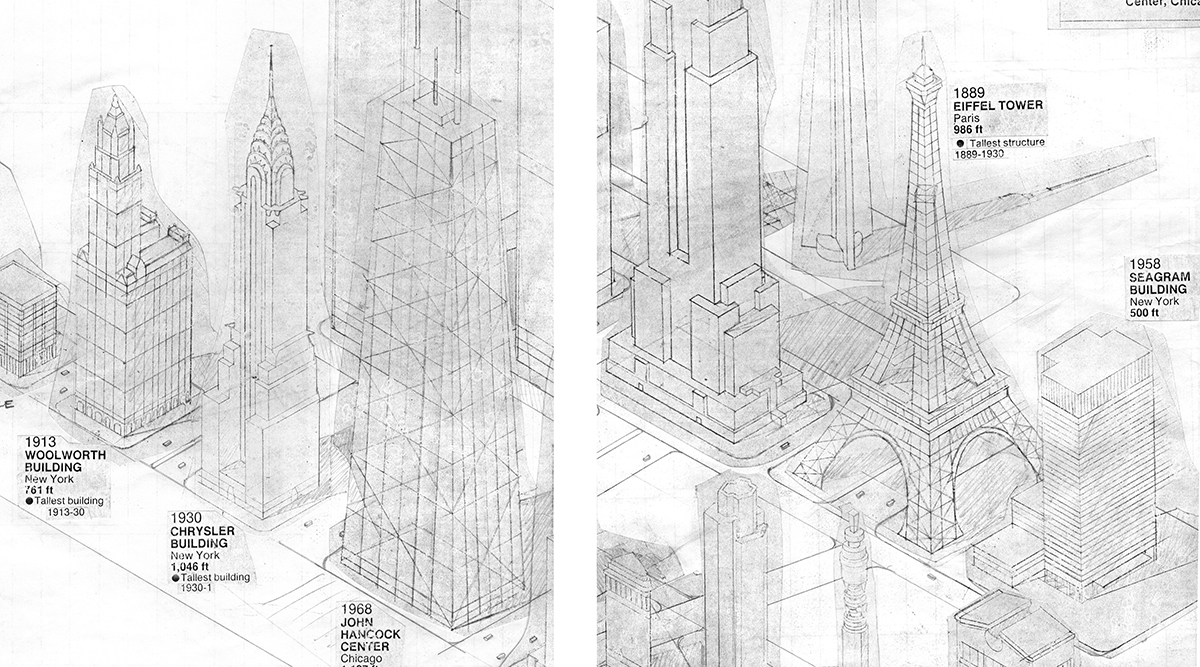
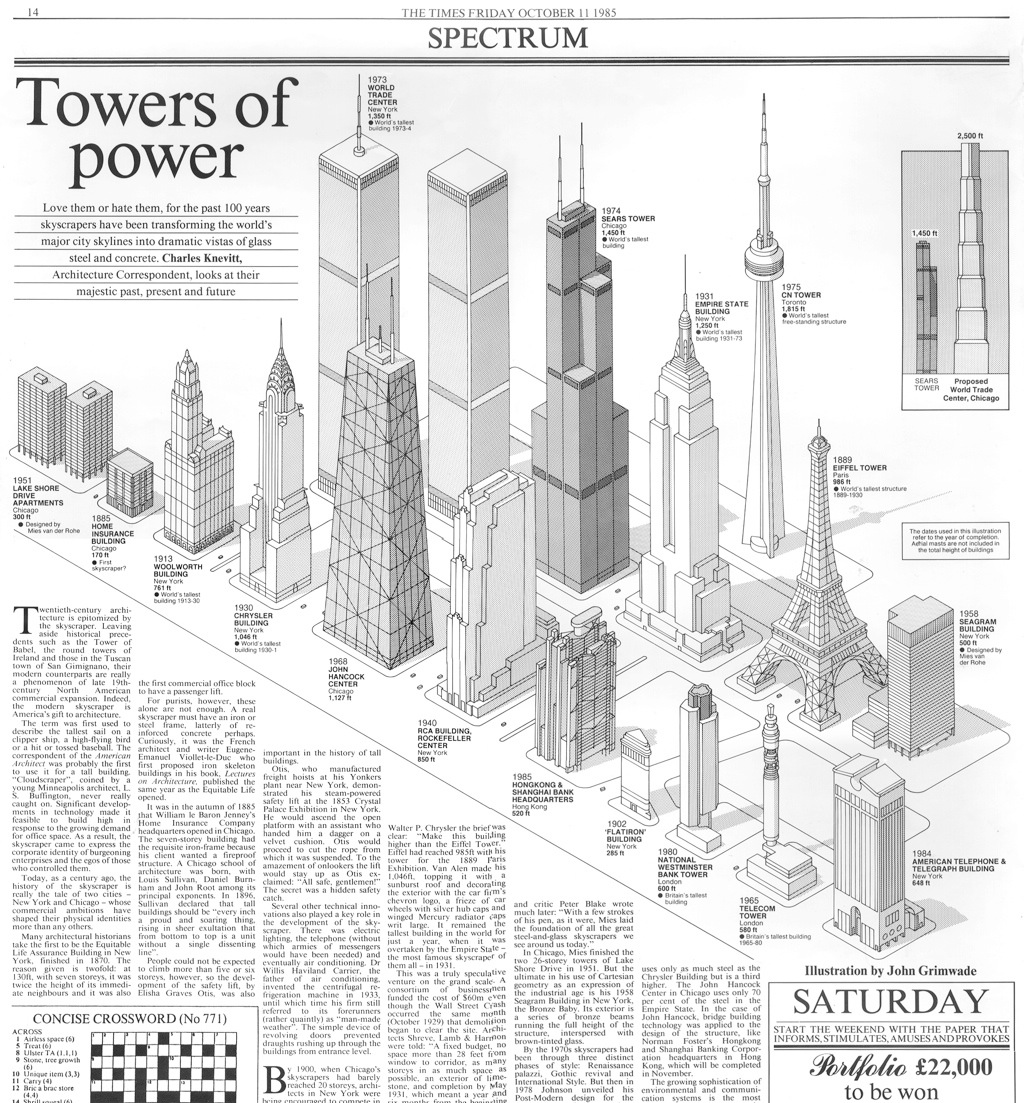
For this tall buildings page, each building was drawn in pencil separately, then xeroxed and assembled as a layout. When I was happy with that stage, I began drawing the various elements in ink.

towers_com_a

towers

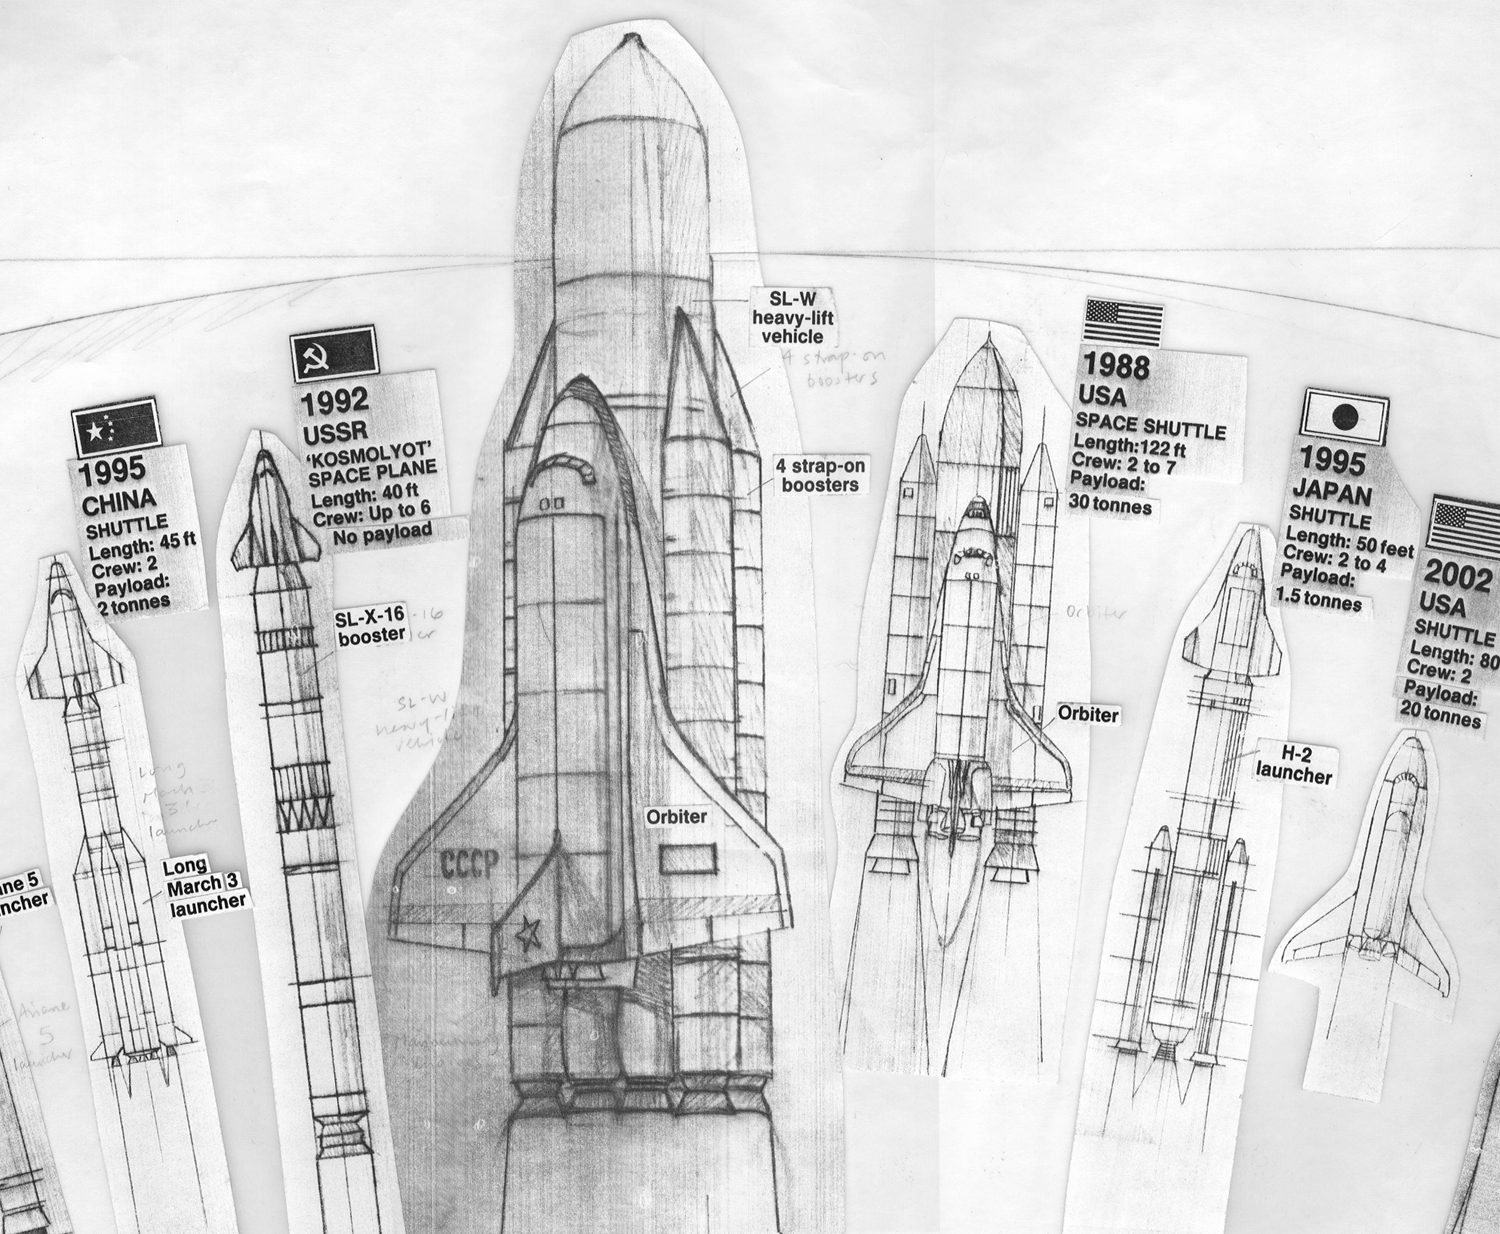
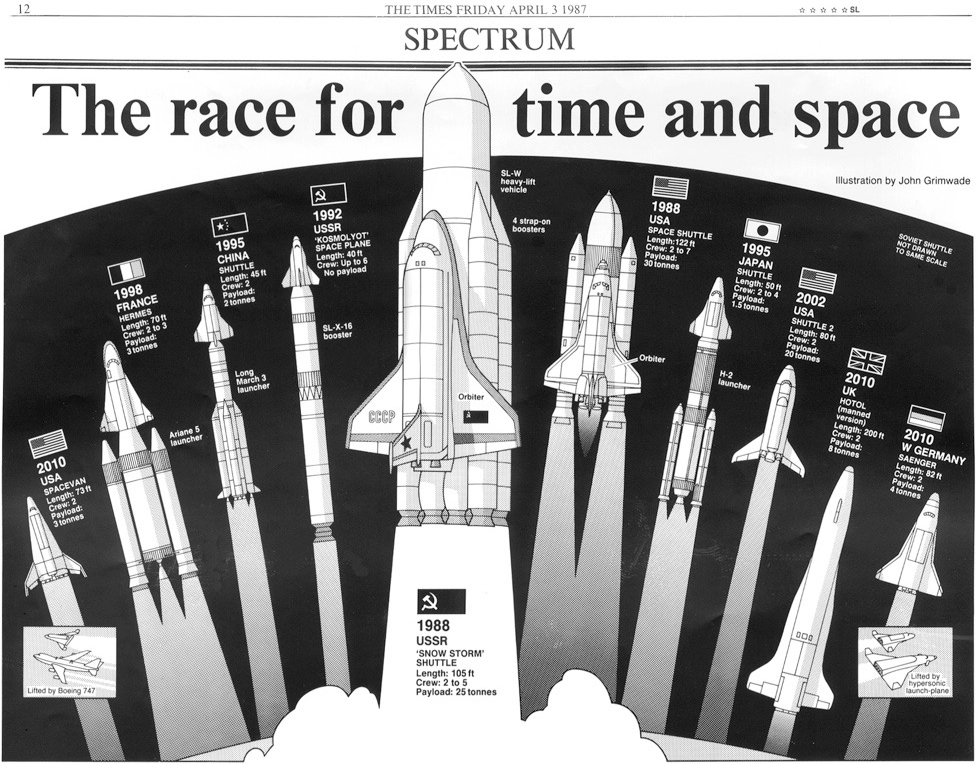
The same process was used for these space shuttle fantasies.

shuttle_comp

shuttles_a


Trees are easy. You can quote me on that.

trees

Pencil power

WHAT’S BETTER THAN A SMALL STORE THAT SELLS ONLY PENCILS?

On a visit last week to CW Pencil Enterprises (https://cwpencils.com) in New York City, I had trouble leaving the premises. There are all kinds of pencils there from around the world, along with sharpeners and notebooks. You can even have the pencils personalized with a 1960s foil-stamping machine. Coincidentally, or perhaps it’s just good karma, the store is right next to the studio of Bryan Christie Design (http://bryanchristiedesign.com). The owner of this pencil-lovers paradise, Caroline Weaver, is (of course) pencil-crazy, which is confirmed by a sizeable pencil tattoo on her arm. She had thought about selling pens as well, but decided to stay faithful to the pencil, and not dilute the concept. Yes, to that!

pencilgift

Pencils are such a great bargain. You can buy someone a beautiful, creative gift for a very reasonable price. Inside the package above are five gems that I chose on my visit.

pencils

pencil_shelves

pencils_erasers

And if you really want to go for it…

VINTAGE GRAPHITE

I talked about the original Blackwing 602 pencil in a previous post (https://www.johngrimwade.com/blog/2016/09/05/the-ultimate-pencil/). You can see a Palomino Blackwing Grand Piano Box Set in the photo above. Go to eBay and see if you can get a Eberhart Faber original set for less than $400. I have not bought one. Yet.